



Candlestick Patterns: How Traders Read Price Action on a Chart


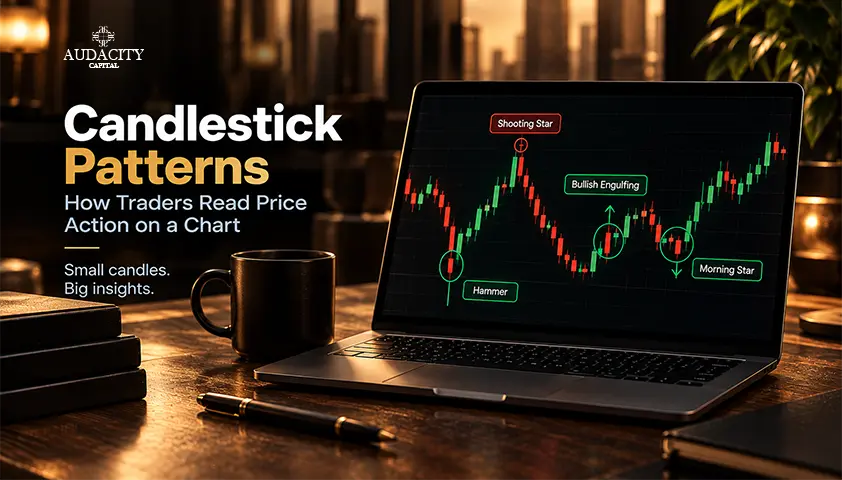
Candlestick patterns are little images that form on a price chart. These patterns give different indications:
- What happened to price during a said period.
- If the buyers or sellers were stronger during a particular period.
- Whether neither side had clear control.
The pattern itself does not tell us what will happen next. It is the overall market conditions and the reaction near that pattern that give it relevance.
Let’s understand it in detail:
Candlestick patterns are shapes used for analysis in trading. They form from the way price moves during a particular period.
With each candlestick, traders can see prices in form of open, high, low, and close. They use them to track shares, gold, crypto, and more.
- Open: The price at the start
- Close: The price at the end
- High: The highest price reached
- Low: The lowest the price dropped to
The wide part of the candle is called the body. It stretches from the open to the close. The thin lines above and below it are called wicks, and they show how high and how low the price went.
The colour shows how the period finished. If price closed above where it opened, the candle is considered bullish and is usually shown as green. If it closed lower, it's bearish (usually red). That's a lot more than a simple line chart gives you, since a line only shows where the price ended.
A candlestick pattern is what you get when one, two or three candles form a shape traders recognise. A Hammer is a single candle. A Bullish Engulfing pattern needs two. A Morning Star needs three.
Knowing the names isn't enough, though. What the price was doing before the pattern, and where on the candlestick pattern chart it shows up, change what it might mean. A Hammer after a long fall is a very different story from a Hammer in the middle of nowhere.
How to Read a Candlestick?
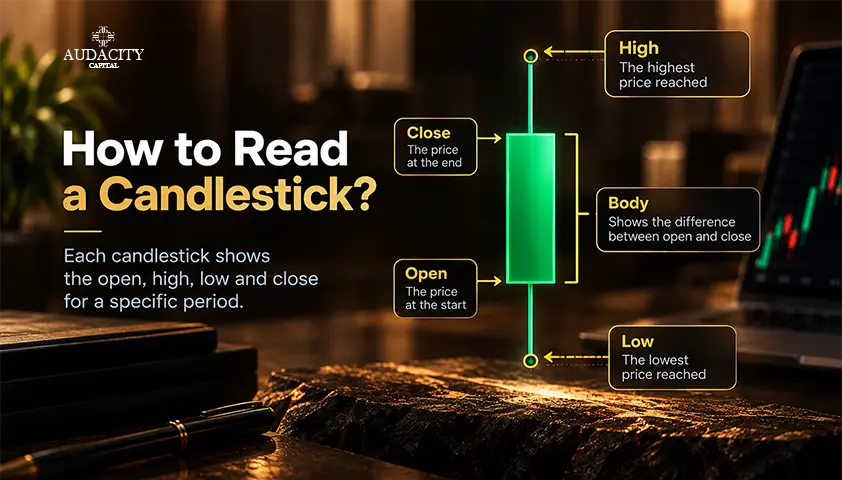
A candlestick has a body and one or two wicks. These parts show how price moved during the period, and each part can give a little more information about what buyers and sellers were doing.
The Body
The body shows the difference between the open and the close.
A large bullish body means the price closed well above where it opened. This could show strong buying during that period. A large bearish body shows that the price closed well below the open, which could point to stronger selling.
A small body is different. It shows that the open and close were closer together, so neither side moved price very far by the end of the period.
The Wicks
Those thin lines on top and bottom of the body are the wicks or shadows. The upper wick is the session high; the lower wick is the session low.
A stretched lower wick can show that sellers tried to drive price down, but buyers came in before the end. A stretched upper wick can show buyers tried to push higher before sellers stepped back in.
What the Candle Could Tell You?
When we look at the body and wicks together, a candle could show:
- Strong buying or selling
- Rejection of higher or lower prices
- A lack of clear direction
- A change in short-term pressure
But the candle is only showing what happened during that period. It does not tell traders what price must do next.
Part of the candle | What it shows |
Body | Difference between open and close |
Upper wick | Highest price reached |
Lower wick | Lowest price reached |
Common Candlestick Patterns
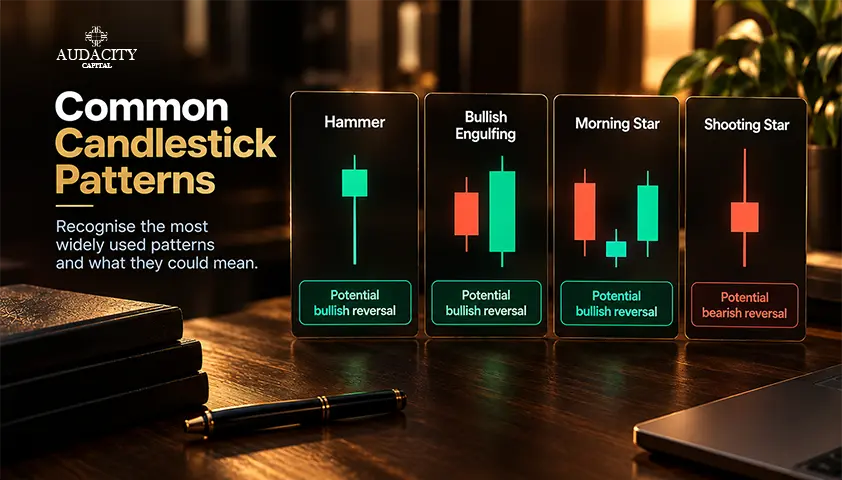
The trading world is full of candlestick patterns, but you don't have to know them. Just focusing on the most frequently seen ones will get you started.
Some patterns are bullish, some are bearish, and others mainly show that the market is uncertain. When we look at these patterns, the same rule still applies: the pattern needs to be considered with the price action around it.
Bullish Candlestick Patterns
The Hammer candlestick pattern appears when price falls during a period but then moves back towards where it opened before the candle closes. It normally has a small body and a long lower wick.
When we look at the candle, the lower wick shows how far sellers managed to push price before buyers brought it back up. That could be a sign that lower prices were rejected.
The Hammer is normally looked for after a decline. A Hammer appearing in the middle of a sideways market would not have the same meaning.
Bullish Engulfing
There are two candles in the bullish engulfing pattern. The first is bearish, and the second is bullish, with a larger body that covers the entire first candle.
It can show that selling pressure was followed by stronger buying pressure. When it appears after a decline, traders may watch the pattern for signs that the direction of price could be changing.
It is still not a guarantee of a reversal. The area where it forms and what happens after the second candle matter as well.
Morning Star
The Morning Star is formed from three candles after a period of falling prices. The first candle shows selling, the middle candle is smaller, and the third candle moves higher.
When we look at the three candles together, the pattern could suggest that the selling move is starting to lose strength.
It does not mean that price has to turn higher, though. The next price movement still matters.
Shooting Star
A Shooting Star shows a different type of rejection. Price moves higher during the period and then falls back towards the open before the candle closes.
This leaves a long upper wick and a relatively small body. When it appears after a rise, the candle could suggest that buyers were unable to keep control of the higher price.
A trader would still need to look at what happens next before treating it as a possible reversal.
Bearish Engulfing
Now comes Bearish Engulfing, a pattern which is exactly opposite of the Bullish Engulfing we discussed above. In this, the first candle moves higher and the second moves lower. Upon looking at them both, the second one displays how sellers have taken greater control than they had during the first candle.
If the pattern appears after a strong rise, it could be worth watching. It still needs to be considered with the rest of the candlestick pattern chart.
Evening Star
An Evening Star forms after a period of rising prices. The first candle is bullish, followed by a smaller candle, and then a bearish candle.
The change across the three candles could show that buyers are losing some control. However, the pattern is not a guarantee that price will fall.
Doji and Spinning Top
A Doji forms when the open and close are very close to each other. A Spinning Top also has a small body, but it normally has wicks above and below it.
Both can show that the market is uncertain. Buyers may have pushed price higher, sellers may have pushed it lower, but neither side managed to keep a clear advantage by the close.
That does not mean a reversal is about to happen. The candle is better treated as a reason to look more closely at the price action that follows.
Pattern | Candles | Usually appears | What it could show | What to look for |
Hammer | 1 | After a decline | Rejection of lower prices | Long lower wick and what happens next |
Bullish Engulfing | 2 | After a decline | Buying pressure may be increasing | Second candle takes over the first candle's body |
Morning Star | 3 | After a decline | Selling pressure may be weakening | Stronger bullish third candle |
Shooting Star | 1 | After a rise | Rejection of higher prices | Long upper wick and following price action |
2 | After a rise | Selling pressure may be increasing | Second candle takes over the first candle's body | |
Evening Star | 3 | After a rise | Buying pressure may be weakening | Bearish third candle |
Doji | 1 | Anywhere | Indecision | What price does after the Doji |
1 | Anywhere | Uncertainty | Whether buyers or sellers take control afterwards |
What Does the Hammer Candlestick Pattern Show?
The Hammer candlestick pattern is usually found after price has been falling. It has a small body near the top of the candle and a long lower wick.
The lower wick shows that price moved down during the period but then came back up before the candle closed. This could mean that sellers were able to push price lower, but buyers were willing to step in at those lower prices.
Where the Hammer appears is important. A Hammer around a support area could be more useful than the same candle appearing in the middle of a sideways market.
The next price movement also matters. A trader may wait for another bullish candle or other signs that the price is holding before deciding what the Hammer means.
A Hammer can therefore be a warning that the selling move may be losing strength and not a guarantee that the price will reverse.
How to Read Candlestick Patterns in Context?
Take the candlestick pattern out of the chart, and you will understand it better. But when we put it back into the market, there are other things to consider.
Look at the trend
The same pattern could have a different meaning depending on what price was doing before it appeared. A Hammer after a long decline is different from a Hammer that appears during an upward move.
Look at support and resistance
Price levels can also make a difference. A bullish pattern forming around support could be more interesting than the same pattern appearing between two important levels.
This is where support and resistance can help give a candlestick pattern some context.
Look at the timeframe
A candle on a five-minute chart represents a much shorter period than a daily candle. Both can show useful information, but they are showing different periods of price movement.
Look at volume
Volume can give some additional information about the move. A large price movement with stronger trading activity could be worth looking at more closely than a similar move with very little activity.
Look at what happens next
The next candle could confirm the move, reject it, or simply show that the market is still uncertain.
That is why traders should treat candlestick patterns as part of the candlestick pattern chart and not the entire trading decision.
How Traders Use Candlestick Patterns?
In different parts of a trade, candlestick patterns play an important role but they should not decide everything on their own.
Possible entries
A trader may use a pattern as confirmation when price reaches an area already being watched. For example, a Hammer around support could give a trader a reason to watch for a possible long setup.
That is different from buying every time a Hammer appears.
Stop losses
The candle can also help show where the trade idea could be wrong. With a Hammer, for example, a move below the candle's low could mean that the expected rejection of lower prices has failed.
Profit targets
Candlesticks do not automatically tell traders where to take profit. A target could instead come from the next resistance area, a previous high, or another part of the market structure.
Breakouts
Candles can also help when price reaches a support or resistance level. A close beyond the level could show that price has moved through it, while the candles that follow can help show whether the move is holding.
The main point is simple. Candlestick Patterns can help with a trading decision, but they do not need to become the entire trading decision.
Why Candlestick Patterns Can Fail?
Candlestick patterns do not always work in the way traders expect. A pattern can form correctly and price can still move in the opposite direction.
This could happen for several reasons:
- The pattern appears without a clear trend.
- It forms away from an important price area.
- There is no follow-through after the pattern.
- A strong market move changes the direction quickly.
- News creates a sudden move in price.
- It happens on a short timeframe where there is more market noise.
- Price stays range-bound and does not commit to a clear move.
A Hammer might form after price has fallen, but the next candle could still go lower. A Bearish Engulfing might form after a move up, but buyers could still take over.
So a pattern alone is never a guarantee. It tells the story of that period, but not the future.
Conclusion
At the end, candlestick patterns make price easier to follow. Open, close, and range are all in one place. Patterns are just another way to read that.
A Hammer shows buyers stepped in at lows. A Doji shows hesitation. Both are just clues. They make more sense when you check the wider chart instead of trusting the pattern by itself.
FAQs
Because a simple line can tell you where price closed. A candlestick gives you a little more to work with because you can also see where price started and how high or low it went.
A candlestick pattern cheat sheet is a quick reference that shows the shape and name of different patterns. It could be useful when learning, but knowing the names of candlestick patterns would not be enough to understand what they mean on a chart.
The limitation is quite simple. A pattern can look bullish, but price can fall. It can look bearish, but price can rise. This is why the rest of the candlestick pattern chart still needs to be considered.
There's no single pattern that can guarantee reliability. But a few that are considered reliable are bullish and bearish engulfing, morning and evening star, hammer, and shooting star.
No. A Hammer could show that lower prices were rejected, but price could still continue falling. When we look at a Hammer, the trend, price level, and next move should also be considered.
Yes, they can, but on a 5-minute timeframe there's a lot of noise, and therefore candlestick patterns may form and wipe out quickly. The win rate of these patterns drops below one hour.
No, candlestick patterns show what happens in a period of price opening, closing, and moving across, but they don't provide exact profit targets.

Handa nang maglapat ng disiplinadong panganib sa crypto? Galugarin ang mga bagong instrumento ng crypto ng Audacity Capital at dalhin ang iyong diskarte sa pangangalakal.
Matuto PaNewsletter
Sumali sa aming newsletter.
Sumali sa Aming Social Community

Simulan ang Iyong Paglalakbay Ngayon Gamit ang Aming Libreng Pagsubok
Ipagmalaki ang iyong mga kasanayan at tagumpay sa pamamagitan ng mga sertipiko at makakuha ng pagkilala para sa iyong pagsusumikap at dedikasyon mula sa mga potensyal na mamumuhunan at kasamahan.
Libreng PagsubokMga Kaugnay na Artikulo

Is Crypto Less Risky?


What Economic Indicators Impact Forex Trading?
Learn which economic indicators impact forex trading, including inflation, GDP, interest rates, and employment data. Trade smarter.

Developing A Practical Trading Plan
Learn how to develop a practical trading plan that improves discipline, risk management, and consistency. Step-by-step guide for serious traders.

Weekly Economic Calendar: How Smart Traders Turn Volatility Into Opportunity
Learn how to use the weekly economic calendar to trade market volatility. Discover strategies to manage risk and capitalize on high-impact news events.