


What Is Market Structure in Forex Trading?


If your charts feel random, or your stops keep getting hit right before price runs your way, you are usually missing one thing.
You are missing structure.
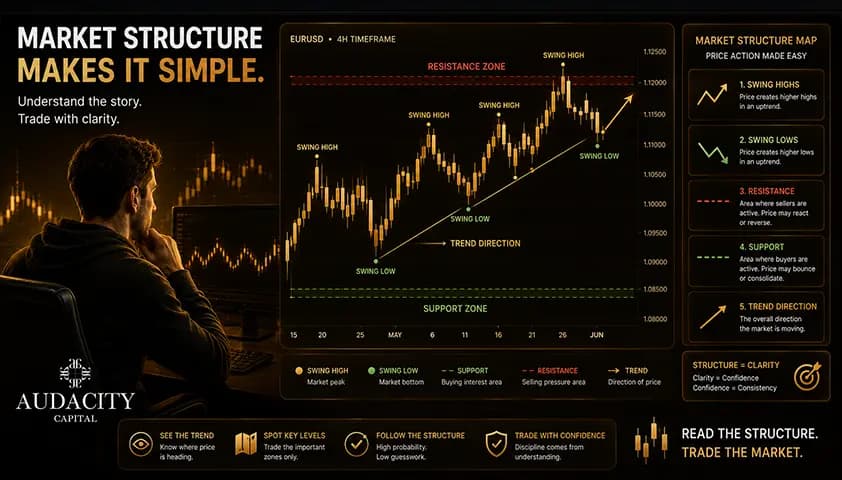
Market structure in forex is the framework that turns a messy chart into a readable map of where price has been and where it is likely to go next.
In one line: market structure is the pattern of swing highs and swing lows that shows whether a market is trending up, trending down, or moving sideways.
By the end of this guide you will be able to identify the trend, spot continuations and reversals, and trade with the structure instead of against it.
What is market structure in forex trading?
Let us answer the core question directly. What is market structure in forex trading?
It is the framework, or map, of how price moves over time. More precisely, it is the sequence of swing highs and swing lows that reveals whether the market is trending up, trending down, or ranging.
The key point to internalize early is this: price is not random. It moves in readable patterns, driven by the ongoing tug of war between buyers and sellers.
Market structure is the foundation of technical analysis, and you will often hear it used interchangeably with the term price action. When traders say they read price action, reading structure is a large part of what they mean.
One quick note on the term itself. "Market structure" can also refer to how the forex market is organized as a whole, meaning the interbank market, banks and liquidity providers, intermediaries, and retail traders trading over the counter.
That is a separate topic. This guide covers the price-action meaning, the one traders actually use to read charts and make decisions.
The Building Blocks: Swing Highs and Swing Lows
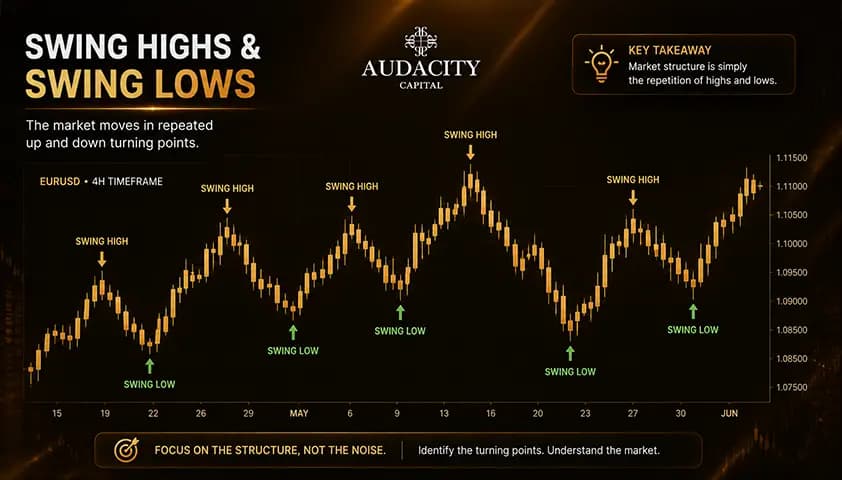
Everything in the forex market structure explained rests on two simple building blocks. Get these right and the rest follows naturally.
1. A swing high is a peak on the chart, a point where price pushes up, stalls, and then reverses downward.
2. A swing low is a valley, a point where price falls, bottoms out, and then reverses upward. That is it. Every trend and every range is just a chain of these turning points.
Once you can spot swing highs and swing lows, you can label the relationship between them. There are four terms to learn, and each one tells you something about who is in control:
- Higher High (HH): a swing high that is higher than the previous swing high. Buyers are pushing further up.
- Higher Low (HL): a swing low that is higher than the previous swing low. Buyers are defending at a higher level.
- Lower High (LH): a swing high that is lower than the previous swing high. Sellers are capping the rally earlier.
- Lower Low (LL): a swing low that is lower than the previous swing low. Sellers are driving price further down.
Reading market structure is really just reading the relationship between consecutive swing points. If you see higher highs and higher lows stacking up, the market is climbing. If you see lower highs and lower lows, it is falling.
That sequence is what tells you the trend, and it is the single most useful thing a beginner can learn to see.
The Three Types of Market Structure
At any moment, a chart is doing one of three things. Once you can name which one you are looking at, your decisions stop feeling like guesswork. Here are the three structure types and what each means for your trading.
1. Uptrend (bullish structure)
A bullish market structure is a series of higher highs and higher lows, an ascending staircase climbing left to right. Each new peak clears the last, and each pullback stops above the previous low. That pattern shows demand consistently outpacing supply.
In an uptrend, traders look for pullbacks that respect the last higher low. If price retraces and holds above that higher low, the trend is likely still intact and buyers remain in control.
If it does not hold, that is your first sign something may be changing, which we cover below.
2. Downtrend (bearish structure)
A bearish market structure is the mirror image, a series of lower highs and lower lows, a descending staircase stepping down. Each rally fails earlier than the last, and each drop pushes further. That shows supply outpacing demand.
In a downtrend, traders look for rallies that fail at a lower high, the level where sellers are likely to regain control, and then trade in the direction of the decline.
You are not trying to catch the bottom. You are trying to join a move that is already in motion.
3. Range (consolidation or sideways)
A ranging or consolidating market moves sideways between a support floor and a resistance ceiling. There is no clean sequence of higher highs and lows or lower highs and lows. Buyers and sellers are roughly in balance, and price bounces between the two boundaries.
Ranges matter for two reasons.
First, they often precede a strong breakout, so a quiet range can be the calm before a big move.
Second, trading a range means respecting its boundaries, or waiting for a confirmed break, rather than assuming a trend that is not there yet.
A range can break either way, so patience beats prediction here.
Break of Structure (BOS) and Change of Character (ChoCh)
Knowing the trend is step one. The next question is always the same: is this trend continuing, or is it about to turn?
Two concepts answer that. Learning to tell them apart is what separates guessing from market structure trading.
Break of Structure (BOS): trend continuation
A break of structure (BOS) happens when price breaks a prior swing point in the direction of the existing trend. In an uptrend, that means price pushes through a prior swing high. In a downtrend, it means price breaks below a prior swing low.
A BOS confirms the trend is still alive. It signals that momentum, and the significant orders behind it, is still pushing price in the same direction. Traders use a BOS as confirmation to keep trading with the trend rather than fighting it.
Change of Character (ChoCh): the first sign of a reversal
A change of character (ChoCh) is the opposite signal. It happens when price breaks structure against the prevailing trend.
For example, in an uptrend, price breaks below the most recent higher low. That is the first warning that momentum may be shifting and a reversal could be starting.
Here is the important part: a ChoCh is an early warning, not a confirmation. One break against the trend does not mean the trend is dead.
A reversal becomes more reliable once price also builds opposite structure, for example new lower highs and lower lows after a previous uptrend.
So keep the contrast clean in your head. BOS equals continuation in the trend's direction. ChoCh equals a possible reversal against it.
Treating an early ChoCh as a done deal is one of the fastest ways to get caught on the wrong side.
Support, Resistance, and Liquidity
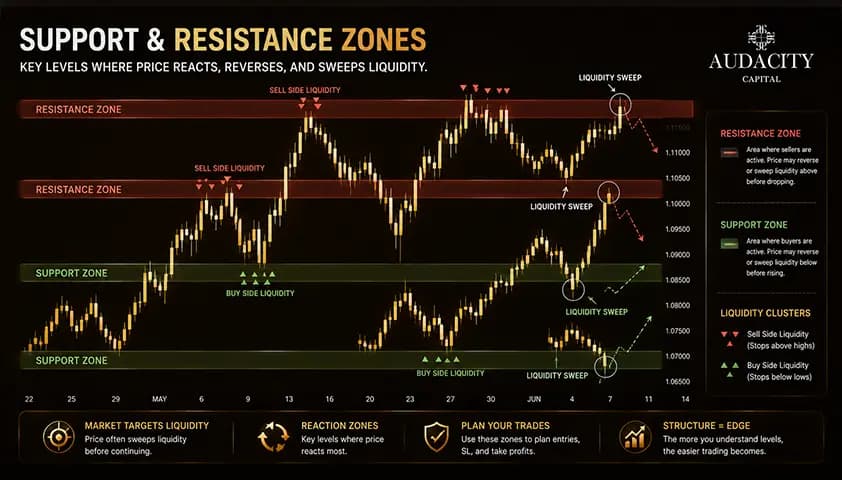
Structure tells you the direction. Levels tell you where the action tends to happen. This is where beginners first meet the tools that make entries and exits less arbitrary.
Support and resistance are the starting point.
Support is a floor, a zone where buyers have previously stepped in and absorbed selling pressure. Resistance is a ceiling, a zone where sellers have previously capped buying.
Frame both honestly: they are potential areas of interest, not fixed must-hold lines. Price can and does break through them. Treat them as zones, not exact prices.
Supply and demand zones take the same idea a step further. These are areas of prior aggressive activity.
A demand zone sits below price after a sharp rally, marking where buyers were eager. A supply zone sits above price after a steep drop, marking where sellers were aggressive.
When price returns to these areas, it often pauses or reverses, though again, never always.
Then there is liquidity, which sounds complex but is simple once explained.
Liquidity means clusters of orders, often stop losses, that build up just above swing highs and just below swing lows. Because so many traders place stops in those obvious spots, price sometimes sweeps through a level to trigger those orders, a move often called a stop hunt, before turning and moving the other way.
This is why obvious levels get pierced right before a reversal, and why placing your stop at the most crowded, predictable price is often a mistake.
How to Read Market Structure
Now let us bring it all together into a workflow you can apply on your next chart. Understanding how to read market structure comes down to a repeatable process, not a magic setting.
Reading the chart:
- Mark the swing highs and swing lows on your chart. Start with the obvious ones.
- Determine the trend by reading the sequence: higher highs and lows for an uptrend, lower highs and lows for a downtrend, or a range if neither is present.
- Watch for a break of structure, which signals continuation, or a change of character, which signals a possible reversal.
- Use multiple timeframes, top down. Let the higher timeframe, for example the daily or 4-hour, set the dominant direction, while a lower timeframe fills in the detail and your entry. The two should agree, not be read in isolation.
Trading with the structure:
The core principle is to trade with the structure, not against it.
In an uptrend, look for longs on a pullback into a higher low, a demand zone, or a discount area, then wait for a lower-timeframe trigger in your direction.
In a downtrend, look for shorts at a lower high, a supply zone, or a premium area, again waiting for a lower-timeframe trigger before you commit.
This is exactly where structure meets risk management. Place your stop beyond structure, below the higher low for a long, or above the lower high for a short, so a normal wick does not knock you out but a genuine failure does.
Target the next structural level or liquidity pool. Structure gives you logical, non-arbitrary places for your entry, stop, and target, which is the whole point of learning it.
If you want to go deeper on positioning your stops and targets, our guide on the risk-to-reward ratio pairs directly with this.
One macro-versus-micro caution before you start. The same pair can trend up on the daily and down on the 5-minute at the same time.
Neither reading is wrong. They describe different scales.
So match the timeframe you read to your trading style, and do not let a 5-minute wobble talk you out of a daily trend, or vice versa.
Common Mistakes to Avoid with Market Structure
Structure is a powerful framework, but it backfires when misused.
Here are the most common pitfalls, each with a one-line fix.
Mistake #1: Trading against the higher-timeframe trend.
Fix: let the higher timeframe set your bias and trade in its direction. Fighting the dominant trend is a classic error, and one we cover in our piece on common mistakes in funded trading accounts.
Mistake #2: Forcing structure onto the chart.
Fix: label what is actually there, not the setup you wish were there.
Mistake #3: Ignoring the higher timeframe entirely.
Fix: always check the bigger picture before you zoom in.
Mistake #4: Over-relying on the lowest timeframe.
Fix: remember the 1-minute and 5-minute are mostly noise, so use them for entries, not direction.
Mistake #5: Treating levels as exact lines.
Fix: treat support, resistance, and supply and demand as zones, so normal wicks do not stop you out unnecessarily.
Mistake#6: Entering before confirmation.
Fix: wait for a BOS or ChoCh instead of anticipating one that has not happened.
Structure improves your decisions, but only if you respect the higher timeframe, wait for confirmation, and treat levels as zones rather than certainties.
The mental side of that discipline matters just as much as the chart reading, which is why trading psychology is its own skill worth building.
Conclusion
Market structure in forex is the map of how price moves, built from swing highs and swing lows, that shows whether a market is trending up, trending down, or ranging.
Reading it, through break of structure and change of character, support and resistance, and liquidity, lets you trade with the trend and place stops and targets at logical levels instead of arbitrary ones.
Keep the honest frame front and center. Structure is a probabilistic map, not a crystal ball. It shows the likely path, not a guaranteed one.
So respect the higher timeframe, wait for confirmation, treat levels as zones, and always manage your risk. Setups fail, and that is normal.
The best next step is simple: open a chart and start marking swings. Naming higher highs, lower lows, and the breaks between them is a skill that sharpens fast with practice.
Frequently Asked Questions
They are closely related and often used interchangeably. Market structure is the framework of swing highs and swing lows that price action forms on the chart. Reading structure is a core part of price-action trading, so think of structure as the skeleton and price action as the full movement around it.
There is no single best timeframe. Higher timeframes like the daily and 4-hour show the dominant structure, while lower timeframes show the finer detail. Most traders combine them, using the higher timeframe for direction and a lower one for entries.
A break of structure confirms the trend is continuing by breaking a swing point in the trend's direction. A change of character is the first warning of a possible reversal, when price breaks structure against the prevailing trend. One says keep going, the other says pay attention.
No. It is a probabilistic map, not a crystal ball. It shows the likely path and gives you logical levels to work with, but structure can and does fail, which is exactly why traders still use stop losses and disciplined risk management.
A single break against the trend, a change of character, is an early warning, not a confirmation. A reversal becomes more reliable once price also forms opposite structure, such as new lower highs and lower lows after an uptrend. Waiting for that second layer of evidence reduces false signals.
Liquidity refers to clusters of orders, often stop losses, that build up just above swing highs and below swing lows. Because these spots are so predictable, price sometimes sweeps through them to trigger those stops before moving in the other direction. That is why obvious levels are sometimes pierced right before a turn.
No. Market structure is a pure price-action approach that needs only the chart and your ability to read swings. Some traders add tools like moving averages or volume as extra confirmation, but they are optional, not required.
Because each timeframe captures a different scale of movement. An uptrend on the daily can contain a short-term downtrend on the 5-minute, and both readings are valid. Always match the timeframe you read to your trading style so the two do not contradict each other in practice.

Handa nang maglapat ng disiplinadong panganib sa crypto? Galugarin ang mga bagong instrumento ng crypto ng Audacity Capital at dalhin ang iyong diskarte sa pangangalakal.
Matuto PaNewsletter
Sumali sa aming newsletter.
Sumali sa Aming Social Community

Simulan ang Iyong Paglalakbay Ngayon Gamit ang Aming Libreng Pagsubok
Ipagmalaki ang iyong mga kasanayan at tagumpay sa pamamagitan ng mga sertipiko at makakuha ng pagkilala para sa iyong pagsusumikap at dedikasyon mula sa mga potensyal na mamumuhunan at kasamahan.
Libreng PagsubokMga Kaugnay na Artikulo
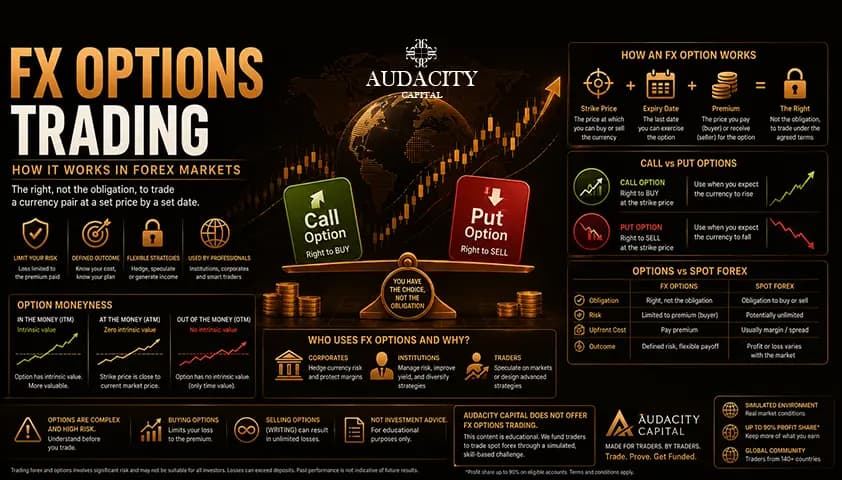
FX Options Trading: How It Works in Forex Markets?
FX options give you the right, not the obligation, to trade a currency pair at a set price by a set date. Learn how they work, who trades them, and the risks.


10 Best Forex Demo Accounts for 2026 : Compared & Reviewed
Find the best forex demo account for 2026. Compare platforms, virtual funds, demo duration, tools, and tips to practice trading safely.

Best Pairs to Trade in Forex: A Beginner's Guide to Choosing the Right Currency Pairs.
Discover the best pairs to trade in forex, including major, minor, and exotic currency pairs. Learn how to choose the right forex pairs based on your trading style and experience.
Best Forex Trading Sessions and Times for Funded Traders
Plan your Forex trading around the best time to trade forex globally. Get market data analysis for the time of the day with highest or most volatile trades