



ICT Optimal Trade Entry (OTE): Explained


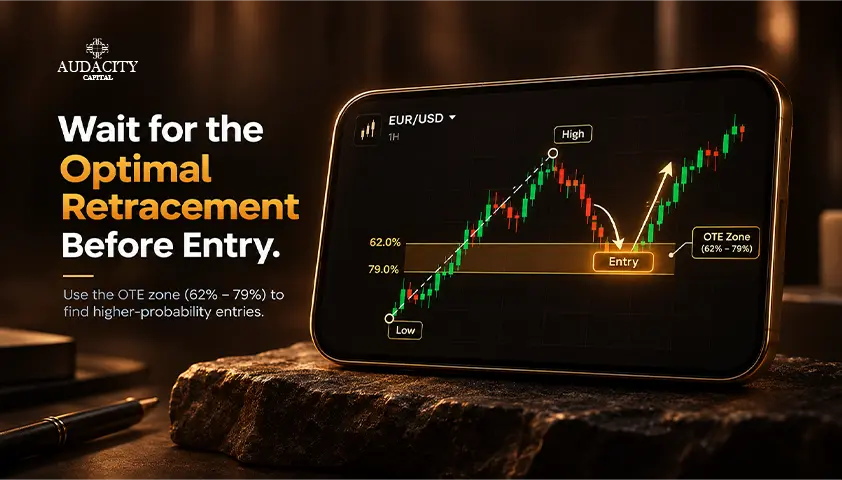
Price breaks out and moves strongly in one direction. Getting into the trade at this point would be chasing an extended move with a wide stop and minimal target space.
Waiting for a pullback seems like a good option, but a pullback to what level?
Optimal Trade Entry, also known as OTE, is an ICT concept which solves this question. It employs a deep Fibonacci retracement zone, measured typically between 62%-79% with 70.5% falling in the zone.
This article covers how to select the swing, draw bullish and bearish zones, add context and define invalidation.
What Is Optimal Trade Entry (OTE)?
Optimal Trade Entry is a retracement strategy. It involves locating a deeper pullback zone in the direction of the price move.
In ICT Optimal Trade Entry, the zone typically comprises three levels:
- 62% retracement of the leg
- 70.5% retracement, within the zone
- 79% retracement of the leg
Typical Fibonacci tools will show the closest conventional levels as 61.8% and 78.6%. ICT-based material uses 62% and 79%. The practical difference is negligible.
The reason behind this is simple: A deeper retracement gives the trader an opportunity to get into the trade nearer to the source of the move. It can reduce the distance between the entry point and structural invalidation and may create additional space toward the initial swing target.
This tradeoff is no less important. Price may reverse before getting to the area or go beyond it and invalidate the entire setup.
OTE informs the trader where to watch out for, but does not indicate when to make the trade.
What Are the ICT OTE Fibonacci Levels?
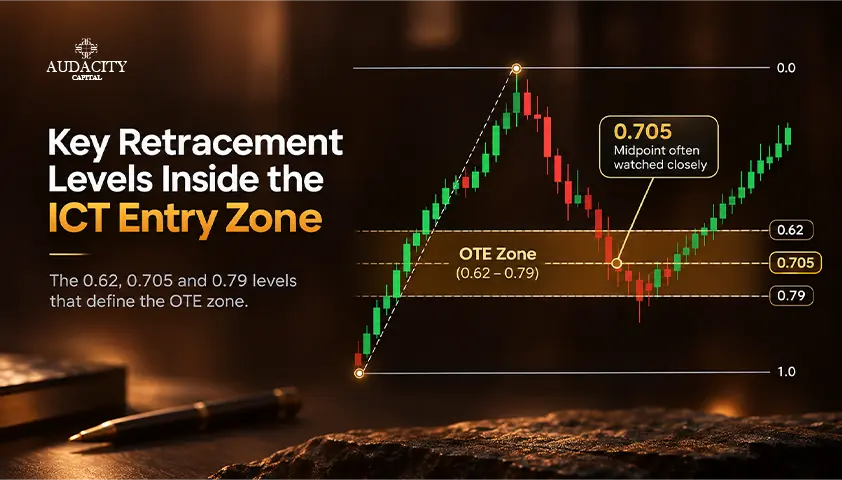
Confusion about ICT OTE mostly arises from five seemingly identical numbers. Here is how they differ.
Level | Role in OTE |
50% | Equilibrium, or midpoint of the measured price leg |
61.8% / ~62% | Shallower boundary of the OTE zone |
70.5% | Common ICT reference point inside the zone |
78.6% / ~79% | Deeper boundary of the OTE zone |
100% | Origin of the measured price leg |
Two of the listed levels represent typical Fibonacci retracement ratios: 61.8% and 78.6%. ICT practitioners tend to round them to 62% and 79%.
The 70.5% level is distinct from other levels in that it represents a non-standard Fibonacci ratio and is positioned approximately in the middle of the OTE zone. It is usually described in educational material as either the midpoint between the 62% and 79% zones or as an additional ICT reference level.
The 70.5% level is often referred to as the "sweet spot". This is the terminology used in the ICT methodology. This is not a statistical fact about the price reversal probability and it should not be read as the mathematically best retracement point.
How to Draw an Optimal Trade Entry Zone Correctly
OTE is not about drawing the Fibonacci levels; it is about the decision about which price leg needs to be measured.
Usually, a better candidate leg has some meaningful context:
- Significant directional displacement, which means fast and strong movement and not just floating around
- Starts with a recognizable swing low or high
- Breaks some significant market structure
- Agrees with the trader’s current directional bias
Creating the zone on every small fluctuation would result in a chart filled with levels but without any structure. The important leg should come prior to the retracement level.
Bullish OTE
- Find a meaningful bullish price leg.
- Mark the swing low and swing high within the leg.
- Calculate how much price retraced within this leg.
- Find the 62% to 79% retracement level below the swing high.
- Make sure that the level is located below 50% of the measured range.
Bearish OTE
- Find a significant bearish price leg.
- Plot the swing high that initiates the move and the swing low that concludes the leg.
- Determine how far price has retraced in an upward direction.
- Find the 62% to 79% area above the swing low.
- Ensure that the area lies above the equilibrium and within the premium section of the measured range.
A Note on Platform Settings
There are variations among the Fibonacci tools. Some display the 0% and 100% anchors in opposite orientations. As such, a command such as “draw from high to low” may yield a mirrored outcome, depending on the platform.
Rather than getting hung up on the orientation, pay attention to the price action. You are assessing the distance that price has retraced through the directional leg. If the levels drawn correspond to the price action, the orientation of the tool is inconsequential.
Bullish vs Bearish Optimal Trade Entry
Once the mechanics have been established, bullish and bearish setups are mirror images of each other.
Bullish OTE | Bearish OTE | |
Directional move | Up | Down |
Measured leg | Swing low → swing high | Swing high → swing low |
OTE location | Deep pullback below equilibrium | Deep rally above equilibrium |
ICT range description | Discount | Premium |
Trader watches for | Potential long setup | Potential short setup |
Structural invalidation | Usually beyond relevant swing low | Usually beyond relevant swing high |
Typical objective | Prior high / buy-side liquidity | Prior low / sell-side liquidity |
It is necessary to note that the entry of the price into discount does not make the bullish idea valid and the price entry into premium does not make it bearish. The trend and the structure must be in place before the zone becomes relevant.
Optimal Trade Entry Example
Consider a hypothetical bullish example in which the price moves from swing low of 100 points to swing high of 200 points, giving us a leg of 100 points. The pullback will then produce approximate retracement prices:
Retracement | Price |
50% | 150 |
62% | 138 |
70.5% | 129.5 |
79% | 121 |
This OTE zone exists in the region of 121 to 138. This zone exists in discount since price has retraced more than half of the bullish leg.
Numbers alone do not form the setup. In this case, the original move displaced through a previous swing high, and the trader’s directional idea remains bullish. If price retraces into the zone, the trader waits for whatever confirmation their tested strategy requires before entering.
Structural invalidation takes place outside the origin of the leg, which is 100 points. This previous swing high of 200 points or some other liquidity objective forms the target zone.
Note what happens to the math here. An entry point of 129.5 exists around 29.5 points above the origin and 70.5 points below the previous high. This is exactly the geometry that OTE is designed to produce, but it describes distances, not outcomes.
Other possibilities could occur instead of a perfect rally:
- Price reverses before getting to 138 and the order never gets filled
- Price enters the zone and rallies
- Price trades through 121
- Price breaks below 100 and makes the whole setup void of bullish structure
This is an example of mechanics. It is not a simulated winner.
How OTE Fits With Market Structure, Liquidity, FVGs and Order Blocks
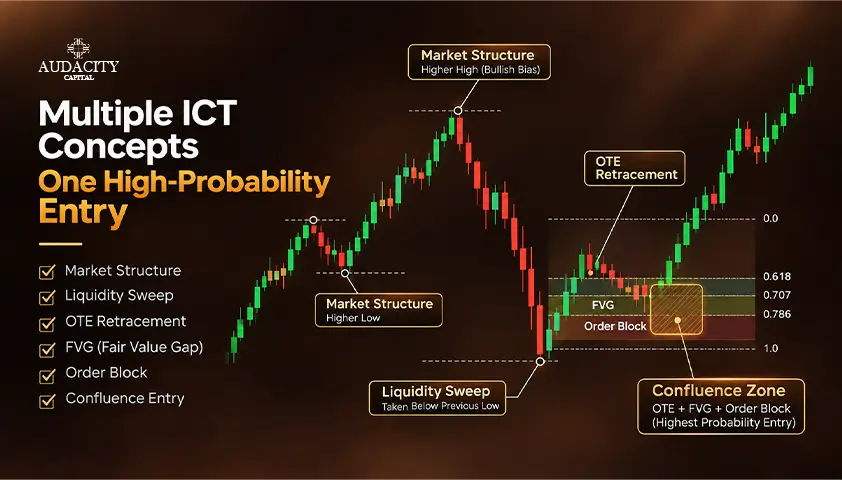
An OTE zone provides location. The context is provided by other signals. This is the reason why the OTE trading strategy is not very effective on its own.
Market Structure
The selected leg should relate to any significant directional price movement rather than some sort of consolidation. A break or shift in the market structure may provide the explanation for why that particular leg deserves to be measured.
Liquidity
A liquidity sweep, which is the situation when price moves through an obvious high or low before reversing direction, can provide additional context for the directional movement. Every stop cluster is not necessarily an institutional target, so treat this as supporting evidence rather than proof of intent.
Fair Value Gap
If there is a fair value gap that intersects with the OTE zone, then traders will have a chance to keep an eye on this intersection point as well. Thus, there is a confluence between two discretionary price action concepts. It does not guarantee a reaction.
Order Block
Another possibility is an order block overlapping or residing in proximity to the OTE zone, giving traders another point to keep an eye on.
Adding all these elements together doesn’t create any magic winning setup. Several independently defined setups might be helpful in creating a selective setup for a trader, but the testing and risk control are still necessary.
How Traders Plan Entries, Stops and Targets Around OTE
The OTE zone becomes applicable only when it fits in a certain plan.
Entry
Traders enter trades using the zone in various ways. Some use a limit order inside the zone. Others use the 70.5 level as a point of reference.
Some traders like to use the shallower or deeper part of the band while others wait for confirmation after the zone is reached. Each method is not necessarily better than the other.
It is important to understand the dynamics at work. Shallower entries are likely to get filled but will have more room before they invalidate. Deeper entries will help with improving reward-to-risk but might not be reached at all.
Stop Loss and Invalidation
The placement of the stop should depend on where the original trade idea becomes structurally invalid. Using a set amount of pips after the 79% level is arbitrary.
The relevant swing origin can serve as a more significant invalidation reference, because a break there means the leg you measured no longer holds.
Targets
There are several potential targets, such as previous swing highs/lows, the opposite liquidity point, or any other structural point. Target must be chosen before placing the trade, not after the trade is already running.
Limitations of Optimal Trade Entry
To take OTE as a predictive tool exaggerates its capability. Remember the following limitations:
- Price may never retrace deeply enough to enter the zone.
- A deep pullback may continue and become a full reversal.
- There is discretionary element in selecting swings, hence two traders might select different valid swing legs on the same chart.
- OTE does not provide prediction of continuation of the trend.
- 70.5% level has not been proven superior to all others for reversal entry.
- More ICT knowledge will not reduce the uncertainty.
- Costs of trading can make a difference even in a clean looking chart.
Educational information concerning the topic at hand suggests that the zone can be missed or overlooked entirely, and the levels are conventions, instead of laws of price.
OTE is valuable not as evidence that price will reverse, but as a disciplined method of defining where a trader is prepared to look for entry.
OTE Is a Location, Not a Complete Trading Strategy
Optimal Trade Entry’s benefit is not its ability to forecast a reversal at 62%, 70.5% or 79%. The real benefit is that it compels a trader to define the price leg, wait for a deeper retracement, figure out where the entry point can be placed, and relate this to a pre-defined invalidation and target level.
A clean OTE zone without any direction attached is nothing more than a Fibonacci retracement.
Test your defined OTE rules clearly on historical charts and avoid shifting the swing anchors to make the past setups fit the idea.
Note - This article is written for educational purposes only and is not a substitute for professional investment and financial advice. Trading carries risk, and the examples provided are purely theoretical.
Frequently Asked Questions
Traders and sources based on the ICT have different views about swing anchors, but what is important is to choose one swing selection approach from the beginning and be consistent when testing and using it. Do not change between wick and body swing anchors depending on how each performs historically.
Yes, OTE zones based on Fibonacci can be used on all timeframes, but the quality of setups depends on the price leg and general methodology.
Timeframes affect zone size, stop placement and how many setups will appear. There is no timeframe that works better than others.
Yes, a trader may use the 62% to 79% retracement zone with other price-action or Fibonacci-based strategy. Apart from the overall ICT framework of structure, liquidity and dealing ranges, OTE should be treated as a deep retracement entry zone rather than confirmation of institutional participation.

هل أنت مستعد لتطبيق مخاطر منضبطة على العملات المشفرة؟ استكشف أدوات التشفير الجديدة من Audacity Capital واجلب استراتيجية التداول الخاصة بك.
اعرف المزيدالنشرة الإخبارية
انضم إلى نشرتنا الإخبارية.
انضم إلى مجتمعنا الاجتماعي

ابدأ رحلتك اليوم مع تجربتنا المجانية
اعرض مهاراتك وإنجازاتك بفخر من خلال الشهادات واحصل على تقدير لعملك الجاد وتفانيك من المستثمرين المحتملين والأقران.
تجربة مجانيةمقالات ذات صلة

Overfitting in Trading: Signs, Causes & How to Avoid It
Learn what overfitting in trading means, why strategies become overfit, the warning signs to watch for, and how to build more robust trading systems.


Bid and Ask Price Explained: What Every Trader Needs to Know
Learn what bid and ask prices mean, how spreads affect trading costs, why spreads widen, and how to manage them when trading forex and other markets.

NQ in Trading – What is NQ in Trading?
Learn what NQ means in trading, how E-mini Nasdaq-100 futures work, their contract specifications, trading hours, strategies and risks.

Stochastic Oscillator vs RSI: How They Differ and How to Use Them
Compare RSI and the Stochastic Oscillator, understand their signals, and choose the right indicator for your trading strategy.