
Bearish Engulfing Candlestick Pattern: The Complete Trader's Guide (2026)

Bearish Engulfing Pattern (Quick Answer)
- Type: Reversal pattern
- Candles: 2
- Signal: Bearish
- Best timeframes: H4, Daily
- Confirmation: Volume, RSI, resistance
How to identify it, confirm it, trade it, and avoid getting trapped by false signals.
Most traders lose money not because they can't read charts, but because they act on patterns without context. The bearish engulfing candlestick is one of the most recognised reversal signals in technical analysis, and yet it's also one of the most misused.
This guide will walk you through everything, from the raw anatomy of the pattern to live trade setups, risk management rules, and the mistakes that take money out of unprepared traders' accounts. By the end, you will know exactly when a bearish engulfing pattern is worth trading and when to walk away from it.
What Is the Bearish Engulfing Pattern?
The bearish engulfing pattern is a two-candlestick reversal formation that appears after a price advance. The first candle is bullish, confirming the existing uptrend. The second candle is bearish and its body completely swallows the body of the first candle, showing that sellers overpowered buyers within a single session.
In plain language: buyers pushed prices up, then sellers stepped in so aggressively that they erased the entire previous gain and closed lower.
This single shift in one or two sessions can mark the beginning of a trend reversal, or at minimum, a significant pullback.
Quick Stat
Key Fact: Research by Liberated Stock Trader found the bearish engulfing pattern carries a 57% win rate on the daily timeframe when properly applied. That edges it firmly into statistically useful territory, but only when traded with the right context and confirmation.
Anatomy of the Bearish Engulfing Candlestick

Understanding what each candle is doing is essential before you can use this pattern confidently.
Candle 1: The Bullish Candle
- Green or white body, showing buyers were in control
- Appears during an established uptrend
- Can be any size, though a smaller body makes the pattern more significant
- Closes near its session high, reflecting bullish momentum
Candle 2: The Bearish Engulfing Candle
- Red or black body
- Opens above or at the close of the previous candle (often a gap up)
Its body fully engulfs the body of the first candle, meaning its open is higher than the prior close and its close is lower than the prior open
- Ideally closes near the session low, showing strong seller control
- Shadows (wicks) are secondary; it is the bodies that define the pattern
Pattern Rule
Important distinction: Only the real bodies need to overlap. The second candle does not have to engulf the wicks of the first candle for the pattern to be valid. If the second candle also engulfs the full high-to-low range including wicks, that is a stronger signal.
The Psychology Behind the Pattern
Candlesticks are visual representations of human emotion. The bearish engulfing pattern tells a very specific story in just two sessions.
Day 1: The market closes higher. Buyers are confident. The crowd is bullish and momentum appears to be continuing.
Day 2 open: Price gaps up. Bulls are even more excited. New buyers pile in, expecting the uptrend to continue.
Day 2 intraday: Sellers emerge, absorbing every buy order. The bid is weakening.
Day 2 close: The session closes below the prior day's open. Buyers are now sitting on losses. Confidence evaporates.
This sequence reveals something critical: the market tried to go higher, failed, and reversed. That failure at higher prices is what gives the pattern its predictive value. It is not just a pattern, it is a visible transfer of control from buyers to sellers.
How to Identify a Bearish Engulfing Pattern: Step-by-Step
Use this checklist every time you think you see the pattern forming.
Step | What to Check | Why It Matters |
1 | Confirm a prior uptrend is in place | Without a preceding rally, there is nothing to reverse |
2 | Candle 1 is bullish (green/white body) | Confirms buyers controlled the prior session |
3 | Candle 2 opens at or above Candle 1 close | Shows bullish sentiment carried into the new session |
4 | Candle 2 body fully engulfs Candle 1 body | The core requirement; sellers have overwhelmed buyers |
5 | Candle 2 closes near session low | Confirms sellers maintained control through the session |
6 | Check location: near resistance or prior high? | Context dramatically improves signal reliability |
7 | Look for volume spike on Candle 2 | High volume confirms conviction behind the selloff |
Signal Strength: What Makes a Bearish Engulfing Pattern More Reliable?
Not all bearish engulfing patterns are equal. The following factors increase the probability that the signal will lead to a meaningful price decline.
- Size of the engulfing candle: A larger red candle relative to the prior green candle shows stronger conviction. The wider the engulfment, the more decisive the seller takeover.
- Location at resistance: Patterns forming at well-established resistance zones, prior highs, or key Fibonacci levels carry significantly more weight than those appearing mid-range.
- Volume confirmation: A surge in volume on the bearish candle shows institutional participation. Patterns on thin volume are far more likely to fail.
- Close near the low: A candle that closes at or near its session low shows sellers were dominant to the very end. A long lower wick would reduce the signal strength.
- Length of the preceding uptrend: The longer and more extended the rally before the pattern, the more sellers are likely sitting on profits waiting to exit. This builds supply pressure that supports the reversal.
- Confirmation from other indicators: RSI in overbought territory (above 70), price at the upper Bollinger Band, or bearish divergence on MACD all strengthen the case for a reversal.
Bearish Engulfing vs Similar Candlestick Patterns
Traders often confuse the bearish engulfing with related patterns. Understanding the distinctions helps you read price action more accurately.
Bearish Engulfing | Similar Pattern |
Two candles; the second body fully covers the first body | Dark Cloud Cover: Similar two-candle bearish pattern, but the second candle only closes past the midpoint of the first, not a full engulf. Weaker signal. |
Requires a prior uptrend for context | Shooting Star: Single-candle rejection pattern. Long upper wick, small body. Shows rejection but less conviction than a full engulfing candle. |
Second candle closes below the first candle's open | Evening Star: Three-candle pattern. Includes a doji in the middle, signalling indecision before reversal. Generally more reliable but rarer. |
Volume spike on second candle strengthens the signal | Hanging Man: Single bearish reversal candle at a top, with a long lower wick. Requires more confirmation, less decisive than bearish engulfing. |
How to Trade the Bearish Engulfing Pattern: Three Practical Strategies
There is more than one way to enter a trade using this pattern. The right approach depends on your risk tolerance and trading style.
Strategy 1: Resistance Zone Entry
Best for: Swing traders and forex traders on H4 or daily charts
- Wait for price to rally into a known resistance zone (horizontal level, prior high, or supply zone)
- Look for the bearish engulfing formation to complete at that level
- Enter short at the open of the candle following the engulfing pattern, or at the close of the engulfing candle itself
- Place stop loss above the high of the engulfing candle (plus a small buffer)
- Take profit at the next significant support level below
Strategy 2: Moving Average Rejection
Best for: Trend-following traders who want high-probability setups
- In a broader downtrend, price often bounces back up to a key moving average (20 EMA, 50 EMA) before continuing lower
- A bearish engulfing pattern forming right at that moving average is a high-probability short entry signal
- This setup aligns the short-term pattern with the longer-term trend direction, stacking probabilities in your favour
- Stop above the moving average, target the prior swing low
Strategy 3: RSI Overbought + Bollinger Band Upper Boundary
Best for: Traders who prefer indicator confirmation before entering
- Set up RSI (14) and Bollinger Bands (20 period, 2 standard deviations) on your chart
- Wait for price to reach the upper Bollinger Band AND RSI to be above 70 (overbought)
- If a bearish engulfing pattern forms in that zone, the confluence of three signals makes for a compelling short entry
- Target: 20-period SMA (middle Bollinger Band) or lower band
- Stop: just above the high of the engulfing candle
Entry, Stop Loss, and Take Profit Rules
Risk management is what separates consistent traders from gamblers. Here is how to structure a trade around the bearish engulfing pattern.
Trade Parameter | Recommended Approach |
Entry (Aggressive) | Close of the bearish engulfing candle. Higher risk, but you capture more of the move. |
Entry (Conservative) | Open of the next candle after the pattern is fully confirmed. Reduces risk of entering a false signal. |
Stop Loss | Above the high of the engulfing candle, with a small buffer (3-5 pips or 0.1-0.2% above the high). |
Take Profit (Target 1) | Nearest significant support level below entry. |
Take Profit (Target 2) | Next support zone further down, aiming for a risk-reward ratio of at least 1:2. |
Risk Per Trade | Never exceed 1-2% of account capital on a single bearish engulfing setup. Pattern win rates do not eliminate drawdown risk. |
Which Timeframes Work Best?
The bearish engulfing pattern appears on every timeframe, from 1-minute charts to monthly charts. However, reliability varies significantly.
- Daily and Weekly charts: Highest reliability. These timeframes filter out noise and reflect genuine shifts in institutional sentiment. Ideal for swing trading and position trading.
- H4 (4-hour) charts: Strong reliability for intraday swing traders. Used heavily in forex, particularly on major pairs like EURUSD and GBPUSD.
- H1 (1-hour) charts: Moderate reliability. More patterns appear, but false signals increase. Require stronger confirmation.
- M15 and below: Low reliability. Patterns form too frequently and are heavily influenced by random price noise. Not recommended for trading this pattern in isolation.
For funded traders and prop firm challenges, daily and H4 charts typically offer the best balance of signal frequency and reliability without generating excessive noise.
Markets Where the Bearish Engulfing Pattern Works
One of the advantages of candlestick patterns is that they apply across all liquid markets.
- Forex: Highly effective on major pairs (EURUSD, GBPUSD, USDJPY) where liquidity is deep and patterns form cleanly. Major currency pairs exhibit institutional footprints that reinforce candlestick signals.
- Stocks: Effective on individual equities and indices. Patterns on daily charts of large-cap stocks or major indices (S&P 500, FTSE 100, NASDAQ) are particularly reliable.
- Cryptocurrencies: Works on Bitcoin, Ethereum, and high-cap altcoins, but require additional confirmation given the volatility and lower institutional participation in some altcoin markets.
- Commodities: Effective on gold (XAUUSD), oil (WTI/Brent), and silver. Gold in particular shows textbook bearish engulfing reversals at key levels due to its sensitivity to dollar strength and risk sentiment.
- Indices: Excellent for reading broad market direction. A bearish engulfing on a major index daily chart is a strong warning signal for the overall market environment.
Common Mistakes Traders Make with This Pattern
Knowing what to avoid is just as important as knowing what to look for.
Mistakes to Avoid
Mistake 1: Trading it without context. A bearish engulfing pattern in the middle of a ranging market is far less meaningful than one forming at a clear resistance level after an extended rally. Location is everything.
Mistake 2: Ignoring the broader trend. A bearish engulfing on a daily chart within a dominant long-term uptrend may only produce a short-term pullback, not a full reversal. Understand which degree of trend you are trading.
Mistake 3: Entering immediately at pattern close. Waiting one candle for confirmation reduces false signals significantly, especially in choppy market conditions.
Mistake 4: Using it on low-volume assets. Patterns on thinly traded instruments or during low-liquidity sessions (like Asian session extremes on minor pairs) are unreliable.
Mistake 5: Setting stops too tight. Placing a stop just one or two pips above the engulfing candle invites premature stop-outs. Always add a reasonable buffer above the high.
Mistake 6: Ignoring volume. A bearish engulfing candle on declining or average volume lacks conviction. High volume signals institutional selling. Low volume signals uncertainty.
When the Bearish Engulfing Pattern Fails
No candlestick pattern wins 100% of the time. Understanding failure conditions keeps you prepared.
- Strong macro tailwinds: If a bullish news event coincides with or follows the pattern (earnings beat, rate cut, risk-on sentiment shift), buyers can overwhelm the bearish signal entirely.
- Pattern in a strong uptrend: During a powerful bull run, bearish engulfing patterns frequently produce only shallow pullbacks before the trend continues. This is why trend alignment matters.
- Low-quality engulfment: A small engulfing candle that barely overlaps the prior body is a weak signal. The smaller the engulfment margin, the higher the failure probability.
- Choppy or ranging market: In sideways price action, reversal patterns are almost meaningless. Trend context is a prerequisite for pattern reliability.
- Key support directly below: If the pattern forms just above a major support zone, buyers may step back in aggressively, preventing a meaningful breakdown.
Risk Management Note
When the pattern fails, the price will often close back above the high of the engulfing candle. If this happens, treat it as a clear signal to exit and reassess. A failed bearish signal in an uptrend sometimes resolves into a continuation trade in the bullish direction.
Trading the Bearish Engulfing Pattern on a Funded Account
For traders in prop firm challenges or managing funded accounts, the bearish engulfing pattern fits well into a disciplined, rule-based approach because it is objective and has defined trade parameters.
- Daily drawdown awareness: Because the stop loss is placed above the high of the engulfing candle, you know your maximum risk per trade before entry. This makes position sizing straightforward and prevents unexpected drawdown breaches.
- News filter discipline: Avoid taking bearish engulfing setups directly into high-impact news events. Volatility around news can invalidate technical setups instantly.
- Selective trading: In a funded account context, not every bearish engulfing pattern warrants a trade. Only those with strong confluence (resistance + volume + indicator confirmation) should be taken.
- Journaling every setup: Log each trade with entry rationale, pattern quality score, and outcome. This builds the statistical picture of how the pattern performs in your specific markets and sessions.
Audacity Capital Note At Audacity Capital, we fund traders who trade with structure and discipline. The bearish engulfing pattern, when applied with proper risk management, is exactly the kind of high-probability, low-noise setup that funded traders use to protect capital while targeting consistent returns. |
Bearish Engulfing Pattern: Quick Reference Summary
Feature | Requirement | Notes |
Pattern type | Two-candle reversal | Appears after an uptrend |
Candle 1 | Bullish (green/white) | Part of the preceding uptrend |
Candle 2 | Bearish (red/black) | Body fully engulfs Candle 1 body |
Opening of Candle 2 | At or above Candle 1 close | Gap up is common |
Closing of Candle 2 | Below Candle 1 open | Close near low is strongest |
Volume | Higher on Candle 2 | Confirms seller conviction |
Best timeframe | Daily / H4 | Reduces noise, higher reliability |
Best location | At resistance or prior high | Confluence improves probability |
Stop loss | Above high of Candle 2 | Add buffer for whipsaw |
Confirmation | Candle 3 or indicator signal | Reduces false signal risk |
Win rate (daily TF) | ~57% | Source: Liberated Stock Trader research |
Final Thoughts: The Bearish Engulfing Pattern and the Disciplined Trader
The bearish engulfing candlestick pattern is one of the clearest expressions of market psychology available to a technical trader. In two candles, it shows buyers losing control and sellers stepping in decisively. When this happens at the right location, with volume support, and in the context of an extended move, the pattern becomes a high-confidence signal.
But it is never a shortcut. The traders who use this pattern profitably are not reacting to every red candle that slightly overlaps the prior green one. They are waiting for the pattern to form with quality at meaningful locations, using confirmation to filter noise, and sizing their positions so that no single trade threatens their account.
That combination of pattern recognition and disciplined execution is what separates traders who last from those who blow accounts chasing setups.
Trade with Audacity Capital - Ready to trade patterns like this on a funded account?
Audacity Capital funds traders who prove they can combine technical skill with disciplined risk management. If you have a structured approach and consistent execution, our Ability Challenge and Funded Trader Programme give you the capital to trade it at scale.
Learn more at audacity.capital
Key Takeaways
1. The pattern requires context. A bearish engulfing candle forming in the middle of a range is noise. The same pattern at a well-established resistance zone after an extended rally is a signal. Location determines relevance.
2. Two candles tell the whole story. Day one: buyers in control. Day two: sellers step in, absorb all buying pressure, and close lower than the prior candle's open. This visible transfer of control is the entire premise of the pattern.
3. Size and volume matter. A large engulfing candle on high volume is a strong signal. A small engulfing candle on thin volume is a weak signal. Always assess conviction, not just pattern shape.
4. Wait for confirmation where possible. The aggressive entry is at the close of the engulfing candle. The conservative entry is at the open of the next candle. Waiting one session for the market to confirm the direction reduces false signal risk.
5. The daily and H4 timeframes are most reliable. Lower timeframes produce more patterns but far more false ones. Build your strategy around the daily or four-hour chart for this pattern specifically.
6. Stop loss goes above the high. Place your stop above the high of the bearish engulfing candle, not below it. Add a small buffer to protect against stop-hunting wicks.
7. This is a reversal signal, not a trend tool. The bearish engulfing pattern signals a potential end to an uptrend. It is not a trend-continuation tool. Trading it in the direction of a strong uptrend reduces its effectiveness.
8. Confluence is the differentiator. The highest-probability setups combine the pattern with resistance zones, overbought RSI, upper Bollinger Band, or bearish indicator divergence. One signal is an alert. Three signals are a trade.
9. No pattern wins 100% of the time. The bearish engulfing pattern has a statistically useful win rate, but losses are part of any strategy. Risk management, not pattern perfection, is what determines long-term profitability.
FREQUENTLY ASKED QUESTIONS
A bearish engulfing pattern is a two-candle formation that signals a potential reversal from an uptrend to a downtrend. The first candle is bullish (green/white). The second candle is bearish (red/black) and its body completely covers the body of the first candle. It shows sellers have overwhelmed buyers and is most meaningful when it forms at a resistance level after a sustained price advance.
On the daily timeframe, research by Liberated Stock Trader puts the win rate at approximately 57%. This makes it statistically useful but not infallible. Reliability improves significantly when the pattern is combined with other signals such as overbought RSI, a key resistance zone, or high volume on the engulfing candle. Isolated patterns without confluence have lower win rates.
No. The standard definition requires only the real bodies to engulf, meaning the second candle's body open must be higher than the first candle's body close, and the second candle's body close must be lower than the first candle's body open. If the wicks are also engulfed, that is a stronger version of the signal but it is not required for the pattern to be valid.
Both are two-candle bearish reversal patterns, but there is a key difference in how far the second candle closes into the first. In a dark cloud cover, the second bearish candle only closes past the midpoint of the first bullish candle's body. In a bearish engulfing pattern, the second candle fully covers the entire body of the first. The bearish engulfing is therefore considered a stronger signal.
Yes, but with different levels of reliability. The daily and four-hour timeframes offer the most reliable signals because they filter out short-term noise and better reflect institutional activity. On lower timeframes (M15 and below), the pattern appears frequently but generates many false signals. Traders using lower timeframes should require stronger confirmation before acting.
Your stop loss should be placed above the high of the bearish engulfing candle. Add a small buffer of a few pips or a percentage point beyond the high to reduce the risk of being stopped out by a brief wick before the price reverses downward. Never place the stop below the pattern, as that would be on the wrong side of the trade.
Yes, and it is widely used in forex trading. Major pairs such as EURUSD, GBPUSD, and USDJPY produce clean bearish engulfing setups due to their deep liquidity and strong institutional participation. The pattern is especially effective on the daily and four-hour charts of these pairs when it forms at significant resistance levels or confluence zones.
A failed bearish engulfing occurs when the price does not decline after the pattern forms and instead closes back above the high of the engulfing candle. This is your signal to exit the trade and reassess. In a strong uptrend, a failed bearish engulfing can actually become a bullish continuation signal, so understanding the broader trend context is critical.
It can be used in day trading on H1 or H4 charts, but it is less suited to M15 or M5 charts where false signals are more frequent. Day traders using this pattern should always require confirmation from at least one additional technical signal (volume, indicator reading, or location at a key level) before entering a trade.
Yes, and it fits well in a rules-based funded trading approach. The pattern provides a clear stop loss level (above the engulfing candle high), which makes position sizing and risk calculation straightforward. For prop firm trading, only the highest-quality setups with strong confluence should be traded. Avoid taking the pattern at random with no confluence, as the lower win rate of weaker setups can erode account balance over time.

Bereit, diszipliniertes Risiko auf Krypto anzuwenden? Entdecken Sie die neuen Krypto-Instrumente von Audacity Capital und bringen Sie Ihre Trading-Strategie mit.
Mehr erfahrenNewsletter
Treten Sie unserem Newsletter bei, um auf dem Laufenden zu bleiben.
Treten Sie unserer sozialen Gemeinschaft bei
Beginnen Sie Ihre Reise heute Mit unserer kostenlosen Testversion
Präsentieren Sie stolz Ihre Fähigkeiten und Leistungen durch Zertifikate und erhalten Sie Anerkennung für Ihre harte Arbeit und Ihr Engagement von potenziellen Investoren und Kollegen.
Kostenlose TestversionVerwandte Artikel
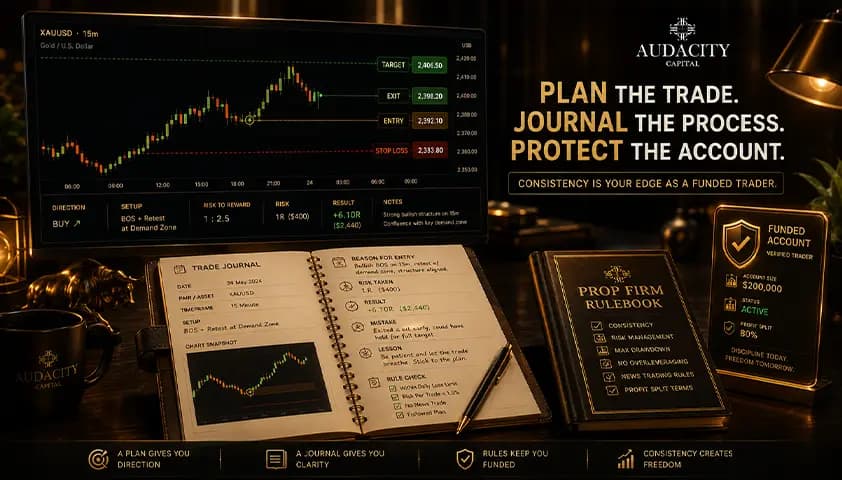
How to Keep a Trading Journal as a Funded Trader
Your trading journal as a funded trader is a survival tool, not a diary. Track your distance to the limits and catch the habits that quietly blow accounts.
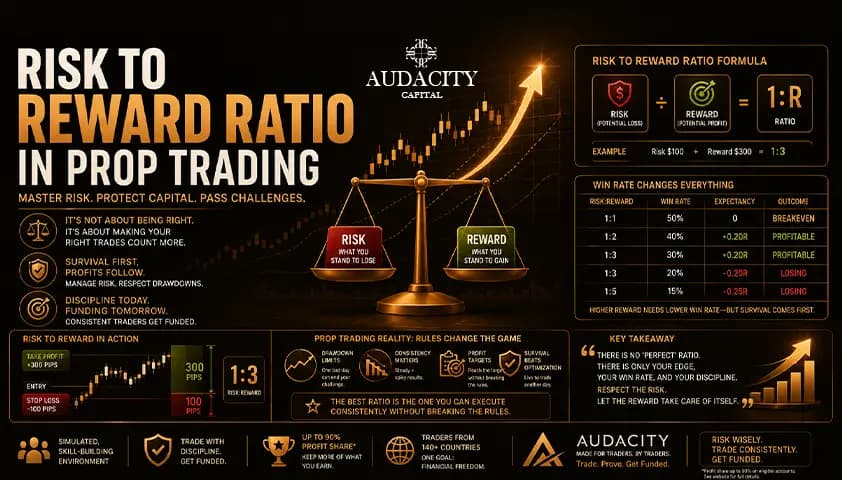
What Is Risk to Reward Ratio in Prop Trading?
Risk to reward ratio in prop trading explained: the formula, why win rate decides everything, and how drawdown limits change the math.

Best Time to Trade Forex in 2026: The Complete Session-by-Session Guide
Discover the best time to trade forex in 2026. This expert guide covers all four sessions, London-New York overlap, best days, worst days, currency pair timing, and a strategy-based schedule to maximize your trading edge.

Stop Loss in Day Trading : How to Use It Effectively?
Learn what a stop loss in day trading is, why it matters, and how to use it effectively. Discover stop-loss strategies, risk management techniques, and common mistakes to avoid.