


What Is Equity Drawdown in Prop Trading and How Is It Calculated?


Key Highlights
Equity drawdown in trading is defined as a percentage decline from the peak point of a trading account balance to its lowest (trough) point before hitting a new high.
In a nutshell:
- A drawdown represents a floating or temporary reduction and will only become permanent if you close a losing position when you’re at a low point.
- A deep drawdown can be psychologically punishing and is, in many cases, mathematically difficult to recover from.
- Traders need to use different management strategies, e.g., position sizing, to minimize damage to their account equity.
Equity Drawdown
An equity drawdown is a decline or a drop in your trading equity from its daily peak value. Experienced traders see it as a risk management system that empowers them to become disciplined, more responsible, and strategic in their decision-making.
Equity in trading refers to the total value of the trading account. Please note that this includes the account balance for that trading and will capture any potential losses and unrealized profits left on open positions. As such, it will change depending on how your live trades are performing.
In this guide, we will take a closer look at equity-based drawdown, how it is calculated, how to monitor and manage it, and more. Read on to learn everything you need to know about an equity drawdown in prop trading.
Read How to Choose the Right Prop Trading Firm?
Equity Drawdown Definition
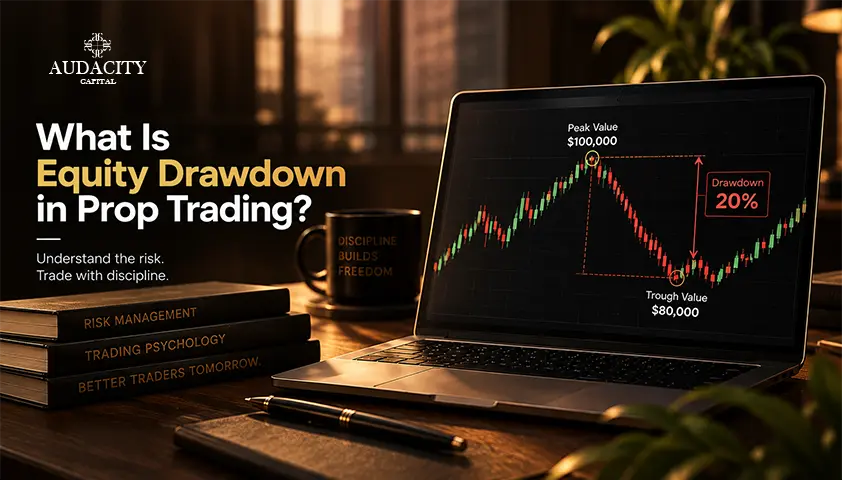
Equity drawdown refers to the reduction or drop in the value of a trade from its highest recorded peak to its lowest point before it goes on a recovery journey. Prop traders use it to measure the risk linked to a portfolio or particular investment strategy.
For instance, if your portfolio were to attain a peak of $100,000 before going on a decline and settling at $80,000, we’d say that the account’s drawdown is 20% or $20,000.
The important thing to remember is that the drawdown mentioned above is not permanent. It’s only used to measure the decline from the account’s high point, and is therefore not a measure of the loss incurred. By keeping track of such drawdowns, you’ll be better placed to understand your risk tolerance.
Real Life Example of an Equity-Based Drawdown in Action
I find that the best way to explain trading terminologies is by offering an example. In this case, let’s look at a trader who has purchased 1,000 shares of a tech-related company, with each share trading at $100 per share.
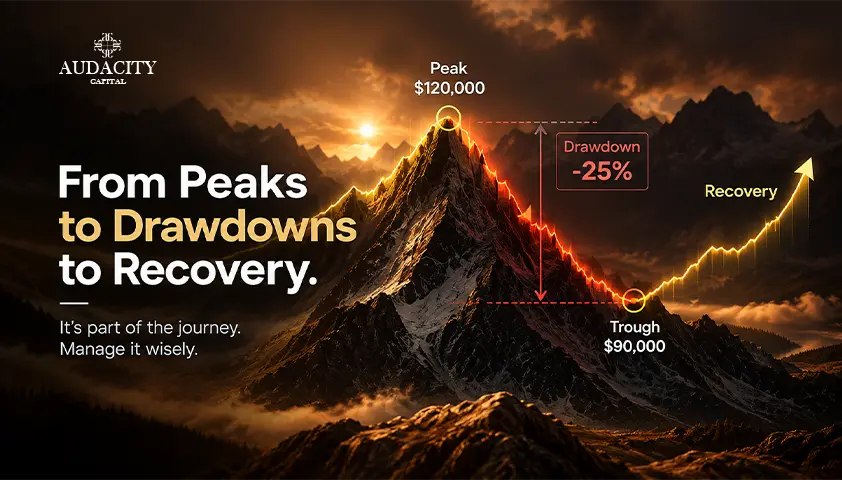
- Peak Value: $120,000
- Trough Value: Price fluctuations cause the shares to drop to $90, and the value is now $90,000
- Drawdown: 25% or $30,000
In our above example, the drawdown may seem severe, but the truth is that this amount or percentage doesn’t represent a permanent loss, unless you decide to sell them at this low price. It’s common for long-term investors to experience such dips, reinforcing the need for risk management.
The Psychological Impact Brought on By an Equity Drawdown
The concept of an equity drawdown is not only numerical, but it also comes with several psychological challenges. It’s not unheard of for a trader, even a seasoned one, to react emotionally when faced with a string of continuous losses. The events of a downturn can lead to poor decision-making.
Some of the behavioral responses exhibited by traders during such events include:
- Panic selling: Trying to offload their remaining investments at a loss due to the fear of making even more losses.
- Overconfidence During the Post-Recovery Period: This is when you begin making reckless investments after beginning your recovery journey.
- Analysis Paralysis: You become unable to perform any investment decisions due to the fear of experiencing another drawdown.
The three behavioral responses described above are a good indication of what can go wrong due to emotional decision-making. For professional traders, the equity drawdown metrics help keeps them focused; they ensure that their emotions don’t mess with their decision-making.
Types of Drawdowns You Can Expect to Encounter When Using Different Investment Vehicles
The drawdowns you’ll encounter will depend on the kind of investment vehicle that you have chosen to use. If you’re to become a seasoned trader, you must take your time to understand how each of the assets mentioned below will behave in a drawdown:
- Cryptocurrencies: They’re the most volatile of investment vehicles and can experience up to 50% drawdowns when markets are in correction.
- Stocks: Also tend to have high drawdowns occasioned by market volatility, but are known to have a higher potential for returns on market correction.
- Mutual Funds and EFTs: These two reflect the performance of their underlying assets. Please be informed that diversification can reduce the drawdowns.
- Bonds: Typically experience a small drawdown, but this can change whenever there are looming changes to the interest rates.
Knowing and understanding the drawdown range of each of the four mentioned investment vehicles will help you properly plan your allocations, thus avoiding unwanted surprises.
How to Use Tools to Monitor a Drawdown
Trading platforms, spreadsheets, and portfolio management software are some of the tools that come to mind when deciding on how to track and monitor a drawdown. Keeping track of a drawdown will help you react proactively whenever there are changes in the market, reducing the need to be reactive.
Now that you have an idea of the types of tools you can use, let’s consider the kind of drawdowns you’ll experience when trading with a prop firm:
- Absolute Drawdown: It helps traders understand their risk exposure by measuring the dip in a portfolio from the amount invested at first.
- Maximum Drawdown: Traders use it to measure the largest dip in an investment from its highest to lowest point.
- Relative Drawdown: A relative drawdown is typically expressed as a percentage and not in dollar terms, and is a representation of the peak value.
Calculating the Equity Drawdown
An equity drawdown is calculated using the simple formula below:
Drawdown ($) = Peak Value – Trough Value
Drawdown (%) = (Peak Value – Trough Value) ÷ Peak Value × 100
If we were to take a real-life example, this is what we’d do:
Peak Value: $150,000
Lowest (trough) Value: $120,000
Our drawdown would be calculated as follows: $150,000 – $120,000 = $30,000
The drawdown percentage will therefore be: ($30,000 ÷ $150,000) × 100 = 20%
You can use this formula to calculate the drawdown on mutual funds, individual stocks, or an entire portfolio.
Factors that Can Affect an Equity Drawdown
Several factors can affect the equity drawdown, including its duration. These include:
- Market volatility
- Diversification
- Investment horizon
- Leverage
Based on these four factors, you can now get a clearer picture of why it’s important to monitor a drawdown. For starters, it allows you to set a risk limit for your investment portfolio. It also enables you to evaluate your performance in the financial markets against the benchmarks that you have set for yourself. Using these, it will become easier to maintain emotional discipline when trading, thus preventing the possibility of panic selling after a particularly bad loss.
Always remember that drawdown is a risk measure and should not be used to judge performance. On the same breadth, a high return doesn’t indicate that your investment has low risk; this is because even profitable investments may at times experience significant drawdowns.
Conclusion
Drawdowns are unavoidable in prop trading. But reviewing the historical drawdowns of the assets you intend to invest will help you learn how to anticipate potential volatility. Confirm that the drawdown levels in place are in alignment with your personal risk tolerance, or else you may find yourself engaging in panic selling. At Audacity Capital, you’ll find a host of risk management tools that will guide you on how to limit and rebalance your drawdowns. Visit our website to learn more about this subject matter!
FAQs
Unfortunately, there’s no stated universal safe or best level. Each trader will have their own preferred levels depending on their portfolio size, investment horizon, and risk tolerance.
Yes. All you need is a disciplined approach that includes reducing your risk exposure and rebalancing your investment portfolio.
No. Each investment vehicle will be affected differently, with equities having a higher drawdown than cash or bonds.
It’s generally hard to predict a looming drawdown, even though a historical analysis of past drawdowns can help you anticipate a potential decline.
This is not always the case, as having a small drawdown may mean that your portfolio has been experiencing conservative growth.

Bereit, diszipliniertes Risiko auf Krypto anzuwenden? Entdecken Sie die neuen Krypto-Instrumente von Audacity Capital und bringen Sie Ihre Trading-Strategie mit.
Mehr erfahrenNewsletter
Treten Sie unserem Newsletter bei, um auf dem Laufenden zu bleiben.
Treten Sie unserer sozialen Gemeinschaft bei

Beginnen Sie Ihre Reise heute Mit unserer kostenlosen Testversion
Präsentieren Sie stolz Ihre Fähigkeiten und Leistungen durch Zertifikate und erhalten Sie Anerkennung für Ihre harte Arbeit und Ihr Engagement von potenziellen Investoren und Kollegen.
Kostenlose TestversionVerwandte Artikel

End-of-Day Trailing Drawdown Explained: Formula, Examples & Rules
Learn what end of day trailing drawdown means in funded trading accounts. Audacity Capital explains rules, calculation methods, and risk limits.


What Is Static Drawdown? How It Works + Examples
Learn what static drawdown means in trading and funded accounts. Audacity Capital explains how static drawdown works and how traders manage risk.

What Is a Daily Drawdown in a Prop Trading Firm?
Understand daily drawdown in trading, how it is calculated, and why managing daily losses is crucial for funded traders.

Trailing Max Drawdown
Understand trailing max drawdown rules in prop trading. Learn how it works, how it’s calculated, and how traders manage drawdown limits.