


Parabolic SAR: A Complete Guide


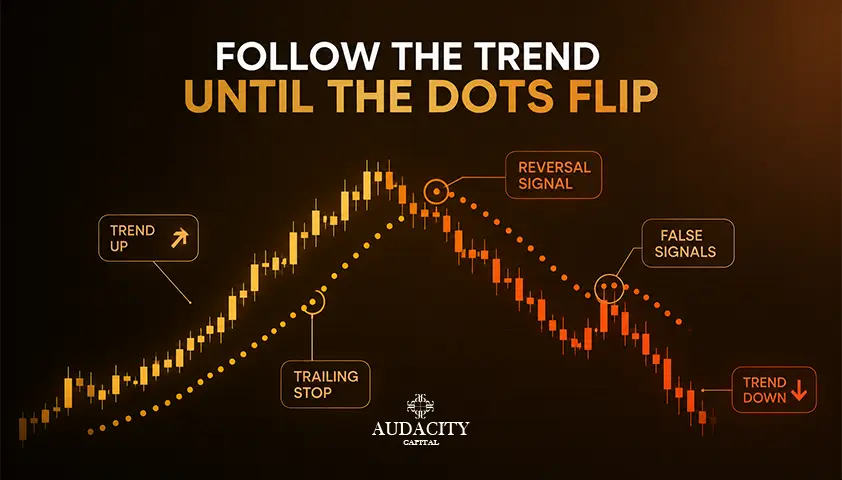
Parabolic SAR (Stop and Reverse) is a trend-following indicator that draws a series of dots on the price chart above or below the price.
It reveals the trend direction and can also be used as a trailing stop. In an uptrend, dots appear below price; in a downtrend, they appear above price.
Traders mainly use it to trail a stop and flag when a trend may be losing steam.
J. Welles Wilder Jr. developed the indicator and introduced it in his 1978 book New Concepts in Technical Trading Systems. He also created popular indicators including the RSI and ATR.
Today we will explain what Parabolic SAR is, how it's calculated, how to read its dots, and how to use it with a trend filter. Also including the conditions under which the indicator is likely to fail.
Before you begin, make it clear that this article is informational and should not be considered financial advice. The Parabolic SAR works well in clear trends and whipsaws hard in ranges.
There are no guaranteed results with any indicator. Each setting and example below is only illustrative and should be tested prior to investing actual funds.
What the Parabolic SAR Is
The Parabolic SAR is a trend-following indicator that plots dots to show trend direction and to act as a trailing stop. SAR refers to stop and reverse, where each dot is the price level at which an open position would be stopped and, according to Wilder's original system, reversed in the opposite direction.
The reading is easy to understand.
Dots that are placed below the price mean that the indicator is treating the market as an uptrend. Dots above the price mean that it is considering the market as a downtrend.
As the trend continues, the dots get closer and closer to the price, narrowing down the stop levels.
How is Parabolic SAR Calculated?
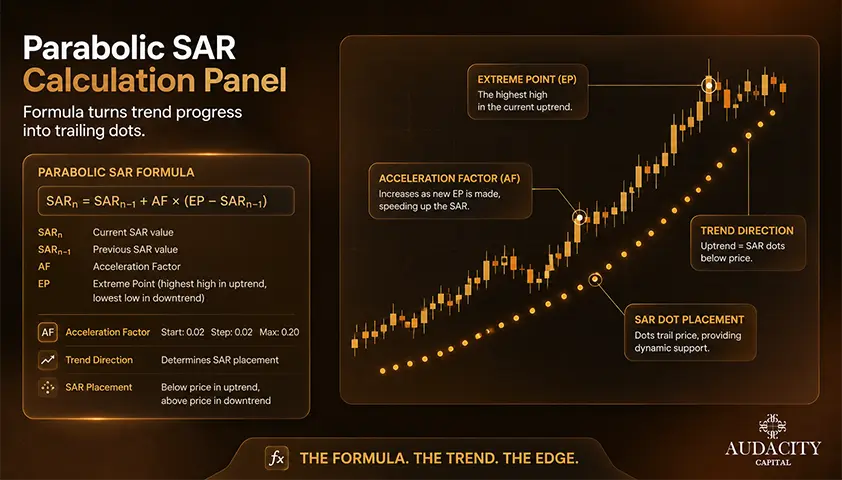
Simply put, the next SAR value begins with the current SAR value. The acceleration factor is then multiplied by the distance between the extreme point and the current SAR.
SAR next = SAR + AF × (EP − SAR)
Two variables determine the formula:
- The extreme point (EP) is the highest high of the current uptrend or the lowest low of the current downtrend. It changes whenever a new extreme point forms in the trend direction.
- The acceleration factor (AF) is initially set to 0.02 and then raised by 0.02 on each new extreme point reached, but limited to 0.2.
This acceleration is the key to how the indicator works. The more the trend progresses and the more new extremes the trend prints, the quicker the dots approach the price.
As the trend develops, this would make the trailing stop tighter, which is why this is called a parabolic movement.
SAR values need not be manually calculated. The understanding of the acceleration is only to help you use the indicator better.
Keep in mind that formula defaults and rendering may differ across platforms, so double-check to make sure that your chart is using the numbers you think it is.
How to Read the Parabolic SAR?
The Parabolic SAR becomes easy to read once the dots appear on your chart. The dots appearing below the price signal a rising trend, while dots appearing above the price signal a declining trend.
If the dots switch sides, this could be a potential trend reversal or pause.
Many traders regard it as a mechanical trailing stop because each dot represents a stop-and-reverse level.
The stop is walked up (or down) to every new dot as the trend continues and is closed when price crosses the SAR.
A flip is a signal to consider, not a certainty. In ranging markets these flips come frequently and most of them are false.
The Parabolic SAR Always Has an Opinion (Why It Needs a Trend Filter)
The Parabolic SAR always plots dots and always flips. It has no built-in concept of a market with no trend.
In a sideways range, the dots may oscillate between prices. Therefore, trading every flip as a signal can result in repeated losses.
That is the reason why taking every flip for a buy or sell signal is the most frequent mistake one makes using this tool. It is not trying to determine whether there is a trend at all. It is just telling you which side of price it currently favors.
The Parabolic SAR is more useful as a trend exit and trailing stop indicator rather than a standalone entry indicator.
Use it mostly to follow up on your current trend. It helps to trail your stop and signal a possible exit, and a different trend filter, setup, or market structure analysis will tell you if the trade would be worth taking.
The solution is to use it in combination with something that truly identifies if a trend exists or not. Common choices are:
- the average directional index (ADX) for trend strength,
- a higher timeframe for directional context, or
- a moving average for slope and side.
When the filter verifies a trend and its direction, SARs that are in alignment with the trend may be more useful.
Flips that go against the filter can be ignored. Some traders opt to take the double-SAR approach. They use a slower Parabolic SAR on a higher time frame for direction and a faster SAR on a lower time frame for timing.
The important point to remember is to apply Parabolic SAR to exit trades and for trailing stops within a confirmed trend. Don't use it to determine if a trend is present.
Test the strategy on your time frame and market before taking any live trades.
How to Use the Parabolic SAR in Your Trading?
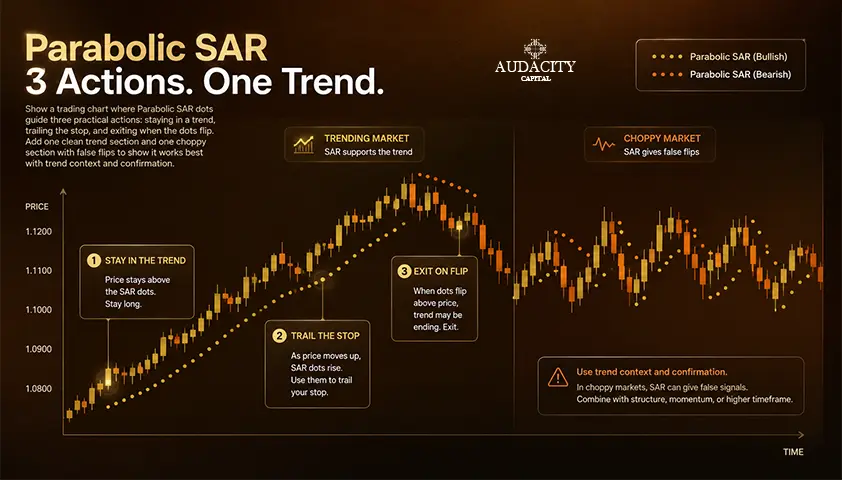
Now, let's see how to apply the Parabolic SAR in a practical trading approach, having the above mentioned frame in mind.
1. Trend direction and entries
If the trend filter is aligned, consider a flip in the direction of the trend as a timing signal.
For instance, when the ADX is above a certain threshold you've tested and the price is trading above an increasing moving average, a change in the direction of the SAR dots can be considered a long entry signal. Against the filter, ignore it.
2. Trailing stop
This is one of the best applications of the indicator. Adjust your stop to each new dot as the trend progresses, and close out your trade when price hits the SAR. As the trend progresses further, the dots are brought closer to the price due to the acceleration factor.
This gradually tightens the trailing stop.
3. Exits and reversals
A flip against your position can be used as a closing trade signal. For more aggressive traders, it can even be used as a reversal signal. But reversing on each SAR flip can result in frequent losses while trading a ranging market. Reversals are better applied in case of confirmed trends.
4. The acceleration factor as a sensitivity dial
The AF determines the degree of correspondence between SAR and price. Increasing step or maximum will speed up the reaction of the dots, thus causing more flips and early exits, whereas decreasing will give more time for the trend to develop.
The default parabolic SAR settings of a 0.02 step and 0.2 maximum are a starting point, not a truth.
Adjust them according to the volatility of your market and the speed of your timeframe as illustrative examples.
5. Confluence
A refined Parabolic SAR approach considers the indicator as one of many input data used. Combine it with the ADX for trend strength, moving averages for the direction, and RSI or MACD for momentum context.
The Stop-loss placement and position sizing should still be derived from your risk framework. You can use the ATR to help determine the initial stop, with the SAR taking over as a dynamic trailing stop once the trade is working.
All conditions and rules mentioned above are just examples. Test them on your chart and timeframe before trading with real money.
Limitations and Common Mistakes
The credibility check. Without grasping these, the Parabolic SAR will give you losses quickly.
The most common mistakes:
- Using flips as sole indicators of buying or selling.
- Using it in a flat period without a trend filter.
- Turning trend direction on each flip.
- Skipping the strength of a trend and focusing on direction.
- Using it on a time frame that is too fast for the account, so noise is dominant.
The structural drawbacks include:
1. It tends to whipsaw badly in range-bound and choppy markets.
This is not a drawback in a specific market situation but a result of an indicator that is always going to show a dot somewhere.
2, It has lag.
SAR is an indicator based on price and therefore, it can accelerate only after printing new extremes. It responds to the trend rather than anticipating it.
3. It does not calculate the strength of the trend but its direction.
Two different markets might have dots plotted below the price level, but one would be a clear trend and the other a slow movement.
4. It does not give an edge on its own.
The math is not proprietary, the signal is public, and any usefulness will depend on the way it is used with a larger process.
The Parabolic SAR indicator functions well as a trailing-stop and as a means of exiting in a strong trend environment. In ranging markets, frequent reversals render the indicator unreliable. It should be used within a proven system with a trend filter and risk.
The only way to know if it works for your trading is to try it out on a demo or simulated account. Record every flip and analyze the outcomes before betting real money.
Conclusion
The Parabolic SAR is a trend-following, stop-and-reverse indicator that shows direction and can trail a stop. It is more about managing exits in an already set trend than about predicting whether a trend exists.
Use Parabolic SAR as a stop and exit strategy rather than a trading signal alone. Combine it with ADX, another timeframe or a moving average to identify trends, and ATR to set up your initial stop and position size.
Record your findings on various markets and time frames, and first test it on a demo or simulated account before implementing it on a real account. Note that Parabolic SAR can give whipsaw action during ranging market conditions and should not be used as an independent edge.
Frequently Asked Questions
The commonly used default step of 0.02 and maximum of 0.2 are a reasonable starting point. Lower settings give trends more room and produce fewer flips. Higher settings react faster and produce more flips. The right choice depends on your market's volatility and timeframe. Test on historical data rather than assuming one setting is best.
Parabolic SAR is generally considered a lagging, trend-following indicator because it is calculated from past price data and reacts to developing trends rather than predicting them. Anyone selling it as predictive is misreading how the formula works.
You can, but doing so is risky. The indicator always plots dots and always flips, so it can produce frequent signals in ranging markets. A better approach is to pair it with a trend filter such as ADX or a moving average. Use SAR mainly as a trailing stop rather than a standalone entry system.
A flip means price has crossed the stop-and-reverse level, which the indicator treats as a potential trend change or pause. Inside a strong trend, flips can be meaningful exit signals. In ranges, flips are frequent and often false, which is why the flip needs context from a filter before it is acted on.
It can be applied to markets with candlestick data, including forex, indices, stocks, commodities, and crypto. It can also be used across timeframes, from intraday charts to weekly charts. Its basic behavior does not change by market. It tends to perform better in trending conditions and struggles in sideways markets.
Both are trend-following tools, but they operate differently. The SAR is an accelerating stop-and-reverse level plotted as discrete dots above or below price. A moving average is a smoothed price line that traders read for slope and crossovers. The SAR is more commonly used as a trailing stop, while a moving average is more commonly used for trend direction and dynamic support or resistance.
Move your stop to each new dot as the trend extends, so the stop tightens automatically as the acceleration factor rises, and exit when price crosses the SAR. This turns the indicator into a mechanical exit that gives the trade room early and reduces slack as the move matures. Confirming the initial entry with a separate trend signal is still recommended.
Yes, Parabolic SAR can be applied to crypto just as it can to other markets. However, crypto's volatility and frequent ranging phases can create more whipsaws. A trend filter and settings suited to the specific market can therefore be especially useful. Test any configuration before using it with live positions.

Bereit, diszipliniertes Risiko auf Krypto anzuwenden? Entdecken Sie die neuen Krypto-Instrumente von Audacity Capital und bringen Sie Ihre Trading-Strategie mit.
Mehr erfahrenNewsletter
Treten Sie unserem Newsletter bei, um auf dem Laufenden zu bleiben.
Treten Sie unserer sozialen Gemeinschaft bei

Beginnen Sie Ihre Reise heute Mit unserer kostenlosen Testversion
Präsentieren Sie stolz Ihre Fähigkeiten und Leistungen durch Zertifikate und erhalten Sie Anerkennung für Ihre harte Arbeit und Ihr Engagement von potenziellen Investoren und Kollegen.
Kostenlose TestversionVerwandte Artikel

Bullish RSI Divergence: How to Spot, Confirm and Trade It
Learn how to identify bullish RSI divergence, confirm reversal signals, choose entries, set stop losses, and manage risk effectively.

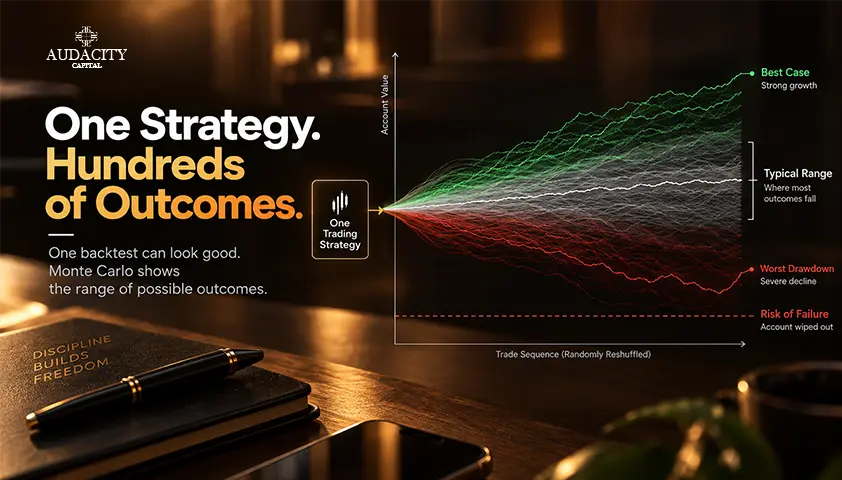
How to Stress-Test a Trading Strategy With Monte Carlo
Learn how Monte Carlo simulation reshuffles trades, estimates drawdown and losing-streak ranges, and tests a strategy beyond one backtest.

Swap in Trading: What It Is, How It Is Calculated and How It Affects Your Positions
Learn what a swap in trading is, how overnight fees are calculated, when triple swaps apply, and how swap costs affect forex and CFD positions.

Maximum Favorable Excursion: How MFE and MAE Read a Trade
Learn how Maximum Favorable Excursion and MAE reveal a trade's best and worst open moves, exit giveback, and possible entry or exit problems.