


Tape Reading in Trading: How to Read Time and Sales



Tape reading is the practice of interpreting the live stream of executed trades to judge how buyers and sellers are behaving in real time.
Instead of relying on a lagging indicator, you watch actual transactions as they hit the exchange and use that flow to see whether activity is accelerating, whether unusually large trades keep appearing, and whether price is genuinely responding at a level that matters to your setup.
In this guide, we will break down
- the Time and Sales window,
- explain the signals worth watching,
- and give you a repeatable workflow you can practice in replay before risking capital.
The goal is not to memorize dozens of patterns. It is to build one process for reading executions in context, so the tape becomes a decision tool rather than a scrolling wall of numbers.
What Is Tape Reading in Trading?
Modern tape reading is the interpretation of an electronic Time and Sales feed that records completed transactions in the sequence they occurred.
The old ticker tape has been replaced by a scrolling panel of prints, but the underlying idea is the same: study what actually traded, not what an oscillator says about the past.
The tape is different from an indicator because it is transaction data, not a calculation derived from historical price.
Every row represents a trade that cleared. That gives you a view of real activity in real time, which is why active intraday trading desks still watch it.
There is one limitation you should set early. The tape shows what traded, not who traded or their full intention.
A large print might be a hedge, an unwind, a spread leg, or an algorithm working an order. Your job is not to identify the participant. It is to interpret those executions in the context of your level, the current market microstructure, and the price response that follows.
Anatomy of Time and Sales: Price, Size, Time and Side
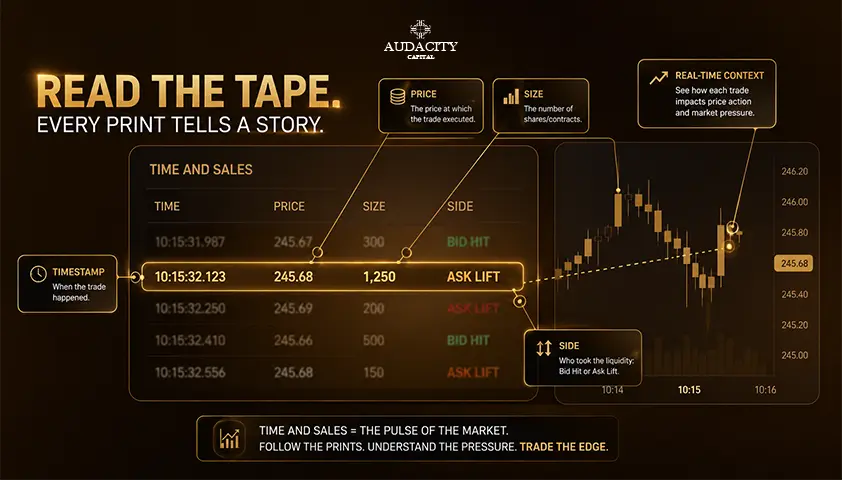
Before pattern hunting, decode one print.
A row on the Time and Sales feed usually shows four things: time, price, trade size, and side. Time is when the transaction occurred.
Price is where it is executed and Size is the quantity that changed hands.
Side, often shown by color, attempts to classify whether the trade printed at the bid or the ask.
Aggressor side logic works like this.
Trades that print at the ask are generally buyer-initiated, meaning a buyer crossed the spread to lift offers. Trades that print at the bid are generally seller-initiated, meaning a seller hit resting bids.
Different platforms use different colors and different classification rules, so learn the concept rather than assuming "green means buy" everywhere.
One more thing about the raw feed. Multiple small trades can execute in rapid succession, and some data feeds aggregate or filter trade prints differently.
If you compare screenshots from two platforms, they may not match perfectly. Understand your data source before drawing conclusions from it.
What Tape Readers Actually Look For?
Reduce the tape to four observable questions instead of a catalog of patterns.
- Pace: Are prints appearing faster or slower than normal for this instrument and time of day?
- Size: Are meaningful trade sizes showing up repeatedly, or is the flow mostly small retail-sized fills?
- Direction: Are aggressive executions lifting the ask, or are they hitting the bid?
- Response: Is price moving in the direction of that aggression, or is it stuck?
Above all four sits one filter: location. The same burst of aggressive buying carries much more meaning at a breakout level than in the middle of a quiet range.
Location decides whether the tape is worth watching in the first place.
The most useful signal is often a contradiction. Heavy buying pressure that cannot push prices higher can tell you more than buying that simply follows an already-rising market.
When aggression meets a wall, someone on the other side is willing to supply into it, and that is real information about who controls the level.
Why Does Speed of Tape Matters?
The speed of tape is the rate at which transactions print. Acceleration suggests increased urgency and participation. A slowdown often reflects reduced interest or a market waiting for the next catalyst.
Speed only makes sense in context.
The open, scheduled news releases, and the closing minutes naturally produce faster tape than midday. A tape that looks fast at 12:30 pm may be routine at 9:35 am.
Compare the current pace against what normal activity looks like for that instrument and that session, not against a fixed benchmark from another market.
Pair speed with size and price response. A fast stream of tiny prints is not automatically more important than a slower sequence of larger trades that repeatedly moves or fails to move price.
Skip the temptation to define "fast" or "large" with universal numbers. Learn the instrument's normal behavior first, then judge deviations from it.
How to Read the Tape Step by Step?
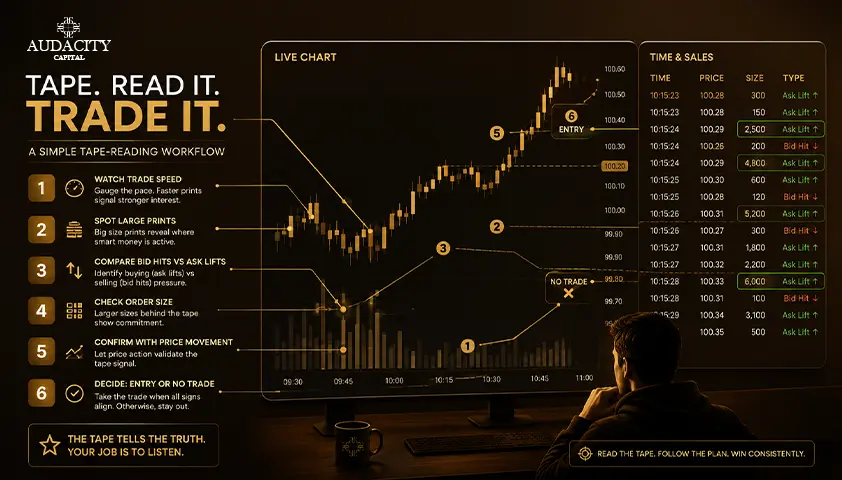
Use a fixed five-step workflow so tape reading trading becomes a process rather than a reaction to whatever prints scroll by.
Step 1: Mark the level before you watch the tape.
Identify a breakout point, prior high or low, or another planned decision point on the chart. Without a level, the tape is just noise.
Step 2: Establish normal pace and typical print size.
Spend a few minutes observing what routine activity looks like for this instrument at this time of day.
Step 3: Watch for change as price reaches the level.
Note whether the tape speeds up or whether meaningful size begins to appear as price approaches your zone.
Step 4: Identify which side is aggressive.
Determine whether ask-side executions or bid-side executions dominate the flow into the level.
Step 5: Judge the price response before acting.
Aggression only matters if price does what the aggression implies. If aggressive buying cannot lift price, that is a signal on its own.
One practical rule: if the tape becomes active but price does not respond as you expected, treat the failure as information. Do not force the original bias. Adjust or step aside.
Practice this sequence in replay or simulation. The point is to build pattern recognition relative to normal conditions, not to try to read every print in real time from day one.
3 Practical Tape Reading Setups
1. Breakout Confirmation
Context: Price tests a defined resistance level after a controlled approach.
Tape evidence: Ask-side executions accelerate and meaningful size begins to print into the level.
Price response: Price holds above the level instead of immediately slipping back inside the prior range.
Trigger: A long entry aligned with the breakout plan and the confirmed response.
Invalidation: Price falls back below the level after the aggression, showing the buying was absorbed.
2. Rejection or Absorption
Context: A key level, such as a session high or prior swing point.
Tape evidence: Heavy aggressive buying or aggressive selling hits the level repeatedly, with visible size on the aggressor side.
Price response: Price stops progressing despite the pressure, indicating absorption by the resting side.
Trigger: A fade entry only after the failure is clear, not on the first stall.
Invalidation: Renewed aggression finally clears the level and price extends through it.
3. Momentum Slowdown for Exit Timing
Context: A trade already in profit during a directional move.
Tape evidence: Prints were fast and directional. Now the pace fades, size thins out, and continued activity fails to extend price.
Price response: Higher highs or lower lows stop forming even though the tape is still active.
Trigger: A partial or full exit based on your plan, treating fading momentum as one input.
Invalidation: The pace and directional bias resume and price makes a fresh extension.
Note: These are outcome-neutral examples. None of them promise a result. Each requires a defined risk plan and a clear invalidation before you act.
How to Filter Noise Without Missing the Signal?
Start with relevance filters instead of chasing one magic size threshold. Filter by the instrument, its normal trade size, current volatility, the session, and the level being tested. Context decides what counts as meaningful.
Larger-trade filters can make the feed easier to read, but do not copy an absolute threshold from another market. A 100-share equity print and a 100-contract futures print carry completely different weights. Set the filter based on what is unusual for this specific instrument.
Use pace and repetition together. Several meaningful prints appearing quickly at the same level often matter more than one isolated large trade.
A single big print can be a hedge or a spread leg. Repeated aggression at the same price is harder to explain away.
Do not stare at every color change. The purpose of filtering is to answer one question about a planned setup, not to make the tape look visually calm. If your filter is not helping you decide something specific, it is decoration.
Tape Reading vs DOM vs Footprint Charts
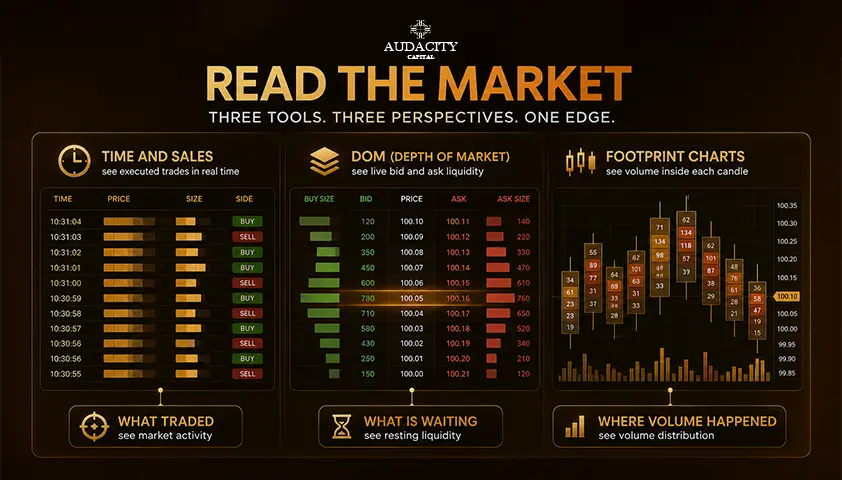
Each tool shows a different slice of the same market. Understanding the distinction stops beginners from confusing intent with execution.
Tool | What It Shows | Primary Use |
Time and Sales (Tape) | Completed trades in sequence with price, size, time, side | Real-time execution flow and aggression |
Level 2 / Depth of Market / DOM | Visible resting bids and offers before execution | Available liquidity and the shape of the book |
Footprint charts | Executed bid and ask volume organized by price inside each bar | Bar-by-bar review of where trading concentrated |
The practical combination is direct. DOM can show the resting liquidity waiting at a level. The tape can show how aggressively that liquidity is being traded through or held.
A footprint chart preserves the interaction so you can study it later.
Which Markets Are Best Suited to Tape Reading?
1. Futures
Futures are a clean teaching environment because contracts are centralized on an exchange. The Time and Sales feed represents actual trades in that contract, which makes the baseline easier to learn.
2. Equities
Equities are widely used for reading the tape stocks traders follow, but U.S. equity trading is fragmented across many venues. Feed quality matters. Know whether your feed is consolidated and which prints it includes before you draw conclusions from it.
3. Crypto
Crypto Time and Sales is exchange-specific, so the tape for one venue does not represent the entire market. Spot FX is decentralized. Broker transaction data does not represent a single global tape, which limits how well classical tape reading applies.
The takeaway is simple: Tape reading works best when the transaction feed is timely, sufficiently complete, and liquid enough to give you a meaningful baseline for normal activity.
Common Tape Reading Mistakes
Most tape-reading trouble comes from a short list of avoidable habits.
- Watching the tape without a predefined level or setup.
- Treating every large trade as institutional activity or a directional signal.
- Using absolute size filters copied from another instrument.
- Focusing on aggressive buying or selling without checking whether price actually responds.
- Confusing DOM changes with executed tape prints. Resting interest is not the same as completed order flow.
- Trying to read every transaction during the fastest periods before learning what normal activity looks like.
- Ignoring risk management because tape information feels more immediate than a chart signal.
Conclusion
A workable process for how to read the tape stays the same across markets. Choose the level first. Establish what normal activity looks like.
Watch pace and size as price approaches your zone. Identify which side is aggressive. Then judge whether price actually responds before you act.
This sequence works for Time and Sales trading in futures, equities, and any venue with a clean transaction feed.
The tape becomes useful when it answers a specific question about a setup, not when it fills the screen with prints. More activity does not automatically mean more edge.
Execution data still needs context, and every decision still needs a defined risk plan. Remember, trading involves substantial risk, and this article is educational content, not financial advice.
Frequently Asked Questions
Tape reading in day trading is the interpretation of executed transactions as they print on the Time and Sales feed. Traders use it to gauge urgency, size behavior, and which side is crossing the spread at a specific price. It is a context tool, not a standalone prediction method.
Time and Sales shows completed transactions in the order they occurred, typically with time, price, size, and side. It records what actually traded, not what participants intend to do next. Platforms may aggregate or classify prints differently, so learn your feed before comparing it to others.
Speed of tape refers to how quickly transactions are printed. Faster tape often reflects greater participation or urgency, while slower tape suggests reduced activity. Speed only carries meaning when compared against normal conditions for that instrument and session.
Trades printing at the ask are generally buyer-initiated, while trades at the bid are generally seller-initiated. That classification uses the bid and ask at the moment of execution and reflects who crossed the spread. Colors vary by platform, so verify how your feed labels the aggressor side.
Large trades on the tape mean size crossed the spread, but they do not automatically indicate direction or institutional intent. A single large print could be a hedge, a spread leg, or an algorithm completing an order. Repeated meaningful size at the same level is more informative than one isolated print.
Tape reading interprets executed trades, while Level 2 and DOM show resting visible orders that have not traded yet. The tape confirms what happened. The DOM shows what is offered. They answer different questions and are strongest when combined with a clear setup.
Beginners can learn how to read Time and Sales, but it takes structured practice. Start in replay or simulation with one instrument, establish what normal activity looks like, and use the five-step workflow at planned levels. Skip the fastest periods until you can read routine flow with confidence.

Bereit, diszipliniertes Risiko auf Krypto anzuwenden? Entdecken Sie die neuen Krypto-Instrumente von Audacity Capital und bringen Sie Ihre Trading-Strategie mit.
Mehr erfahrenNewsletter
Treten Sie unserem Newsletter bei, um auf dem Laufenden zu bleiben.
Treten Sie unserer sozialen Gemeinschaft bei

Beginnen Sie Ihre Reise heute Mit unserer kostenlosen Testversion
Präsentieren Sie stolz Ihre Fähigkeiten und Leistungen durch Zertifikate und erhalten Sie Anerkennung für Ihre harte Arbeit und Ihr Engagement von potenziellen Investoren und Kollegen.
Kostenlose TestversionVerwandte Artikel

What Is a Trading Edge (and How to Find Yours)
Learn what a trading edge really is, the math behind positive expectancy, and a practical six-step process to find, test, and maintain your own without overfitting.

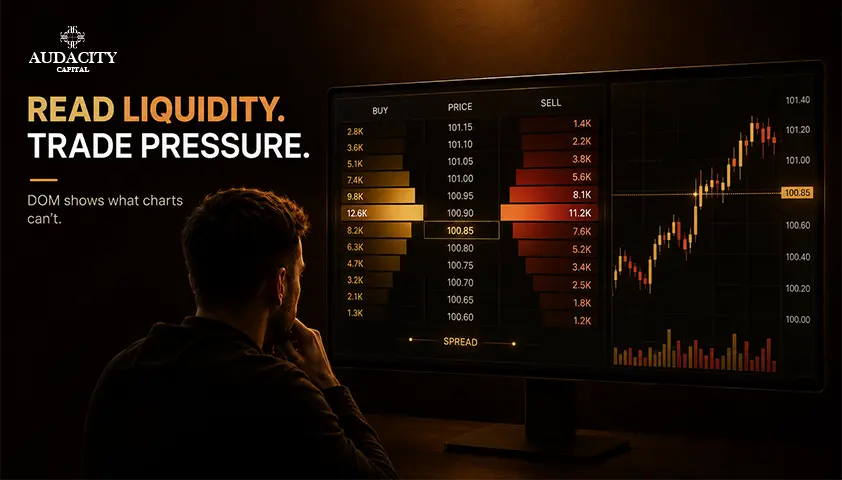
Depth of Market (DOM) Explained: How to Read Market Liquidity
Master Depth of Market (DOM) trading. Learn to evaluate order book liquidity, track real-time price response, and refine your execution with practical DOM insights.
Average True Range: A Complete Guide for Traders
Learn what average true range measures, how to read the ATR indicator, and how to apply ATR% to stops, position sizing and volatility regimes with clarity.
Cumulative Volume Delta (CVD): How to Read and Trade It
Cumulative Volume Delta (CVD) shows real buying vs selling pressure. Learn how CVD works, how to read divergence, and how to trade it across markets.