
Analysis For Day Trading: A Complete Guide

Trading has become a full-time profession for many people. Studies indicate that more than 9.6 million people engage in trading worldwide. This finding shows that trading sustains the economy of most countries.
Trading has only been available to people working in established companies in the past years as they have access to company reports. However, with the arrival of online trading, most people can now trade in the comfort of their homes. Several easy-to-use apps have been designed, and they provide instantaneous news, such as price movements, thus leveling the playing field.
So, what is day trading? Day trading is when traders purchase and sell financial instruments within a day. With this type of trading, traders can buy and sell several assets daily. Therefore, it allows you to capitalize on small market movements. Day Trading is unsuitable for part-time traders since it requires much dedication and attention. Unlike traditional trading, day trading focuses on market reports and other vital information to help make informed decisions.
Day trading can be a full-time profession only when you do it properly. It comes with several challenges, especially for novices. The best way to improve your trading is by learning the trading basics. This article provides technical and fundamental analysis for day trading.
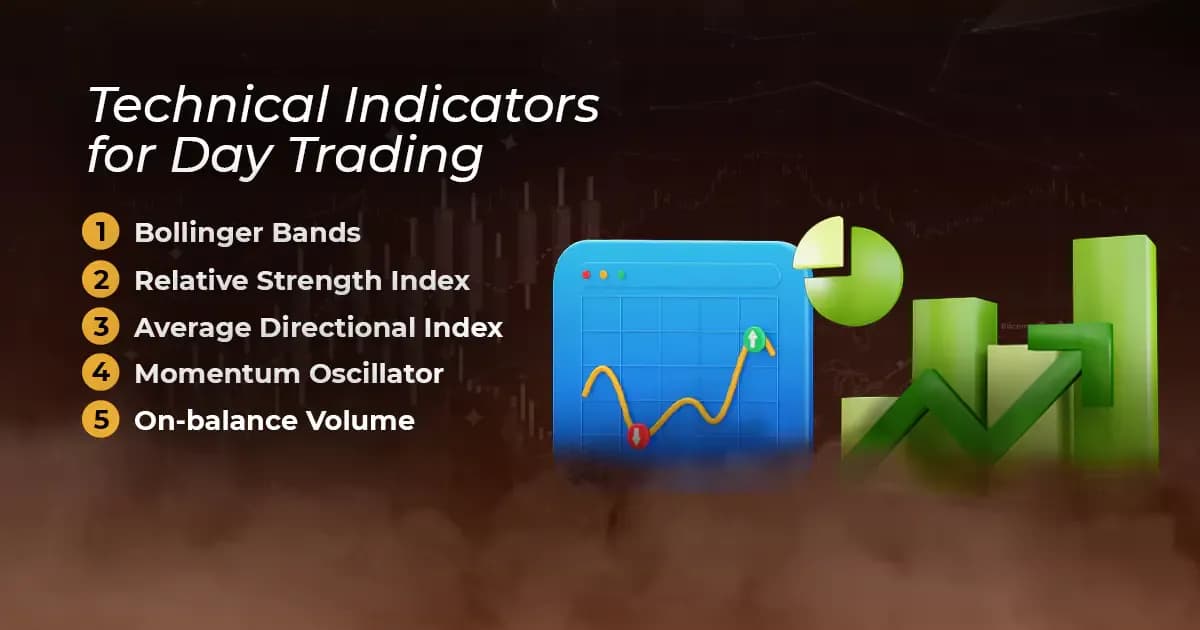
The Best Technical Indicators For Day Trading
Technical analysis is a fundamental process in day trading. Day trading involves making money quickly; thus, becoming an expert in forecasting future price movements and analyzing past price trends is necessary. Technical indicators are a set of tools that experts use to learn market behavior. Therefore, the more you understand the use of these tools, the more accurate the forecasts become.
Most technical tools are mathematically derived and are always displayed as charts. However, some technical indicators are overlayed on price charts. Overlays mostly use supply and demand information to indicate oversold and overbought, which are too much selling and buying pressure. These indicators also help identify market volatility.
Oscillators are another group of market indicators that derive their names due to their working mechanism: swinging between minimum and maximum processes to determine the market’s momentum. They can also identify oversold and overbought items, similar to overlays.
In summary, traders use technical indicators to:
- Confirm trends
- Enter and exit a position
- Identify market momentum
- Identify market volatility
Experts advise traders to use more than new indicators while trading. The best time to make an entry is when two or more indicators show it is the right time to make the entry. If two or more indicators do not agree, the trader should opt out of the trade.
There are several trading indicators available in most trading software. However, it is only possible to use a few indicators at once. A wise approach is selecting and using the top indicators for day trading.
The Most Preferred Trading Indicators For Day Trading
Bolinger Bands
Bolinger bands are mathematical tools obtained from standard deviations between two different means of price actions within a certain period. When using this indicator, one must select a moving average, ranging from 20-day to 100-day, and the number of standard deviations.
The steps for using this tool include:
- Using standard deviations to identify oversold and overbought conditions helps determine how far any variable has moved from the average. When the prices move far away from the average value, it has been oversold or overbought. Indication of overbought is when the prices in the period move towards the upper bound, while movement to the lower bound indicates an oversold
- Volatility measurements help measure movement fluctuation, speed, and intensity within a certain period. The upper and lower bounds can tighten, creating a position known as a squeeze. This condition indicates that the volatility is low and there is minimum deviation. On the other hand, high volatility is measured when the upper and lower band widens. Thus, it means too much deviation from the average value.
- Bollinger bands also identify swings since the process can move from the upper to the lower band or vice versa. Expert traders always wait for the price to bounce off the lower band, buy it when it’s above the moving average, and wait to sell it immediately after it touches the upper band.
Relative Strength Index
Abbreviated as RSI, the relative strength index belongs to the oscillator group that moves between 0 and 100. This tool measures the magnitude and frequency of recent deviations. Therefore, one can use it to compare the stock strength during overbought and oversold.
The RSI is usually derived after 14 days; thus, it adjusts to the last 14 days when the trading days increase. Therefore, when the tool falls, it indicates increased selling pressure and vice versa.
The process of using the RSI tool involves several steps, which include:
- Overbought and oversold identification. When the RSI moves above 70, it signifies an overbought, whereas it indicates an oversold when it is below 30.
- Chart patterns such as double top and double bottom also emerge in the RSI indicator, helping identify trends with either support or resistance. Support indicates that the stock stopped falling, while resistance indicates a stock that stopped rising.
- The tool contains a trend indicator that helps traders identify an uptrend or downtrend.
During trading, it is possible to observe an uptrend in the price chart but a downtrend in the RSI indicator. Such divergences indicate a potential reversal, and expert traders may use this situation to buy or sell signals.
Average Directional Index
An uptrend or downtrend is still insufficient to determine whether to buy or sell. Therefore, the ADI comes in to help measure the intensity of the movement. The ADI tool helps traders confirm whether the move was robust or weak.
ADI is obtained from the means and displayed by the direction of the movement lines. The direction of the move can be negative or positive. A positive move indicates a difference between today’s and yesterday’s maximum process for the last 14 days, while a negative move shows the difference between today’s and yesterday’s low process for the previous 14 days.
The two features of the ADI are:
- The momentum indicator shows a strong trend when the ADX goes beyond 25 and a low or weak trend when it is below 25.
- Trend direction can either be positive or negative. A negative trend is shown when the negative movement line is above the positive movement line.
Momentum Oscillator
Similar to RSI, the momentum oscillator also belongs to the oscillator group, and this tool determines the intensity at which the stock price has changed over time. It is obtained by dividing the current price by the previous price and multiplying it by 100.
Unlike other indicators, the momentum oscillator has no higher or lower limit. Therefore, traders must use past market data to identify support or resistance. The price reversal feature can also indicate a price change when it is about to happen.
On-balance Volume
Similar to the momentum oscillator, on-balance volume also indicates the continuation of a trend. However, it differentiates from others since it uses volume data to calculate trend continuation. The on-balance volume is obtained from the cumulative difference of days when prices rose and fell. The value will increase when today’s closing price exceeds the previous day’s price.
Using OBV is easy. An upward trend continues when the tool shows higher trends and higher lows. On the other hand, when it shows lower lows and lower highs, a downward trend will continue.
How To Use Fundamental Analysis In Day Trading
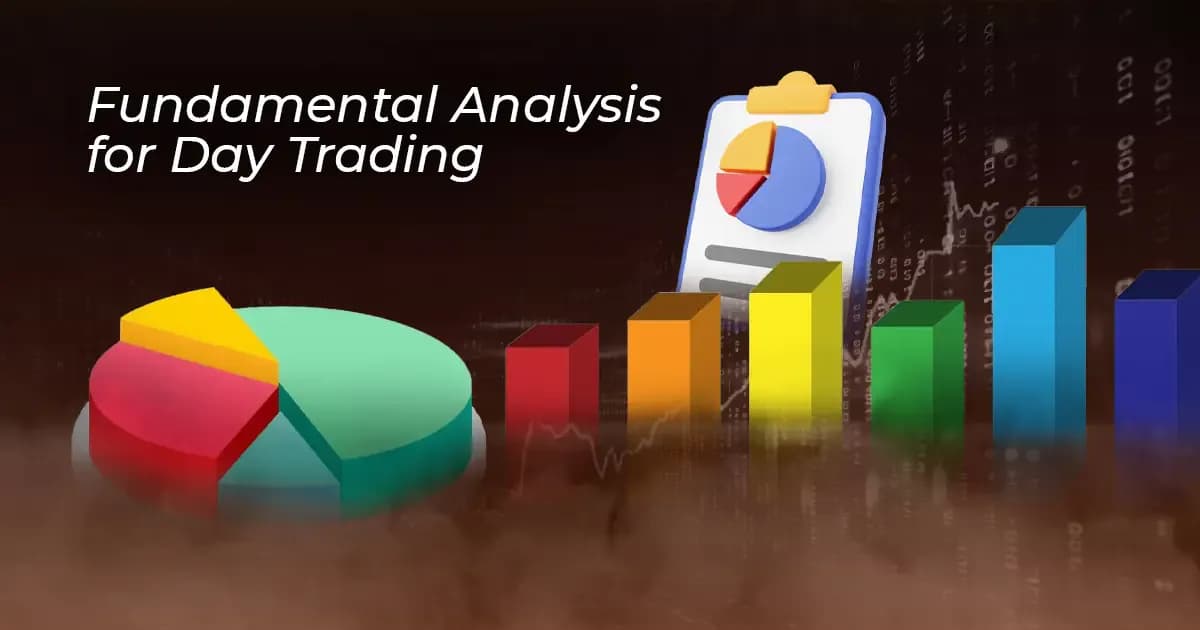
Fundamental analysis is using non-quantifiable data to forecast the value of an asset. The primary data types used in the assessment include economic and financial data. This information helps investors identify the value of assets that do not show in the current market price.
Unlike technical analysis, fundamental analysis applies to any asset. Fundamental analysis can help traders identify whether an investment is overvalued or undervalued. This process involves examining risks, future growths, historical patterns, and asset performance.
Fundamental analysis is beneficial to all kinds of traders. However, using fundamental analysis for day trading can help plan trading strategies. Day traders who use volatility trends rely on fundamental analysis to predict whether movements will be higher or lower.
Fundamental analysis comes into forms which are:
Quantitative Analysis
This analysis involves studying market data, interest rates, and earnings per share. The asset is research that determines the quantitative data to use. The data obtained from the analysis are used to compare with other similar averages and identify whether they are profitable.
Qualitative Analysis
The qualitative analysis examines qualitative data such as brand recognition and proprietary technology. This mainly focuses on the standards rather than elements that only work with numeric data, such as company valuation.
Fundamental Analysis Explained
Fundamentals enable investors to view long-term price fluctuations and focus on other factors determining future performance. Fundamental analysis helps quantify the company’s value and shares. Data such as financial statements provide tangible information about the company’s liquidity, profitability, and economic stability.
Combining this information with qualitative data such as industry trends and company management can help investors make profits during trading.
Technical Vs. Fundamental Analysis: Which One Works Best For Day Traders
Technical and fundamental analysis offers traders vital information, but its use varies depending on one’s trading strategy. Understanding each analysis type can assist you in designing your trading approach and decisions.
Fundamental analysis is beneficial to long-term investors since it helps in:
- In-depth understanding of company fundamentals such as growth prospects, dynamics, and competitive advantage.
- Identifying value enables traders to know whether a stock is overvalued or undervalued.
- Managing risks as investors can check on liquidity situations, debt levels, and financial metrics.
Technical analysis is the most suitable option for day traders who want instant profits. Technical analysis provides:
- Immediate insights using charts and patterns
- Predictive potential through the analysis of trade volumes and price movements. It also helps traders anticipate a specific price signal, thus capitalizing on short-term market swings.
- Risk and reward evaluation helps traders determine the best entry and exit points, thus minimizing losses and increasing profits.

Prêt à appliquer un risque discipliné aux cryptos ? Explorez les nouveaux instruments crypto d'Audacity Capital et apportez votre stratégie de trading.
En savoir plusNewsletter
Rejoignez notre newsletter pour rester informé.
Rejoignez Notre Communauté Sociale
Commencez Votre Voyage Aujourd'hui Avec Notre Essai Gratuit
Affichez fièrement vos compétences et réalisations grâce à des certificats et obtenez la reconnaissance de votre travail acharné et de votre dévouement auprès d'investisseurs potentiels et de pairs.
Essai GratuitArticles Connexes

Gold Hits Record Highs Then Crashes: The Full Fundamental Breakdown
Gold hit record highs before falling sharply. Why is gold crashing and will gold crash further? Discover the real reasons behind the gold price crash with insights from Audacity Capital.

The Santa Claus Rally. What Traders Need To Know As The Year Comes To A Close

How to Trade Gold (XAUUSD): The Complete Guide
Learn how to trade Gold (XAUUSD) like a professional trader with Audacity Capital. Discover proven strategies, risk management techniques, session timing, and expert tips for consistent gold trading success.
