



Day Trading Technical Analysis: Indicators, Strategies & Tips



Day trading technical analysis is a way of reading historical price + volume data, so within minutes you can judge if a setup deserves your money. Since a trading position opened and closed in a single session depends highly on timing plus the chart is where the timing shows, participants rely on this analysis.
Technical analysis for day trading checks trend direction, volatility, momentum along with support and resistance. It is like a framework that doesn’t promise what price does next, but it marks the level where a trade idea starts working and the level where it is wrong.
If you want to know more about technical analysis day trading, this guide will present chart types, moving averages, RSI, MACD, setups, and a lot more.
What Is Day Trading Technical Analysis?
The study of what a market has already done, examined through the six factors every chart includes, is called day trading technical analysis. These factors are:
- Price, meaning where the instrument opened, traded, and closed, bar by bar.
- Volume, the number of shares or contracts that changed hands at those prices.
- Volatility, or how far price swings within a given window.
- Historical market behaviour, which shows how that stock reacted around these levels last week.
- Time, because every minute of any session can differ from another moment.
- Market structure showing the run of higher or lower highs and lows that shows which side holds control.
But fundamental analysis of day trading is different. This practice involves studying earnings, balance sheets, economic data, etc to find out the worth of an asset, which suits an investor holding for months or years. Because day trading involves making decisions within a single trading session, technical analysis for day trading is particularly useful when a decision rests on short-term price behaviour, and a quarterly report has little to say about the next hour.
Technical analysis | Fundamental analysis |
Price and market data | Economic and business data |
Charts and indicators | Financial statements and economic indicators |
Market structure and momentum | Valuation and underlying conditions |
Often useful for timing | Often useful for broader valuation and context |
Common in short-term trading | Common in longer-term investing |
Experienced traders still check the news calendar before the bell, since technical analysis day trading setups can fail within a few seconds when a surprise announcement lands.
How Does Technical Analysis Work for Day Trading?
Doing day trading technical analysis comes down to a chain that links an answer to a new question before the next opens. Here’s the chain:
Market → Timeframe → Structure → Key Levels → Setup → Confirmation → Entry → Stop → Target → Position Size → Review.
Here’s how each link of this chain works:
- Market: It’s where traders identify an uptrend, since ranges and volatile spikes call for different tactics.
- Timeframe: A lower chart supplies timing, whereas the higher one supplies context.
- Structure: The higher highs and higher lows show buyers in control.
- Key levels: Mark the prior resistance above and VWAP below.
- Setup: Price consolidates under that resistance and becomes a breakout candidate.
- Confirmation: Look for momentum or volume to expand as price pushes through.
- Entry: A close above the level triggers the order.
- Stop: The stop-loss goes where the idea fails, which anchors technical analysis risk management.
- Target: Set the exit beforehand, since day trading entry and exit signals mean little without risk/reward.
- Position size: Stop distance and your account risk limit decide the share count.
- Review: You log the outcome to feed it into the backtesting and your trading plan.
The timeframe, along with chart shapes, affects every later step, and that is why they come next.
Day Trading Analysis Charts and Timeframes

New traders see one chart and follow it, but in reality there’s no universal chart or timeframe that will suit them all. Every chart works depending largely on your holding period.
For instance, candlestick charts are suitable for intraday analysis because each candle brings together four key price points:
the open, high, low, and close.
Some Common Intraday Timeframes
- 1-minute: scalpers use it for fast entries, and it carries the most noise.
- 5-minute: a popular balance of detail and clarity for liquid markets.
- 15-minute: slow enough to show a pullback or range forming.
- 30-minute: outlines the opening range and early session balance.
- 1-hour: frames the broader structure behind the day's moves.
- Daily chart: Gets reviews prior high and lows and before the open for multi-day trend.
Because the opening and closing hours bring heavier volume than midday, session timing matters too.
Multi-Timeframe Analysis
Suppose the higher timeframe is the context, the middle is the setup, and the lower is execution, this is what one workable stack will look like:
- 1-hour → identify broader structure
- 15-minute → locate the setup
- 5-minute → assess entry
Lower timeframes give more information, but that doesn’t always mean better information. At times, a 1-minute wiggle can look like a reversal while the hourly chart shows only a pause inside a trend.
Key Components of Day Trading Technical Analysis
Now come the important components. Although much technical analysis for beginners content starts with indicators, these five essentials hold the real weight and feed the next.
Price Action
Every indicator is the maths done on price and volume thus read the candles before any indicators. The candlestick records the open, low, high, and close of its period. A run of them shows the direction as follows:
- Higher highs and higher lows build an uptrend.
- Whereas lower highs and lower lows build a downtrend.
Big candles with small wicks display momentum, and a long wick closing back inside a level means rejection. Post-breakout, price generally drifts back and tests the level. That pullback shows more about the move's strength than the breakout candle could.
Support and Resistance
The swings from the section above leave footprints which are called Support and Resistance. Good technical analysis strategies draw them as zones because price rarely reverses on one exact tick. Round numbers such as 100, along with previous highs and lows, make the horizontal levels and draw attention. VWAP and moving averages work as levels that slide with the price. Levels then change sides - once the price clears resistance and comes back to test it, the old ceiling becomes the new floor. A zone that shows up on both the hourly and 15-minute chart deserves more respect.
Trendlines
Another key component is Trendlines. Its role is to draw, but it is the easiest to misuse. This component lets traders connect falling swing highs for a downtrend and rising swing lows for an uptrend. Trendlines stick to meaningful turning points, because a line through every wiggle usually proves nothing. Therefore, as price breaks the line, hold off, as it may slip through briefly, sliding into a range or snapping back. Many traders wait for a close beyond the line and a retest.
Market Structure
Now market structure takes swings from price action and labels them as HH, HL, LH, and LL. It then asks which side defends its last swing point because that's where sellers and buyers step in. The pattern becomes clearer when you look at which swing points price continues to hold. In an uptrend, for example, higher lows show that buyers are continuing to defend higher areas. If that structure starts to fail, the market may be moving into a different phase. Terms such as break of structure (BOS) and market structure shift (MSS), sometimes called a change of character, can vary between trading methods. Here, a BOS refers to price closing beyond a previous swing point, while an MSS describes a move that breaks the swing point supporting the existing trend. For example, a close below a recent higher low may suggest that an established uptrend is losing its structure.
Volume
The last component is volume, which gives another view of how much participation accompanied the move (shown in price). When it comes to stocks and futures, volume refers to the number of shares or contracts that are traded. This metric is super helpful for gauging the strength behind a price movement. For instance, if you see a breakout accompanied by increasing volume, it indicates that there's more participation and interest compared to a breakout that happens on low volume. The same principle applies during a pullback as well.
Volume has to be understood in relation to the market you’re dealing with. It’s simpler to measure in markets like stocks and futures, where exchanges report consistently. But in spot forex, which is traded over the counter without a central exchange, there’s no combined volume number available. Brokers usually just provide tick volume. Keep in mind, tick volume only counts when prices change—think of it as a clue.
Best Technical Indicators for Day Trading
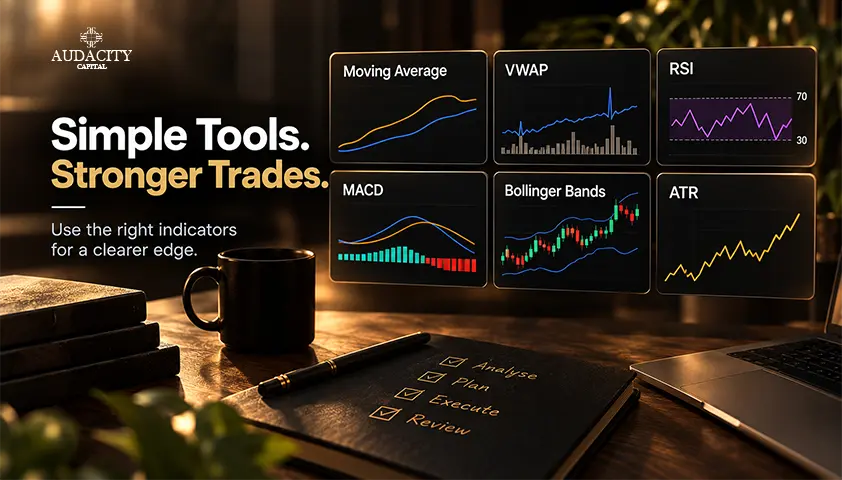
Up to this point, we’ve focused on price action, support and resistance, and market structure. Now, let’s introduce indicators, which will provide an extra layer of insight. Indicators transform price and volume data (when it’s available) into metrics that help us gauge volatility, trend, and momentum. However, don’t overcrowd your chart with indicators. Stick to a small selection of effective tools, and you will find it easier to interpret and avoid any mixed signals.
For technical analysis for day trading, these indicators cover the main jobs:
Moving Average
Moving averages are an important technical indicator that smooth out price action and give a clearer idea of the market trend. SMA, or Simple Moving Average, gives the same weight to every price in the calculation. Whereas EMA, the Exponential Moving Average, gives more weight to recent prices; thus, it reacts faster when the market moves.
Traders who are involved in short-term trading usually watch the 9 EMA or 20 EMA. But for a better picture of a broader trend, longer averages like the 50 or 200 SMA are better. These are common choices, not rules.
VWAP
VWAP, which stands for Volume-Weighted Average Price, shows the average price traded during a session. It gives more weight to prices where higher volumes were exchanged. VWAP is useful for intraday analysis as it resets with each trading session.
VWAP is a benchmark for traders to find out if the price is sitting above or below the average traded price for the session. But a pullback towards VWAP can be significant, importantly if it aligns with a trend, a support level, or other indicators on the chart.
Still, price moving over VWAP doesn't make a trade attractive, and it is the same as trading below does not justify a short position. VWAP is useful in circumstances when it aligns with what price and market structure are already showing.
RSI
The Relative Strength Index (RSI) checks the strength of recent price moves on a scale of 0 to 100. The 14-period setting is the most commonly used and can help traders judge momentum.
Readings above 70 are usually considered overbought, while readings below 30 are considered oversold. This does not mean price will automatically reverse. In a strong trend, RSI can stay overbought or oversold for some time.
Traders often use RSI alongside price action. Divergence can also be useful. If price makes a higher high but RSI makes a lower high, it may be a sign that momentum is losing strength. The reverse can happen when price makes a lower low, but RSI makes a higher low.
MACD
Another commonly used indicator is the MACD, or Moving Average Convergence Divergence. It is used to track changes in momentum by comparing two exponential moving averages. The standard settings use a 12-period EMA and a 26-period EMA, with a 9-period EMA as the signal line.
Traders observe if the MACD line is crossing the signal line, changing in the histogram, or if there’s any divergence between the indicator and the price. Any such signal can help find out if the momentum is gaining strength or losing it.
But this indicator has a limitation. Because MACD is based on price, it can react after the price has already moved. Therefore, it is a good supporting tool but not a reliable standalone reason to jump into a trade.
Bollinger Bands
Bollinger Bands include an upper and lower band, both encircling a moving average. The distance between both adjusts based on how volatile the market has been. When the bands come closer together, it signals that volatility is low. On the other hand, when they widen, it indicates that price movements are becoming more pronounced.
When the bands are narrow, traders can catch it, as it usually hints at an upcoming increase in volatility after a quieter stretch. But it is also important to know that a squeeze doesn’t show the direction of the next price move. Similarly, if you hit the upper or lower band, it also doesn’t automatically mean the price will reverse. For those engaged in day trading, Bollinger Bands are best utilized in conjunction with the surrounding price action and the type of market being analyzed.
ATR
ATR is Average True Range, which measures how much an asset has been moving over a set time. It doesn't tell if the market is set to rise or fall as RSI and MACD do, but it gives insight into the recent trading range and volatility of the market.
That makes ATR particularly useful for risk planning. If you set a stop that’s too tight compared to the usual market movements, even a normal price swing will trigger it. Therefore, by using ATR, you can check if the planned stop is reasonable or not for the current market conditions or adjust the position sizes accordingly.
Day Trading Chart Patterns
With chart patterns, traders have another way to read what price may do next. But that’s not a guaranteed forecast because patterns can produce different outcomes depending on the market conditions.
Continuation Patterns
Continuation patterns are flags, pennants, triangles, and rectangles. The price pause during/ after an existing movement in these shapes. It is common to spot a flag or pennant after a sharp price increase (plus a brief period of consolidation). Similarly, rectangles and triangles show that the price is either tightening up or moving within specific limits.
Just learn this sequence:
Formation → market context → breakout or confirmation → invalidation
Reversal pattern
In trading strategies, reversal patterns can tell if the ongoing trend is starting to lose its momentum. These patterns are double tops & double bottoms, head and shoulders, inverse head & shoulders, and certain wedge formations.
For example, a double top. It appears when the price tests a similar high twice but struggles to push higher. Whereas a double bottom appears to show the opposite trend. Similarly, inverse versions show up after a decline, whereas head and shoulders patterns develop through a series of peaks.
But the pattern itself is just one aspect of the analysis.
Candlestick Patterns for Day Trading
Candlestick patterns are an excellent way to visualise the open, high, low and close of each trading period. They are useful for spotting changes in buying and selling pressure mainly around important price levels. The candle body with wicks gives information about the trading range and how buyers and sellers behaved during the period.
Common patterns include:
- Doji: The open and close are close together, showing hesitation within that period.
- Hammer: A small body with a longer lower wick that can show rejection of lower prices.
- Shooting star: A small body with a longer upper wick that can show rejection of higher prices.
- Engulfing candle: One candle body covers the previous candle's body.
- Morning star: A three-candle formation often watched after a decline.
- Evening star: A three-candle formation often watched after an advance.
- Spinning top: A tiny candle with wicks visible, showing the struggle between buyers and sellers.
These patterns are more handy when they form at a meaningful level or within a clear market structure. A hammer in the middle of a random range does not carry the same information as a hammer appearing after a decline into established support.
For more detail on individual formations, do check our candlestick patterns guide.
How to Find a Day Trading Setup?
Even before the entry signal appears, a good setup starts. So work through the market in a fixed order, let the conditions determine whether a trade exists, and stop ‘just’ searching the chart for a pattern that justifies a trade.
1. Know the market condition
First decide whether price is:
- Trending higher or lower
- Moving sideways within a range
- Consolidating before a possible expansion
- Moving unusually fast because volatility has increased
You have an answer and it will change which setups make sense. A pullback may suit a clear trend while a range strategy works when price repeatedly respects two boundaries.
2. Mark the important levels
Now find out and mark the areas that can influence price. These areas/levels can be:
- Support and resistance
- Previous highs and lows
- Session highs and lows
- Trendlines
- Moving averages or VWAP
- Other levels relevant to the chosen strategy
3. Pick a timeframe
Pick a higher timeframe to learn the broader structure. Pick a lower timeframe when you need a more accurate execution. The right combination depends on the strategy and market.
4. Wait for the setup
Now wait for the price to come to you, and for that, it may involve a:
- breakout
- pullback
- continuation
- reversal
- reaction from support or resistance
5. Look for confirmation
Anything from price action, volume where reliable data exists, market structure, a relevant indicator, or momentum can bring confirmation. But no single confirmation method works in every market.
6. Define the trade
Before entering, establish the:
- entry price or entry condition
- invalidation point
- stop-loss
- potential target
- position size
- amount of capital at risk
7. Execute the plan
Once you meet all the conditions, follow the rules that were defined before the trade. Don’t change the setup because the market starts moving differently after entry.
8. Review what happened
Once you have completed the trade, analyse if the setup actually followed the plan. Remember there are possibilities:
Poor discipline could have ended up with a profitable trade and even a well-executed strategy can result in a losing trade.
That difference is important because day trading technical analysis should help create a repeatable process, because you can’t judge every decision by its immediate result.
Day Trading Technical Analysis Example
Suppose during an upward move, a trader is watching EUR/USD. On the one-hour chart, price is making higher highs and higher lows, so instead of chasing the move, the trader waits inside.
Price later pulls back towards an area that acted as support earlier. On the five-minute chart, sellers start losing control and a bullish candle forms around the same area. That gives the trader a reason to watch the setup more closely.
Before entering, the trader decides where the trade would be wrong, sets a stop, chooses a potential target, and works out the position size based on the amount they are willing to risk.
The trade is then managed according to the original plan.
This is a hypothetical example of day trading technical analysis, not a trading recommendation.
Technical Analysis for Different Markets
Technical analysis follows the same broad principles across markets, but the market itself changes the information available to a trader.
Market | What can matter most during intraday analysis? |
Forex | Currency pair behaviour, sessions, spreads, volatility and economic releases |
Stocks | Volume, opening gaps, market open, individual volatility and company news |
Futures | Contract size, tick value, volume, margin and expiration |
Crypto | 24-hour access, exchange liquidity, volatility and exchange-specific volume |
Technical Analysis vs Fundamental Analysis for Day Traders
Technical and fundamental day trading analysis are very different. It’s the market (like volume, price, chart, volatility, etc.) that generates information leading to technical analysis. But when the analysis goes beyond the chart (like economic releases, interest rates, company earnings, financial conditions), it is known as fundamental analysis.
If you are a trader, you don’t have to pick just one; you can mix both. How? Use technical analysis to spot a breakout on a currency pair while using fundamental analysis to observe the economic calendar.
Common Mistakes of Day Trading Technical Analysis
Mistakes in technical analysis are less due to recognising a pattern and more due to giving a pattern or indicator higher importance than it deserves.
1. Filling the chart with indicators
2. Treating signals as certainty because none can tell you what price will do next.
3. Ignoring market structure due to short-term signals.
4. Trading every setup even when the conditions are not in your favor.
5. Chasing a trade or price that doesn't make sense.
6. Ignoring the higher timeframe, knowing it can change how a short-term setup should be interpreted.
7. Moving the stop loss due to emotions. Leaving a strategy too fast without reviewing the rules, market conditions, etc.
How to Validate and Improve a Day Trading Technical Analysis Strategy?
Test the day trading technical analysis strategy and don't rely on hindsight if you really want to validate and improve.
Start with precise rules and define the market conditions, entry triggers, target, position-size method, and stop. Now test those rules across historical trades that include different environments. Focus on the details that can make historical results look better than real trading:
- Spreads
- Commissions
- Slippage
- Execution assumptions
- Changing market conditions
- Losing periods
- The number of trades tested
Do not change the rules every time the historical results produce an unwanted outcome or it can turn testing into curve fitting.
Once you are done with historical testing now either use a simulator or other controlled environment and see whether they can follow the rules in real time.
Risk Management in Day Trading Technical Analysis
Good chart ≠ A safe trade. A setup that fits your trading rule can also fail, and that’s why you decide risk before opening a position.
One useful relationship is:
Position size =Acceptable trade risk ÷ Risk per unit
This simple formula connects your prepared loss with the distance between the entry and invalidation point. If the stop needs to be wider because the market is more volatile, position size may need to become smaller.
A complete risk framework can include:
- Maximum risk on one position
- Maximum daily loss
- Total open exposure
- Stop-loss rules
- Leverage limits
- A point at which trading stops
When it comes to risk and reward, it’s all about balancing the potential outcomes with what you’re putting on the line. But remember, a high ratio doesn’t magically transform a weak setup into a strong one. Leverage is something to tread lightly with, as it can boost both your profits and your losses. A trader might nail the market direction but still find themselves overexposed to risk.
Tools Used for Day Trading Technical Analysis
The most useful technical analysis tools are the ones that solve a real problem in the trading process.
A typical setup may include:
- A charting platform
- Technical indicators
- An economic calendar
- A market screener
- Volume data
- Backtesting software
- A trading journal
- A position-size or risk calculator
It’s not the software that creates an edge; it’s all about whether the trader can interpret the information it provides and use it reliably. Often, a straightforward chart with a well-defined process can be much more beneficial than a complex screen packed with every possible indicator.
Day Trading Technical Analysis for Prop Traders
Prop traders can use technical analysis day trading methods in much the same way as other intraday traders, but they also need to account for the rules attached to the programme.
A setup may look attractive on the chart and still be unsuitable if it conflicts with the account's conditions. Traders should check the applicable requirements for:
- Daily loss limits
- Maximum drawdown
- Position sizing
- News trading
- Overnight positions
- Weekend exposure
- Permitted instruments
Programme conditions can change, so traders should review the current rules for their specific Audacity Capital programme rather than relying on an older explanation.
The strongest technical approach is therefore not simply the one that produces attractive charts. It is one that the trader can execute consistently while staying within the conditions of the account.
FAQs
It is a method that traders use to read historical price and volume data and judge if a setup deserves their money, within minutes.
There are several options; there is no one-size-fits-all solution here. A smart trader chooses to combine price action, market structure, and support and resistance with some indicators that fit the trader's unique approach.
The best indicator for day trading really varies based on what a trader is looking to analyze. To track trends, moving averages are good, whereas VWAP offers valuable intraday insights. Similarly, RSI and MACD are suitable for momentum analysis, and ATR is your go-to for measuring volatility.
The ideal timeframes for day trading really depend on the strategy you’re using. Many traders like to start with a higher timeframe to understand the market's broader picture, then switch to a shorter timeframe to fine-tune their entry decisions.
There is no correct number. Every indicator should have a reason for being on the chart. If two tools provide the same information, one may be unnecessary.
Price action and indicators serve different purposes. Price action shows the market's direct movement, while indicators help organise or measure aspects of that movement.
Yes, you can day trade using technical analysis, but none of the analytical methods can remove market risk. What still matters is execution, costs, position sizing, and discipline.
Finding a day trading setup begins with checking the market conditions. From there, you should establish the broader structure and highlight the important levels. Be patient and wait until a clear setup forms. Once that's done, find confirmation, and start setting your entry, stop loss, target, and position size before you start trading.
When we talk about technical analysis, we're referring to the study of market behavior through price patterns and related data. In contrast, fundamental analysis takes a step back to evaluate the economic, financial, and business aspects that can impact a company's worth.

Ready to apply disciplined risk to crypto? Explore Audacity Capital's new crypto instruments and bring your trading strategy.
Learn MoreNewsletter
Join our newsletter to stay up to date on features and releases.
Join Our Social & Community

Start Your Journey Today With Our Free Trial
Proudly showcase your skills and accomplishments through certificates and get recognition for your hard work and dedication from potential investors and peers.
Free TrialRelated Articles
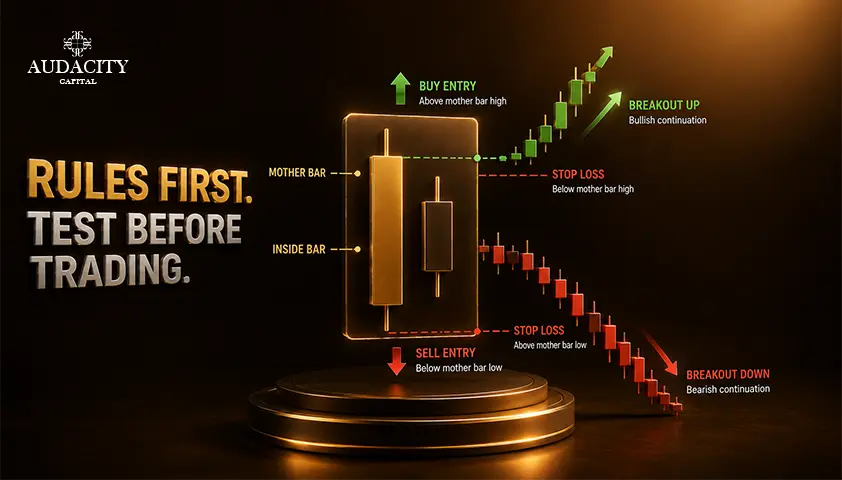
Inside Bar Trading Strategy: Rules, Entries and Backtest Guide
Learn a rule-based inside bar trading strategy. Get the pattern definition, three entry models, stop and target logic, and a backtest framework for your market.

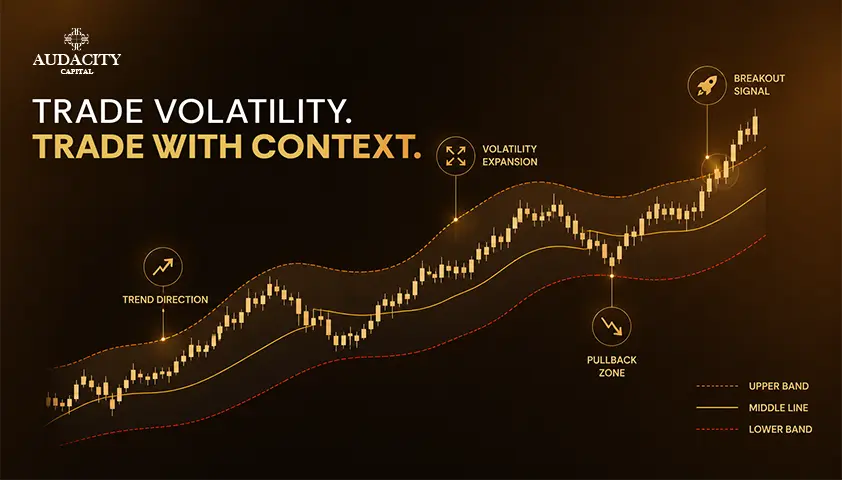
Keltner Channel Trading Strategy: How to Read Volatility With Context
Discover how Keltner Channels measure market volatility, spot trend pullbacks, and confirm breakouts. Includes setup rules, settings, and testing methods.
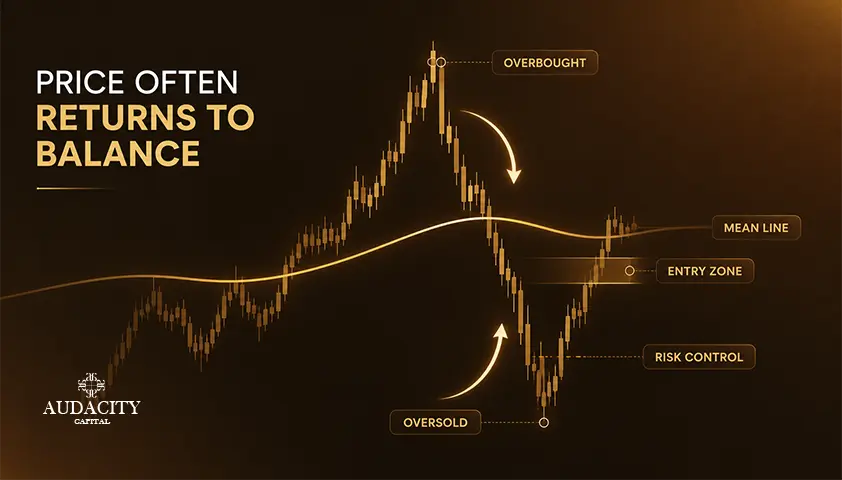
Mean Reversion Trading Strategy Explained (2026)
Prices that stretch too far tend to snap back to an average, but only in the right market. Learn the tools, the setup, and the trend risk.
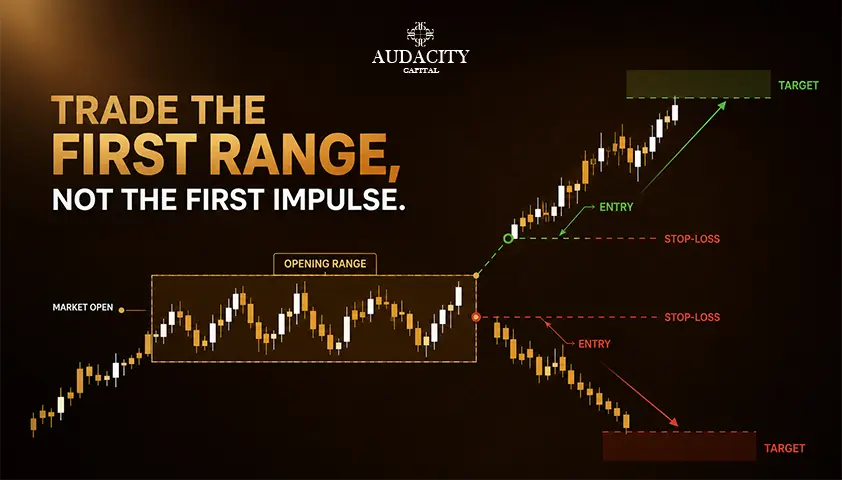
Opening Range Breakout Strategy: Rules, Setups and Examples
Learn how the opening range breakout strategy works, including ORB rules, 5, 15 and 30-minute setups, entry signals, stop losses and risk management.