
Technical Indicators Explained: The Complete Guide to Reading Charts Like a Pro Trader

If you have ever stared at a price chart and wondered what all those squiggly lines, coloured bars, and moving averages actually mean, you are not alone. Technical indicators are among the most misunderstood tools in a trader's arsenal. Most beginners use them blindly. Most intermediate traders use too many. And the best traders? They pick a few that actually work together and stick with them.
This guide breaks down the best types of technical indicators, what they actually measure, and most importantly, how to use them correctly so you are making decisions based on data, not guesswork.
What You Will Learn in This Guide
- The four main categories of technical indicators and what each one measures
- The most popular indicators within each category, explained clearly
- How to combine indicators correctly without cluttering your chart
- Common mistakes traders make with indicators and how to avoid them
- Practical guidance for building a clean, effective indicator setup
What Are Technical Indicators?
Technical indicators are mathematical calculations based on a security's price, volume, or open interest. They are plotted on price charts to help traders identify patterns, potential reversals, trend strength, and entry or exit points.
Unlike fundamental analysis, which looks at a company's financials or economic data, technical analysis is based entirely on what the market is actually doing, not what you think it should be doing.
Read Our guide How to use technical indicators
There are two broad groups: leading indicators and lagging indicators.
Leading Indicators | Lagging Indicators |
Predict future price movement | Confirm movements that have already occurred |
Higher risk, more reactive | Lower risk, slower to signal |
Examples: RSI, Stochastic Oscillator | Examples: Moving Averages, MACD |
Neither is better than the other. The real skill is knowing when to use which type and how to pair them together effectively.
Best Technical Indicators for Trading
Some of the best technical indicators used by traders include moving averages, RSI, MACD, Bollinger Bands, and volume-based indicators like OBV and VWAP. Each of these tools serves a different purpose, from identifying trends to measuring momentum and confirming market strength.
Read More about Best Technical Indicators
Category 1: Trend-Following Indicators
Trend-following indicators, also called trend indicators or directional indicators, help you identify the direction and strength of a trend. They work best in markets that are clearly trending, either up or down.
Moving Averages (MA)
Moving averages are the most widely used indicators in trading. They smooth out price data to reveal the underlying direction of a trend.
Simple Moving Average (SMA)
The SMA calculates the average closing price over a set number of periods. A 50-day SMA, for example, adds up the last 50 closing prices and divides by 50.
How to Use the SMA When price is above the SMA, it signals an uptrend When price is below the SMA, it signals a downtrend A crossover of two SMAs (e.g., 50 and 200) is called a 'Golden Cross' (bullish) or 'Death Cross' (bearish) |
Exponential Moving Average (EMA)
The EMA gives more weight to recent prices, making it faster to react to new information. Popular choices are the 9, 21, and 50-period EMAs.
Best for: Short-to-medium-term traders who want faster signals than the SMA provides.
Average Directional Index (ADX)
The ADX measures the strength of a trend, not its direction. It ranges from 0 to 100. Generally, a reading above 25 suggests a strong trend, while below 20 indicates a weak or ranging market.
Key ADX Levels to Know 0 to 20: Weak trend or no trend (avoid trend-following strategies) 20 to 25: Possible trend developing 25 to 50: Strong trend in place 50+: Very strong trend (rare, often precedes a reversal) |
Ichimoku Cloud
The Ichimoku Cloud is a comprehensive indicator that shows support and resistance levels, trend direction, and momentum all in one view. It is particularly popular in forex and crypto trading.
When price is above the cloud, the trend is bullish. When below, it is bearish. The cloud itself acts as a dynamic zone of support and resistance.
Category 2: Momentum Indicators
Momentum indicators measure the speed of price movement. They tell you not just where the price is going, but how fast it is getting there. They are especially useful for spotting overbought and oversold conditions.
Relative Strength Index (RSI)
The RSI is probably the most popular momentum indicator in retail trading. It oscillates between 0 and 100 and measures the speed and magnitude of recent price changes.
RSI Level | Signal | What It Means |
Above 70 | Overbought | Price may be due for a pullback |
Below 30 | Oversold | Price may be due for a bounce |
50 Level | Neutral | Trend is undecided |
Pro Tip: RSI Divergence Bullish divergence: Price makes a lower low but RSI makes a higher low. Signals a potential reversal upward. Bearish divergence: Price makes a higher high but RSI makes a lower high. Signals a potential reversal downward. Divergence is one of the most powerful signals RSI can give and is often overlooked by beginners. |
MACD (Moving Average Convergence Divergence)
The MACD tracks the relationship between two exponential moving averages (typically 12 and 26-period). It also includes a 9-period signal line and a histogram that shows the difference between the MACD and signal lines.
- MACD crossing above the signal line: Bullish signal
- MACD crossing below the signal line: Bearish signal
- Histogram expanding: Momentum is increasing
- Histogram shrinking: Momentum is weakening
Note: MACD is technically both a momentum and a trend-following indicator, which is part of what makes it so versatile.
Stochastic Oscillator
The Stochastic Oscillator compares a security's closing price to its price range over a set period. Like the RSI, it oscillates between 0 and 100, with readings above 80 considered overbought and below 20 considered oversold.
It is best used alongside a trend-following indicator. In an uptrend, wait for the stochastic to dip into oversold territory before entering long. In a downtrend, wait for it to climb into overbought before entering short.
Category 3: Volatility Indicators
Volatility indicators measure how much and how quickly price is changing. They do not predict direction, but they tell you the size of potential moves and whether the market is quiet or explosive.
Bollinger Bands
Bollinger Bands consist of a middle band (20-period SMA) and two outer bands set two standard deviations away. When the bands are wide, volatility is high. When they are narrow (called a 'squeeze'), a breakout is often imminent.
Bollinger Band Trading Signals Price touching the upper band: Potential resistance, market may be overbought Price touching the lower band: Potential support, market may be oversold Bollinger Squeeze: Low volatility phase, watch for a breakout in either direction Band expansion after a squeeze: Confirms a strong move is underway |
Average True Range (ATR)
The ATR measures market volatility by calculating the average range between the daily high and low over a set period (typically 14 days). It does not give buy or sell signals, but it is incredibly useful for position sizing and placing stop losses.
Example: If the ATR on EUR/USD is 80 pips, placing your stop loss at 20 pips is likely to get you stopped out by normal market noise. A more logical stop might be 1.5x to 2x the ATR.
Keltner Channels
Similar to Bollinger Bands but based on ATR rather than standard deviation, Keltner Channels often stay smoother and are less prone to false signals. When used together with Bollinger Bands, the two can signal momentum breakouts when Bollinger Bands push outside the Keltner Channels.
Category 4: Volume Indicators
Volume indicators analyse how many units of an asset are being traded. Volume is often called the 'fuel' of price movements. A price move on high volume is more significant than the same move on low volume.
On-Balance Volume (OBV)
OBV adds volume on up days and subtracts it on down days, creating a running total. It shows whether volume is flowing into or out of an asset.
- Rising OBV + rising price: Strong uptrend confirmation
- Rising OBV + falling price: Possible reversal ahead (bullish divergence)
- Falling OBV + rising price: Weak rally, possible reversal ahead (bearish divergence)
Volume Weighted Average Price (VWAP)
VWAP calculates the average price weighted by volume throughout a trading session. It is mainly used by intraday traders and institutions as a benchmark.
Price above VWAP: Bullish intraday bias. Price below VWAP: Bearish intraday bias. Many institutional traders will only buy below VWAP or sell above it.
Chaikin Money Flow (CMF)
The CMF measures the flow of money into and out of an asset over a set period. A positive reading suggests buying pressure, while a negative reading suggests selling pressure.
How to Combine Indicators the Right Way
This is where most traders go wrong. They add indicator after indicator until their chart looks like a bowl of spaghetti and every signal contradicts the last.
The golden rule: do not use multiple indicators from the same category. That is redundancy, not confirmation.
The 3-Indicator Framework (Simple and Effective) 1. One trend indicator (e.g., 50 EMA or ADX) to confirm the direction 2. One momentum indicator (e.g., RSI or MACD) to time the entry 3. One volatility or volume indicator (e.g., ATR or OBV) to validate the move |
This gives you three different perspectives on the market without creating conflicting noise. When all three align, your trade has a much stronger case.
Confluence: The Trader's Best Friend
Confluence happens when multiple independent signals point to the same outcome. For example, the RSI is oversold, the price has just bounced off the 200 EMA, and volume is rising. That is three independent reasons to consider a long trade. That is confluence.
The more confluent factors you have, the higher the probability of your trade working out. This does not guarantee success, but it shifts the odds in your favour.
Common Mistakes Traders Make with Indicators
Using Too Many Indicators
More is not better. Cluttering your chart with 8 indicators does not improve accuracy. It creates paralysis. The best traders often trade with just 2 or 3 indicators, or even none at all.
Treating Indicators as Crystal Balls
No indicator is 100% accurate. They are tools, not prophecies. A buy signal from the RSI does not mean the price will rise. It means conditions are in place that have historically favoured a rise. Always use risk management alongside indicators.
Using Default Settings Without Thinking
The default 14-period RSI may work well on a daily chart but be far too slow or fast on a 5-minute chart. Adjust your indicator settings to suit the timeframe and instrument you are trading.
Ignoring Price Action
Indicators are derived from price. Price action, candlestick patterns, and key levels should always take precedence. If the indicator says buy but the price is sitting at a major resistance level, think twice.
Using Indicators in the Wrong Market Conditions
Trend-following indicators like moving averages are terrible in ranging markets. Oscillators like RSI and Stochastic work best when there is no clear trend. Know which environment you are trading in before selecting your tools.
Key Takeaways
- There are four main types of technical indicators: trend-following, momentum, volatility, and volume.
- Leading indicators (like RSI) predict future moves. Lagging indicators (like MAs) confirm what has already happened.
- Never use multiple indicators from the same category. Combine one from each category for a balanced setup.
- Confluence, when multiple indicators agree, dramatically improves trade probability.
- Always adjust indicator settings to your timeframe and market conditions.
- Indicators are decision-support tools, not trade signals. Price action and risk management always come first.
- The ATR is one of the most underrated indicators for stop-loss placement and position sizing.
- RSI divergence is one of the most powerful and commonly overlooked signals in technical analysis.
- A clean chart with 2 to 3 well-chosen indicators will outperform a cluttered chart every time.
Learn, practice, and apply your trading strategy in Audacity Capital's free monthly trading competition.
Frequently Asked Questions
There is no single 'most reliable' indicator. The best indicator depends on market conditions, your trading style, and timeframe. That said, moving averages and the RSI are the most widely tested and respected across all markets. Used together correctly, they form a strong foundation.
Absolutely. Technical indicators were originally developed for equity markets but are widely used across forex, commodities, indices, and crypto. The RSI, MACD, Bollinger Bands, and ATR are all extremely popular in forex trading. Synthetic indices, as traded on platforms like Deriv, also respond well to technical analysis given their continuous 24/7 price action.
A maximum of 3 is the general rule among professional traders. Ideally, pick one from different categories: one trend, one momentum, and one volatility or volume indicator. More than three rarely improves accuracy and usually creates confusion.
Yes, but the settings need to be adjusted for shorter timeframes. The VWAP, EMA, and MACD are particularly popular with day traders. Volume indicators are also crucial since intraday price moves are heavily influenced by real-time buying and selling pressure.
RSI measures the speed and magnitude of price changes to identify overbought and oversold conditions. MACD measures the relationship between two moving averages to identify trend direction and momentum shifts. RSI is an oscillator; MACD is both a momentum and trend tool. Many traders use both together for confirmation.
They work on any market with price and volume data. This includes stocks, forex, crypto, commodities, and even synthetic indices. However, results can vary depending on market liquidity and how the asset is priced. Highly manipulated or illiquid markets may produce more false signals.
Start with the 50-period EMA and the RSI. Together, they give you trend direction and momentum in a clean, easy-to-read setup. Once you are comfortable, add the ATR for position sizing. Avoid complex indicators like Ichimoku or Fibonacci extensions until you have a solid foundation.

Prêt à appliquer un risque discipliné aux cryptos ? Explorez les nouveaux instruments crypto d'Audacity Capital et apportez votre stratégie de trading.
En savoir plusNewsletter
Rejoignez notre newsletter pour rester informé.
Rejoignez Notre Communauté Sociale
Commencez Votre Voyage Aujourd'hui Avec Notre Essai Gratuit
Affichez fièrement vos compétences et réalisations grâce à des certificats et obtenez la reconnaissance de votre travail acharné et de votre dévouement auprès d'investisseurs potentiels et de pairs.
Essai GratuitArticles Connexes
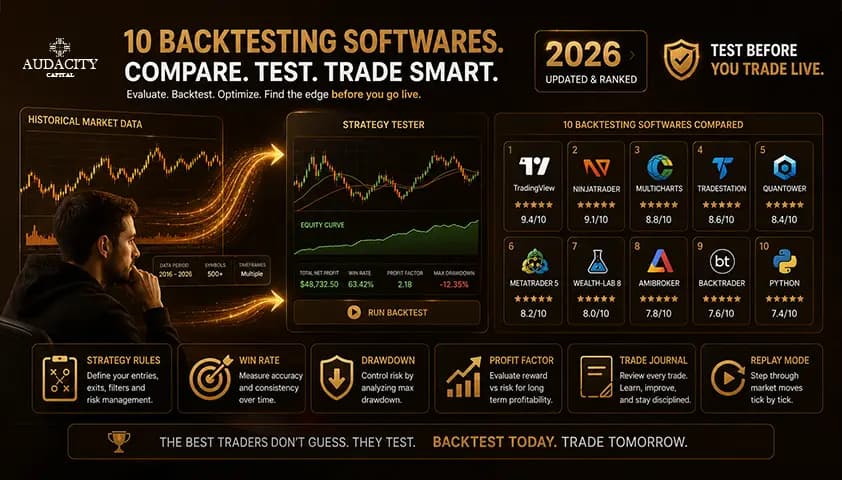
10 Best Software for Backtesting Trading Strategies in 2026
Compare 10 backtesting tools by market coverage, data quality, coding needs, execution modelling and price to find the right testing workflow.

10 Best Prop Trading Firms in India in 2026
Compare the 10 best prop trading firms in India for 2026. Evaluation routes, drawdown rules, payouts, platforms and India-specific checks, with clear RBI and FEMA context.
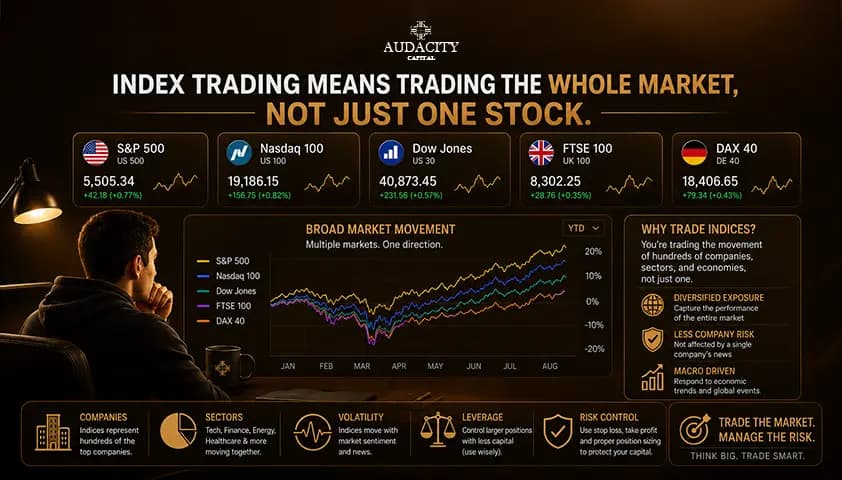
How to Trade Indices: A Beginner's Guide
Learn how to trade indices, choose the right instrument, calculate position size, plan entries and exits, and manage leverage and event risk.
10 Best Leverage Trading Platforms in 2026
Compare 10 leverage trading platforms for forex and CFDs by regulation, markets, fees, risk tools, platform quality and regional access.