


Sortino Ratio in Trading: How It Measures Downside Risk


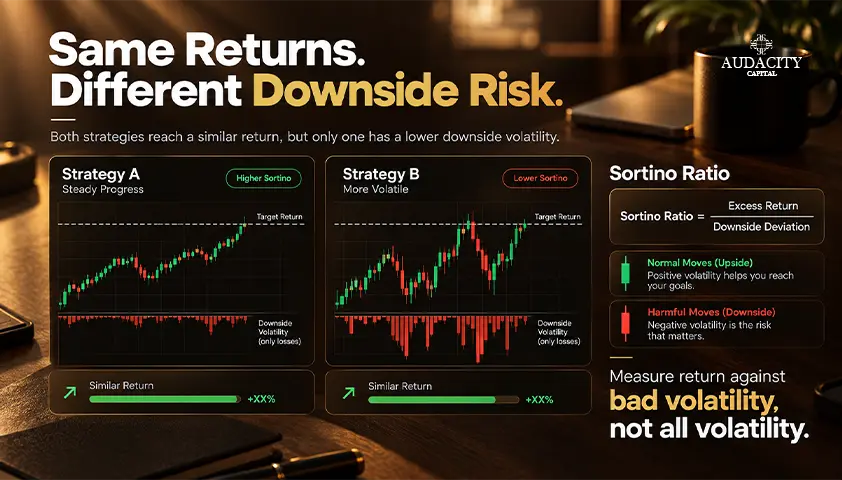
Imagine that there are two methods that yield 18% per annum. One rises steadily and experiences slight drops from time to time. The other generates the same result but has sharp dives under the target level for several months.
Standard deviation can hurt both of them, as well as the positive deviation that does not mean any losses for you. However, the Sortino Ratio works differently and calculates only returns that are lower than your target level.
This article will describe the formula, downside deviation, a worked example, score interpretation, similarities to the Sharpe Ratio, applications in trading, and limitations of the metric.
What Is the Sortino Ratio?
The Sortino Ratio calculates the return earned by a strategy above a particular target divided by downside deviation.
In simple words, it shows how much "positive" return you get against the negative deviation that you take.
The ratio can be used to calculate the return generated from an investment, a portfolio, a fund, or any other trading strategy. The unique thing about this ratio is its focus. It does not penalise all volatility equally.
A sudden jump in the value is not counted as risk since it does not have any effect on your account. It only counts the deviations below your target.
Keep in mind that this ratio should be taken as a relative measure, not a predictor. A Sortino Ratio shows how the returns behaved in a certain time period. It does not predict future performance, and it is not a complete picture of trading risk on its own.
What the Sortino Ratio Measures
The ratio falls into the category of risk-adjusted return measures. The term “risk-adjusted return” implies the same, i.e., that the return is measured in relation to the risk taken to earn it.
The computation uses two factors: downside deviation and Minimum Acceptable Return (MAR). A high positive return is considered not as risky since it worked in your favor.
On the other hand, a negative return below MAR does constitute a risk because it failed to meet your requirements.
Where the Sortino Ratio Is Used
The ratio can be used by analysts for comparison of portfolios, examination of funds, evaluation of trading strategies, and assessment of backtests.
This is one of the many trading performance metrics that distinguish consistent equity gains from those that are irregular.
The comparisons would only be valid if the calculations were done using the same methodology, desired return, and time frame of observation. Two ratios computed using different formulas cannot be compared even if they are flawless.
Sortino Ratio Formula Explained
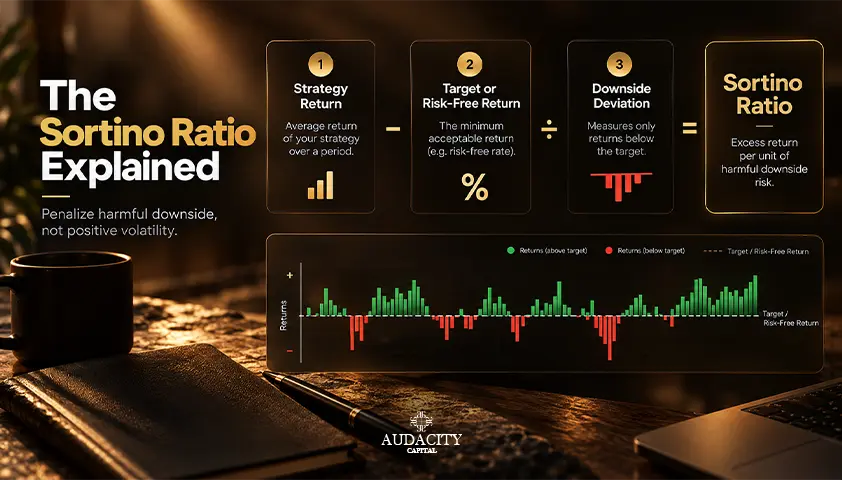
The formula for Sortino ratio itself is quite easy when you know what all the inputs mean:
Sortino Ratio = (Average Return − Minimum Acceptable Return) ÷ Downside Deviation
All values should have the same time base. If you use monthly returns, then your MAR should be calculated on a monthly basis as well. One of the most frequent mistakes in computing the ratio is using the annual MAR together with monthly returns.
If you are applying the formula to a trading strategy, it is important to decide at the start whether you are going to use gross or net returns.
Spreads, commissions, and swaps influence actual returns. Gross return will look better compared to the net one, but it is important to keep the approach consistent.
Average Return
Percentage returns based on equally spaced intervals. In a trading strategy, account returns and equity-curve returns would be much more reliable than profit and loss data.
Equity-curve returns are adjusted by account size and let you compare strategies on the same footing.
Minimum Acceptable Return (MAR)
The MAR is the point you would consider as acceptable. This may be 0%, a target return, risk-free rate, or something else that would satisfy your objectives, the choice is yours.
The MAR and the risk-free rate are not always identical. There are calculations that take the risk-free rate as the goal, but you are allowed to have any other hurdle. Just choose the right MAR according to your needs.
Downside Deviation
Downside deviation estimates the shortfalls that fall below your chosen MAR. Downside deviation is not limited to negative returns. A positive return can also be regarded as downside deviation if it is below the required target.
If you have selected 5% as your MAR and a certain period has brought 3%, the 3% will still be considered a shortfall.
Even if the return is positive, it failed to reach the level you had set and contributes to downside volatility. Just understand this and all the rest will become clear for you.
How to Calculate the Sortino Ratio
In order to understand how to calculate the Sortino ratio, one must do it in a two-stage process. Estimate the downside deviation first, then plug it in the formula. The following figures are purely hypothetical.
How Downside Deviation Is Calculated
The calculation of downside deviation follows a consistent procedure:
- Choose your MAR. Your MAR is your expected return during the time period you choose.
- Compare actual returns with your MAR. Find all periods where actual returns fell short of your MAR.
- Calculate the shortfall. For each period where returns are lower than the MAR, subtract the return from the target to get the difference. Periods at or above the MAR contribute zero.
- Square each shortfall. In this way, you eliminate negative figures and give more importance to bigger deviations.
- Average the squared downside values over all the periods.
- Take the square root of the average value. This gives us our downside deviation.
Note: Not all platforms have the same definition for downside deviation. The divisor can either be the number of downside periods or the total number of periods in general.
Therefore, it is possible that the headlines for the Sortino ratio displayed on two different platforms are not directly comparable, even with the same data.
Worked Sortino Ratio Example
Make things easier with annual values. For example, assume that a strategy delivers an annual average of 18%, you set a MAR of 5% and a downside deviation is 10%.
Plug the numbers in:
(18% − 5%) ÷ 10% = 1.30
Sortino Ratio is 1.30. This means that the strategy generated 1.30 units of returns over your chosen target for each unit of downside deviation. These are sample values used only to demonstrate the calculation and not a performance claim.
Sortino Ratio Calculator: Inputs to Check
Using a Sortino ratio calculator is indeed useful, but only when the inputs used to generate the result are correct. There are five things that must be verified before you rely on any output:
- Frequency of return, and if it corresponds to the MAR basis
- MAR selected, and the reason for selecting it
- Downside-deviation calculation process used by the calculator
- The sample period covered by the data
- If the returns are gross or net of trading costs
A calculator cannot help when the inputs are inconsistent. Feed it mismatched data and it will produce a precise number that means very little.
What Is a Good Sortino Ratio?
One typical query would be, what is a good Sortino ratio? A definitive answer does not exist.
When two investments or trading strategies are analyzed using the same method, then the bigger ratio means better, because that will correspond to more profits for the risk taken.
Do not let yourself believe that any particular value is always "good." The type of strategy, your MAR choice, observation frequency, sample period, and way of calculation of downside deviation will influence that value.
A value which is very good for a short-term intraday strategy can be quite opposite for a long-term swing approach.
How to Read Positive, Zero and Negative Values
The meaning of the sign is straightforward:
- Positive: average profits exceeded your selected MAR.
- Near zero: extremely low profits compared to the downside deviation.
- Negative: average returns were below the MAR target.
Why a Higher Sortino Ratio Is Not Always Better
An elevated ratio does not necessarily mean solid footing, since factors such as small sample size, failure to consider trading expenses, skewed return distributions, inadequate number of downside events, and low number of extreme losses may result in a risk profile.
Always be skeptical about taking any number as a guarantee of safety and profitability of the strategy.
How Traders Use the Sortino Ratio
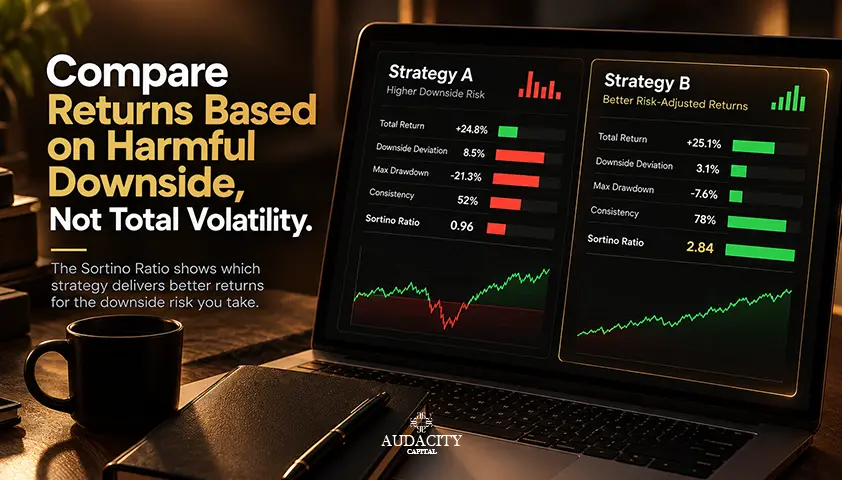
Active traders use the Sortino Ratio as a means of comparison of their strategy variants, backtesting, and live trading results based on the downside-risk criterion.
Employ the net periodic account return whenever possible; this will account for all trading expenses. Compare equal items, and look at the Sortino Ratio in conjunction with drawdown and individual trade metrics, not in isolation.
Compare Trading Strategies
Arrange strategies where there is a similar return goal but they act differently from the downside.
You might discover that the strategy with a lower raw return has superior downside-adjusted return because it spends much less time below the goal line.
This difference is important since you will need to endure the equity curve.
Evaluate Backtests and Strategy Variants
The ratio will be helpful in performing evaluations. Test different entry criteria, stop-loss rules, position sizing, and exit methods using the same MAR and the same testing period. Otherwise, you will lose sense in the comparison.
Where available, compare in-sample, out-of-sample, and live values of Sortino ratio. Such a ratio is much more credible compared to the value from only one backtest.
Use It for Asymmetric Return Profiles
Some strategies produce asymmetric returns: frequent small results punctuated by occasional large winners. Total volatility treats those big positive moves as risk, which can be misleading.
Because the Sortino Ratio only counts movement below your target, it can better reflect the type of downside risk a trader actually cares about in those uneven return patterns.
Limitations of the Sortino Ratio
A precise-looking ratio can still hide important risks.
The Result Depends on the MAR
Change the target and you change which returns count as downside, which changes the whole ratio. Raise the MAR and more periods become shortfalls, pushing the number lower. Lower it and the ratio improves.
Two Sortino Ratios built on different MARs are not directly comparable, so always confirm the target behind each figure.
It Can Understate Tail Risk and Drawdown
A strategy can post a strong Sortino Ratio and still suffer one devastating loss. The metric measures repeated downside deviation around a target, not the depth of a single collapse.
It will not tell you your maximum drawdown, how long recovery took, or how close the account came to a breach. A smooth record with one hidden tail event can look far safer than it is.
The Result Changes With the Data and Method
Observation frequency, sample dates, cost treatment, the denominator convention, and the quality of the return data all shift the reported value.
Short samples are especially unstable. With only a handful of downside periods, a single unusual month can swing the ratio dramatically. The figure describes a measured return series, not future certainty.
Sortino Ratio vs Sharpe Ratio
The core difference is what sits in the denominator. The Sharpe ratio uses total standard deviation, so it treats all volatility as risk, up or down. The Sortino Ratio uses downside deviation below a chosen target, so only harmful movement counts.
That makes Sortino a useful complement when returns are asymmetric, or when you do not want upside volatility treated as risk. Neither metric replaces a proper look at the underlying return distribution or the drawdown record. They summarise; they do not fully explain.
When the Sortino Ratio Adds Useful Context
Consider a trend-following strategy that takes a few big profit-making periods. This large positive deviation period inflates the standard deviation, thereby lowering the Sharpe Ratio, even though the moves were gains, not losses.
In such a case, the Sortino Ratio does not look at the positive swing but rather considers the downward deviations from the target. Therefore it often gives a fairer read on downside-focused performance in that situation.
Sortino Ratio vs Maximum Drawdown
These two metrics address entirely different aspects of the investment process and need to be viewed together.
The Sortino Ratio looks at the returns in respect to recurring downward deviations from a target, while the Maximum Drawdown looks at the largest peak-to-trough drawdown of the equity curve.
One metric will tell you the nature of the downside of the return, while the other metric will tell you what the worst case is.
The strategy might show you a good Sortino ratio but still has a brutal maximum drawdown to test your discipline.
Checklist Before Comparing Sortino Ratios
Before you compare any two figures, confirm:
- Same return frequency
- Same MAR
- Same downside-deviation method
- Same sample dates
- Same gross or net cost treatment
- Same currency or return basis
- A sufficiently long, representative record
For trading strategies, add one more: confirm whether the figure is in-sample, out-of-sample, or live. That context changes how much trust the number deserves.
The Sortino Ratio is a practical way to compare return against downside deviation, but only when the inputs stay consistent.
Always check the MAR and the calculation method behind a figure before acting on it, and pair the result with maximum drawdown, profitability, costs, and other risk measures. No single ratio tells the full story of a strategy's risk.
Frequently Asked Questions
The Sortino Ratio measures the return a strategy earns above a chosen target for each unit of downside deviation. It focuses on harmful downside movement rather than all volatility.
Subtract the Minimum Acceptable Return from the average return, then divide by downside deviation. Keep the returns and the MAR on the same time basis for an accurate result.
Downside deviation measures how far returns fell below your selected MAR. Positive returns can still count if they fall short of the target, so it is not limited to negative returns.
A higher positive value is generally preferable when comparing similar strategies calculated the same way. There is no single universal threshold, because MAR, frequency, and sample all affect it.
Yes. A negative value means the average return fell below your chosen MAR over the measured period. It signals the strategy underperformed its own target.
Not automatically. Short samples, ignored costs, few downside observations, and rare severe losses can inflate the number. Never treat one ratio as proof a strategy is safe or profitable.
MAR refers to the Minimum Acceptable Return, which represents what you would find acceptable. The MAR can either be 0% return, a target return or risk-free rate and it is not automatically the same as the risk-free rate.
Sharpe uses total standard deviation and treats all volatility as risk. Sortino uses the downside deviation below a target, so only harmful movement counts. Sortino ratio is useful especially when returns are asymmetric.
Yes, but remember that output is only as good as the inputs. Verify that you have the correct return frequency, MAR, downside deviation calculation approach, sample period and cost treatment prior to using any figure produced.

क्या आप क्रिप्टो पर अनुशासित जोखिम लागू करने के लिए तैयार हैं? Audacity Capital के नए क्रिप्टो उपकरणों का पता लगाएं और अपनी ट्रेडिंग रणनीति लाएं।
और जानेंन्यूज़लेटर
हमारे न्यूज़लेटर से जुड़ें।
हमारे सामाजिक समुदाय में शामिल हों

आज ही अपनी यात्रा शुरू करें हमारे नि:शुल्क परीक्षण के साथ
प्रमाणपत्रों के माध्यम से अपने कौशल और उपलब्धियों को गर्व से प्रदर्शित करें और संभावित निवेशकों और साथियों से अपनी कड़ी मेहनत और समर्पण के लिए पहचान प्राप्त करें।
नि:शुल्क परीक्षणसंबंधित लेख
Risk of Ruin in Trading: Formula, Examples and How to Reduce It
Learn what risk of ruin in trading means, how the formula works, what affects it, and how position sizing can reduce the chance of account failure.


Profit Factor in Trading: Formula and What Counts as Good
Learn the profit factor formula, calculate it with an example, judge useful ranges, and see why costs, sample size, and drawdown still matter.

How to Use Anchored VWAP in Trading
Learn how Anchored VWAP works, choose meaningful anchor points, read price reactions, compare it with VWAP, and avoid common mistakes.

How to Stress-Test a Trading Strategy With Monte Carlo
Learn how Monte Carlo simulation reshuffles trades, estimates drawdown and losing-streak ranges, and tests a strategy beyond one backtest.