



Golden Cross and Death Cross: A Complete Trading Guide


Introduction
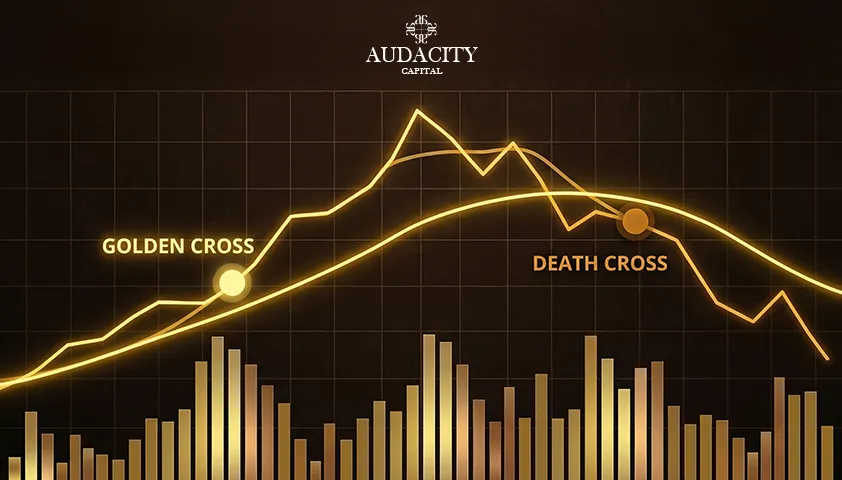
The Golden Cross and Death Cross are two of the most widely used moving average crossover patterns in technical analysis. They help traders identify potential trend reversals, confirm market momentum, and make more informed trading decisions across Forex, stocks, indices, cryptocurrencies, and commodities.
A Golden Cross signals that bullish momentum may be building as a short-term moving average crosses above a long-term moving average. Conversely, a Death Cross suggests bearish momentum as the short-term average falls below the long-term average.
Although these signals are simple to identify, they work best when combined with price action, support and resistance, volume, and sound risk management. In this guide, you'll learn how the Golden Cross and Death Cross work, how to trade them effectively, common mistakes to avoid, and practical tips for improving your results.
Key Takeaways
- The Golden Cross and Death Cross are moving average crossover signals used to identify trend changes.
- A Golden Cross often indicates the beginning of a bullish trend.
- A Death Cross often signals the start of a bearish trend.
- The 50-day and 200-day moving averages are the most commonly used combination.
- Waiting for confirmation helps reduce false trading signals.
- Risk management remains essential when trading any crossover strategy.
What Is a Golden Cross?
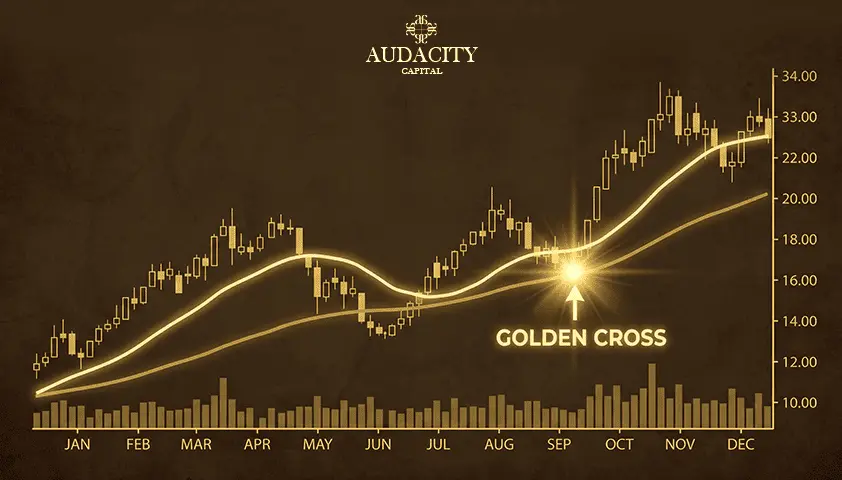
A Golden Cross occurs when a short-term moving average crosses above a longer-term moving average.
The most common setup is:
- 50 Moving Average
- crossing above
- 200 Moving Average
This crossover suggests that buying momentum is increasing and that a longer-term uptrend may be developing.
Many traders use the Golden Cross as confirmation rather than an automatic buy signal.
Characteristics
- Bullish signal
- Higher highs begin forming
- Buying pressure increases
- Often follows prolonged downtrends
What Is a Death Cross?
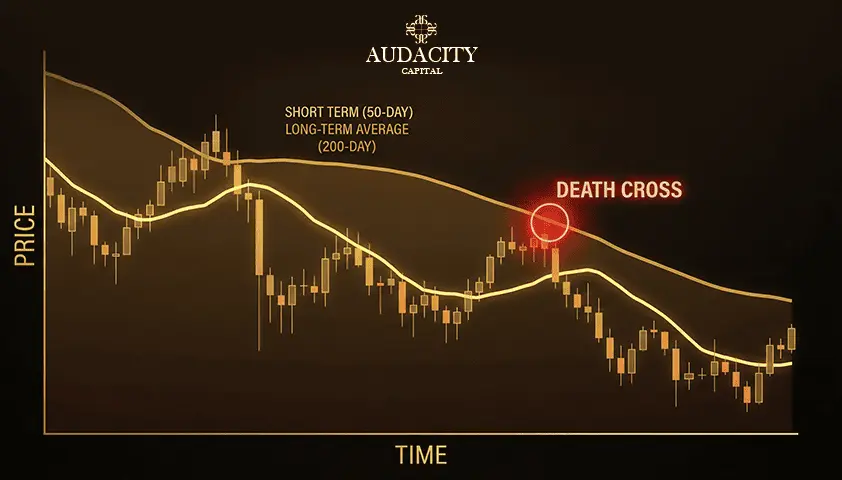
A Death Cross is the opposite pattern.
It forms when the short-term moving average crosses below the longer-term moving average.
Typically:
- 50 Moving Average
- crosses below
- 200 Moving Average
This indicates weakening momentum and the possibility of a developing downtrend.
Characteristics
- Bearish signal
- Lower lows begin forming
- Selling pressure increases
- Often follows extended uptrends
Golden Cross vs Death Cross
Feature | Golden Cross | Death Cross |
|---|---|---|
Signal | Bullish | Bearish |
Direction | Uptrend | Downtrend |
Moving Average | 50 crosses above 200 | 50 crosses below 200 |
Trade Bias | Buy | Sell |
Momentum | Increasing | Weakening |
Why Traders Use the Golden Cross and Death Cross
The Golden Cross and Death Cross remain popular because they:
- Remove emotional decision-making.
- Help identify long-term trends.
- Filter short-term market noise.
- Work across multiple financial markets.
- Can be combined with other technical indicators.
Rather than predicting market reversals, they help traders follow established trends.
Best Moving Averages to Use
Although traders experiment with different settings, the most widely used combinations include:
Short-Term | Long-Term | Best For |
|---|---|---|
20 EMA | 50 EMA | Short-term trading |
50 SMA | 200 SMA | Swing trading |
9 EMA | 21 EMA | Scalping |
100 SMA | 200 SMA | Long-term investing |
How to Trade a Golden Cross
Instead of buying immediately after the crossover:
Step 1
Wait for the crossover to complete.
Step 2
Confirm the trend.
Look for:
- Higher highs
- Higher lows
- Strong momentum candles
Step 3
Wait for a pullback.
Entering after a retracement often provides a better risk-to-reward ratio.
Step 4
Place your stop-loss below the previous swing low.
Step 5
Manage the trade until momentum weakens or a bearish signal appears.
How to Trade a Death Cross
The process is similar.
Wait for:
- Confirmed crossover
- Lower highs
- Lower lows
- Pullback into resistance
Then:
- Enter short
- Place stop-loss above the previous swing high
- Trail profits as the trend develops
Common Mistakes
Many traders lose money because they:
- Buy immediately after every Golden Cross.
- Sell immediately after every Death Cross.
- Ignore market structure.
- Trade during ranging markets.
- Use too many indicators.
- Ignore major news releases.
- Risk too much on a single trade.
Does the Strategy Work in Forex?
Yes.
The Golden Cross and Death Cross work well in Forex because currency markets frequently develop sustained trends.
Popular pairs include:
- EUR/USD
- GBP/USD
- USD/JPY
- AUD/USD
However, false signals become more common during low-volatility or sideways markets.
Advantages
✅ Easy to understand
✅ Beginner friendly
✅ Trend following
✅ Removes emotional trading
✅ Works across multiple markets
Limitations
Like every trading strategy, the Golden Cross and Death Cross have weaknesses.
- Signals are lagging.
- Crossovers occur after the trend has already started.
- False signals appear during sideways markets.
- Confirmation is often required.
For this reason, experienced traders combine crossover signals with support and resistance, market structure, or volume analysis.
Risk Management
Successful traders don't rely solely on crossover signals.
Always:
- Risk only a small percentage of your account.
- Wait for confirmation.
- Avoid chasing price.
- Use predefined stop-losses.
- Follow your trading plan.
Proper risk management is often more important than finding the perfect entry.
How Prop Trading Supports Trend Trading
Trading the Golden Cross and Death Cross requires patience and discipline.
At Audacity Capital, traders operate within structured risk parameters that encourage consistency, capital preservation, and long-term growth. This disciplined environment makes it easier to apply trend-following strategies while maintaining professional risk management.
Conclusion
The Golden Cross and Death Cross remain among the most trusted moving average crossover strategies in technical analysis. While they won't predict every market reversal, they can help traders identify strong trends and improve decision-making when combined with confirmation signals and disciplined risk management.
Rather than chasing every crossover, focus on trading high-quality setups that align with the broader market trend. Over time, consistency and patience will produce better results than reacting to every signal.
FAQs
The Golden Cross and Death Cross are moving average crossover patterns that help traders identify potential bullish and bearish trend changes.
The 50-day and 200-day moving averages are the most widely used for identifying long-term trend changes.
No. The Golden Cross is a bullish signal, but traders should always wait for confirmation before entering a trade.
Yes. Because it is simple and easy to understand, the strategy is suitable for beginners when combined with proper risk management.
Yes. The Golden Cross and Death Cross are commonly used by Forex traders, particularly on higher timeframes where trends are more reliable.

क्या आप क्रिप्टो पर अनुशासित जोखिम लागू करने के लिए तैयार हैं? Audacity Capital के नए क्रिप्टो उपकरणों का पता लगाएं और अपनी ट्रेडिंग रणनीति लाएं।
और जानेंन्यूज़लेटर
हमारे न्यूज़लेटर से जुड़ें।
हमारे सामाजिक समुदाय में शामिल हों

आज ही अपनी यात्रा शुरू करें हमारे नि:शुल्क परीक्षण के साथ
प्रमाणपत्रों के माध्यम से अपने कौशल और उपलब्धियों को गर्व से प्रदर्शित करें और संभावित निवेशकों और साथियों से अपनी कड़ी मेहनत और समर्पण के लिए पहचान प्राप्त करें।
नि:शुल्क परीक्षणसंबंधित लेख

Martingale Strategy in Trading
How the martingale trading strategy works, what the doubling arithmetic actually costs, why position sizing cannot create an edge, and where it is banned.

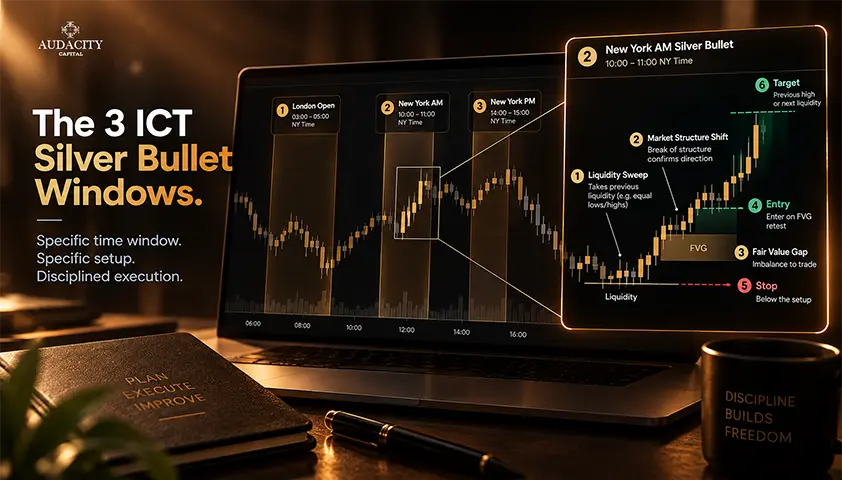
ICT Silver Bullet Strategy: Windows, Setup and Execution Rules
The ICT Silver Bullet windows, the setup step most guides skip, entry and stop rules, and what the published win rates rest on.
Momentum Trading Strategy: A Comprehensive Guide
Master the core principles of a momentum trading strategy. Learn how to use key indicators, manage sharp-reversal risks, and master exit timing.
Keltner Channel Trading Strategy: How to Read Volatility With Context
Discover how Keltner Channels measure market volatility, spot trend pullbacks, and confirm breakouts. Includes setup rules, settings, and testing methods.