


Profit Factor in Trading: Formula and What Counts as Good


A trader wins 70% of trades and still loses money. Another wins only 40% and finishes ahead. What separates them is size: how large all the wins were compared with all the losses.
Profit factor answers that question in one number. This guide covers the formula, a cost-aware example, common ranges for judging the result, and checks to run before you trust it. One note first: profit factor describes a past sample of trades. It does not forecast the next trade.
What Is a Profit Factor in Trading?
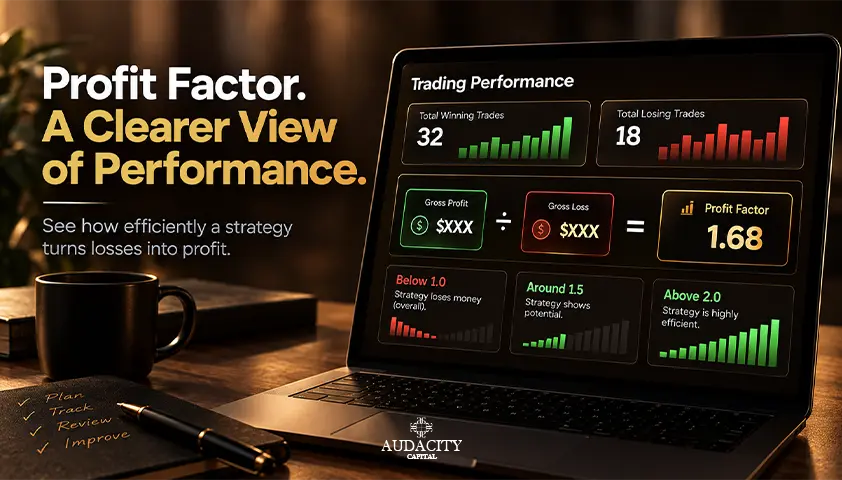
Profit factor in trading is the ratio of total profit from winning closed trades to the absolute total loss from losing closed trades over a defined sample. A result of 1.50 means the sample produced $1.50 of realized winning-trade profit for every $1.00 of realized losing-trade loss.
That 1.50 is not a 50 percent return. It is not a 50 percent win rate, and it is not $1.50 of net profit. In that example, net profit is $0.50 for every $1.00 of gross loss, before any costs the data leaves out.
The metric uses closed trades and realized P&L only. TradingView, for example, excludes profit and loss from open positions. Breakeven trades add nothing to either side of the ratio, although some platforms count them differently in other statistics, such as win rate.
Treat profit factor as a quick summary of trade efficiency across a sample. It is not a full measure of risk, consistency, capital use, or future performance. It works best as the first number you read, not the last.
How to Calculate Profit Factor
The profit factor formula is simple:
Profit Factor = Gross Profit ÷ |Gross Loss|
Gross profit is the sum of all positive closed-trade P&L. Gross loss is the sum of all negative closed-trade P&L, taken as a positive number. Using the absolute value keeps the ratio above zero and easy to read.
Follow these steps:
- Choose a consistent sample: one setup, one market group, one date range.
- Calculate each closed trade's P&L after all transaction costs that are not already reflected, including commissions, spread, and slippage.
- Add up the positive outcomes.
- Add up the negative outcomes as positive numbers, then divide the first total by the second.
An example (hypothetical)
Take eight hypothetical closed trades. Before costs, four winners paid $300, $250, $230, and $200, and four losers cost $200, $150, $120, and $80. Winners total $980 and losers total $550.
Now apply $10 of costs to every trade. Winners shrink to $290, $240, $220, and $190. Losers grow to $210, $160, $130, and $90. In this sample no trade changes sign, but always recheck that. A small winner can turn into a loser once costs are included, so do not subtract one lump sum from the final ratio.
Calculation | Gross trade P&L | After-cost trade P&L |
Sum of positive trades | $980 | $940 |
Absolute sum of negative trades | $550 | $590 |
Profit factor | $980 / $550 = 1.78 | $940 / $590 = 1.59 |
Net P&L | $430 | $350 |
Costs moved the result from 1.78 to 1.59 in a sample of only eight trades. That is why a cost-adjusted figure should always sit next to the headline number.
Spreadsheet option
If your net trade P&L sits in column B, this formula works in Excel or Google Sheets:
=SUMIF(B2:B101,">0")/ABS(SUMIF(B2:B101,"<0"))
Extend the range to cover your full sample. Make sure commissions are not counted twice, once inside the P&L column and again as a separate deduction.
Edge case: no losing trades
If the sample has no losing trades, the denominator is zero. Report the profit factor as undefined for that sample. Gather more observations rather than presenting an infinite value as reliable evidence.
What Is a Good Profit Factor?
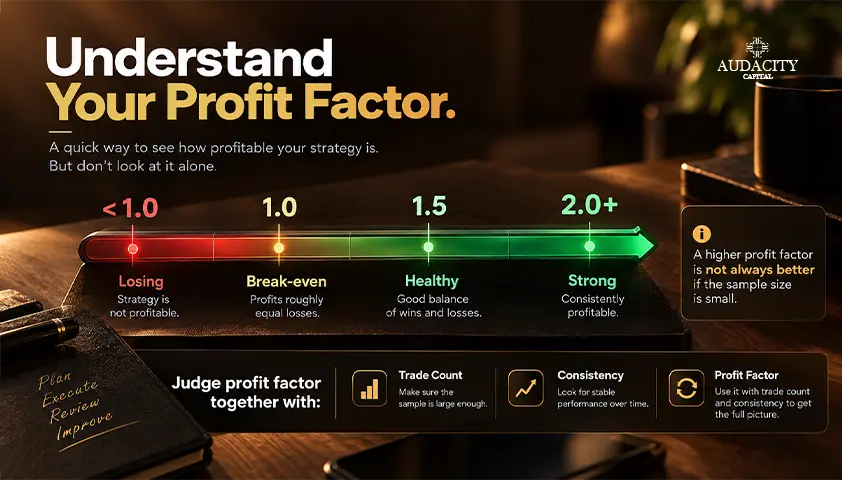
Any value above 1.0 is profitable within the measured sample. A good profit factor needs more than that: a margin that survives realistic costs and testing. No universal cutoff makes a strategy tradable.
The table below is a first-pass screen. It is editorial guidance, not an industry standard or a guarantee.
Profit factor | First-pass reading | Next question |
Below 1.00 | Gross losses exceeded gross profits | Is the setup or execution structurally losing? |
1.00 | Historical breakeven before omitted costs | What happens after spread, commission, slippage, and funding? |
1.01 to 1.19 | Very thin historical edge | Does it survive worse fills and new data? |
1.20 to 1.49 | Potentially usable result | Is it stable across enough independent trades and regimes? |
1.50 to 1.99 | Strong historical result | Are profits broadly distributed rather than concentrated? |
2.00 or higher | Exceptional-looking sample | Have outliers, data errors, selection bias, and overfitting been audited? |
Context matters more than the band. A 1.35 across hundreds of cost-adjusted, out-of-sample trades can be more credible than a 2.50 across 20 optimized trades. Trade frequency, holding period, market, and execution costs all change how much margin a trader needs.
You will see articles that assign fixed targets to scalpers, day traders, or swing traders. Those targets conflict from one source to the next and share no common empirical basis.
A better question than "what is a good profit factor for trading in my style?" is "how many trades support this number, and how was it validated?"
What Drives Profit Factor? Win Rate and Payoff
Profit factor connects directly to win rate and payoff. When outcomes use one consistent unit and weighting convention, the relationship is:
Profit Factor = (Win Rate × Average Win) ÷ (Loss Rate × Average Loss)
Profit factor rises when winners occur more often, average winners grow, losses occur less often, or average losses shrink. The payoff ratio, which is average win divided by average loss, captures the size side of that equation.
If position size varies a lot, compare both dollar results and R-multiples (results measured in units of initial risk), because currency figures can distort the picture.
Comparison example (hypothetical)
Consider two hypothetical 100-trade strategies. Strategy A wins 70 trades at $60 and loses 30 at $150. Strategy B wins 40 trades at $240 and loses 60 at $100.
Sample | Win rate | Average win / loss | Profit factor |
Strategy A | 70% | $60 / $150 | $4,200 / $4,500 = 0.93 |
Strategy B | 40% | $240 / $100 | $9,600 / $6,000 = 1.60 |
Strategy A feels better to trade because it wins most of the time. Strategy B is the one with gross profit ahead of gross loss. This proves only one point: win rate cannot be read alone. The profit factor vs win rate comparison matters because each metric hides what the other shows.
When a High Profit Factor Can Mislead You
Treat this section as a five-check reliability test. A high number is a reason to investigate the sample, not permission to skip validation.
Costs and calculation conventions
Confirm whether P&L already includes commissions, spread, slippage, swaps, funding, borrow fees, and partial fills. Compare reports only when their conventions match. Do not silently mix open trades with closed trades.
Too few or dependent trades
There is no magic minimum trade count. Reliability depends on outcome variance, clustered signals, regime coverage, and independence. Thirty trades taken inside one trend are not the same as thirty trades from thirty different environments. A small sample size makes any ratio fragile.
One or two outsized winners
Remove the largest winning trade and recalculate. Then report the share of gross profit contributed by the top one, five, and ten trades. If the ratio collapses, one outlier was carrying the result.
In-sample optimization
A backtest can show a high profit factor because parameters were tuned on the same in-sample data used to judge them. That is overfitting, and it flatters results. Require untouched out-of-sample data or walk-forward testing, then compare how much the figure degrades. Expect some decline rather than an identical number.
Missing path and capacity information
Profit factor ignores trade order, drawdown, time under water, leverage, capital tied up, and market capacity. Two samples can share a ratio and still produce very different equity curves. If you trade under account rules with a drawdown limit, such as a funded account evaluation, that path information decides whether you stay in the game.
Reliability checklist
Check | Yes / No |
Is the result net of costs? | |
Are there enough varied observations? | |
Does it survive top-winner removal? | |
Does it hold out of sample? | |
Is the drawdown acceptable? | |
Is it stable across relevant market regimes? |
Every "No" is a prompt to investigate, not an automatic rejection.
Profit Factor vs Other Trading Metrics
No single metric is the most important one. Each answers a different question, which is why profit factor needs companions.
Metric | Question answered | Main blind spot |
Profit factor | How large were total wins relative to total losses? | Trade order, drawdown, time, and sample reliability |
Win rate | How often did trades finish positive? | Size of wins and losses |
Payoff or realized reward-to-risk | How large was the average winner relative to the average loser? | How often each outcome occurred |
Expectancy | What was the average result per trade in money or R? | Path, drawdown, and stability of inputs |
What was the worst observed peak-to-trough decline? | Expected return and unseen future losses | |
Sharpe ratio | How much return occurred relative to return volatility? | Tail losses and intuitive trade-level economics |
The profit factor vs expectancy question comes up often because both use the same inputs. Expectancy gives the average result per trade, while profit factor gives a ratio of totals. A sample can be positive on both and still carry a drawdown that no account could tolerate. Read them together, then add maximum drawdown for the pain and Sharpe ratio for the smoothness of returns.
How to Use Profit Factor in a Trading Review

Use this six-step workflow whether you review a trading journal, a platform report, or a backtest:
- Define one setup and one date range.
- Export the closed trades.
- Normalize net P&L so every trade reflects the same cost convention.
- Calculate profit factor and trade count.
- Compare the result with expectancy and drawdown.
- Document a decision and define the next sample.
Segmentation
Break results down only by categories you recorded before the review, such as setup, market, session, direction, or volatility regime. Show profit factor and trade count side by side. Slicing the data repeatedly until one segment looks good creates selection bias.
Rolling view
Track the metric over a fixed rolling window or fixed review periods. A rolling profit factor shows whether the ratio is stable, improving, or deteriorating. It does not explain why by itself.
Decision rule
Use the metric to generate questions, not automatic commands. For a weak segment, check whether the driver is a low win rate, small winners, large losses, or execution costs. For a strong segment, check concentration and whether it holds on new data.
Journal example (hypothetical)
Setup | Date range | Trades | Net profit factor | Expectancy | Max drawdown | Review note |
Breakout, London session | Jan 1 to Mar 31 | 64 | 1.28 | 0.14R | 6.2R | Stable; two losses broke the stop rule |
Pullback, New York session | Jan 1 to Mar 31 | 41 | 0.88 | -0.09R | 7.5R | Winners cut early; review exits |
Range fade | Jan 1 to Mar 31 | 18 | 2.30 | 0.55R | 3.1R | Too few trades; one winner is 40% of gross profit |
The notes matter more than the numbers. The third row looks best and deserves the least trust.
How to Improve Profit Factor Without Overfitting
Improve the underlying trade distribution, not the displayed ratio. Change one rule at a time and reserve untouched data for confirmation.
Four evidence-led levers are worth reviewing:
- Reduce avoidable execution costs. Better order handling and sensible instrument choice can protect the margin without touching the strategy.
- Remove rule violations, not ordinary losing trades. Losses that follow your plan are part of the distribution. Losses that break it are not.
- Review exits. Look for exits that create a few outsized losses or truncate winners.
- Test a predeclared filter across multiple periods and markets, not just the one that inspired it.
One guardrail applies to profit factor in backtesting especially. Do not widen targets, tighten stops, or drop a setup solely because it raises the in-sample number.
Those changes can lower fill quality, reduce trade frequency, or fit noise. After every change, recheck expectancy, drawdown, and out-of-sample performance.
For evidence standards, see our guide to Trading Edge. For test design, see our guide to Backtesting.
Conclusion
The profit factor in trading is gross profit divided by the absolute value of gross loss, and it describes a historical sample, not a forecast.
Evaluate it in order: calculate net closed-trade results consistently, inspect trade count and concentration, compare out of sample, and read the ratio beside expectancy and drawdown.
Profit factor is useful because it is simple, but trustworthy strategy evaluation is never a one-number decision.
Frequently Asked Questions
It should use net trade results after all costs not already reflected in the data. Platforms differ in what their reports include, so check the calculation convention before comparing numbers from two sources or two tools.
No universal number exists. Outcome variance, trade dependence, regime coverage, and profit concentration all matter. Confidence should grow as new and out-of-sample observations confirm the result, not when a trade count crosses an arbitrary line.
Yes. Large average winners can outweigh frequent smaller losses, as the win-rate and payoff relationship shows. A strategy that wins 40 percent of the time can still post a profit factor above 1.0 if its winners are large enough relative to its losers. Always check the size of wins and losses alongside the percentage of winning trades.
A high value is not inherently bad, but an unusually high backtest result deserves scrutiny. Check for a small trade count, outliers, missing costs, data leakage, survivorship bias, and overfitting before treating the number as evidence of a durable edge.

Pronto para aplicar risco disciplinado em cripto? Explore os novos instrumentos de cripto da Audacity Capital e traga sua estratégia de trading.
Saiba MaisNewsletter
Junte-se ao nosso boletim para ficar atualizado.
Junte-se à Nossa Comunidade Social

Comece Sua Jornada Hoje Com Nosso Teste Gratuito
Mostre com orgulho suas habilidades e conquistas através de certificados e obtenha reconhecimento pelo seu trabalho árduo e dedicação de potenciais investidores e colegas.
Teste GratuitoArtigos Relacionados
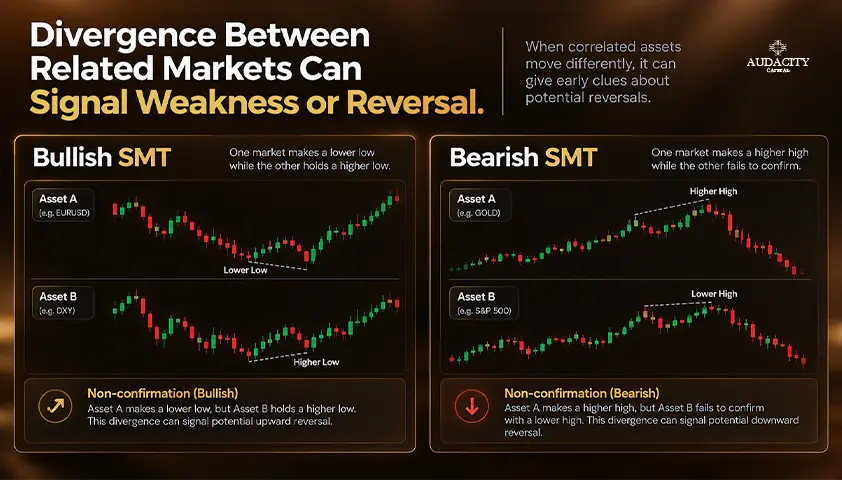
SMT Divergence in Trading: Bullish and Bearish Examples
Learn what SMT divergence means, how bullish and bearish setups form, which markets traders compare, and how to confirm signals and manage risk.


Market Profile Trading: How to Read TPO Charts
Learn Market Profile Trading with TPO charts, value area, POC, initial balance, day types, practical examples, and risk controls.
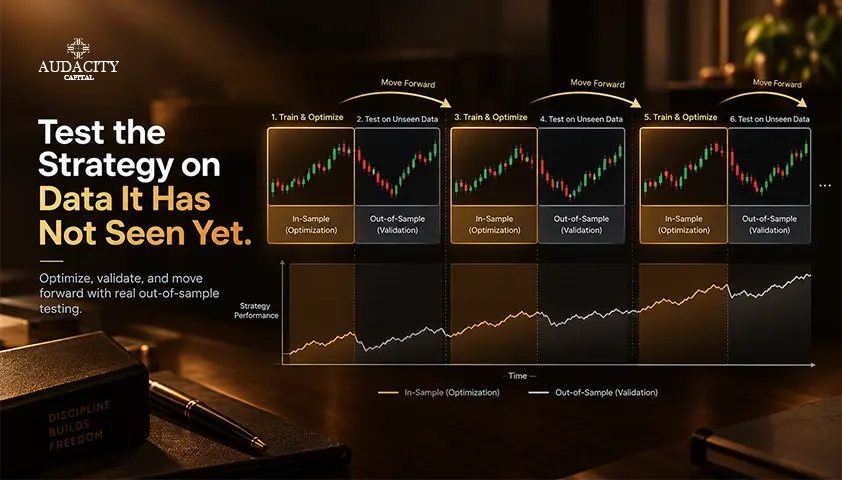
Walk-Forward Analysis in Trading: A Practical Guide
Learn how walk-forward analysis works in trading: in-sample and out-of-sample windows, rolling vs anchored designs, a worked example, and how to read results.
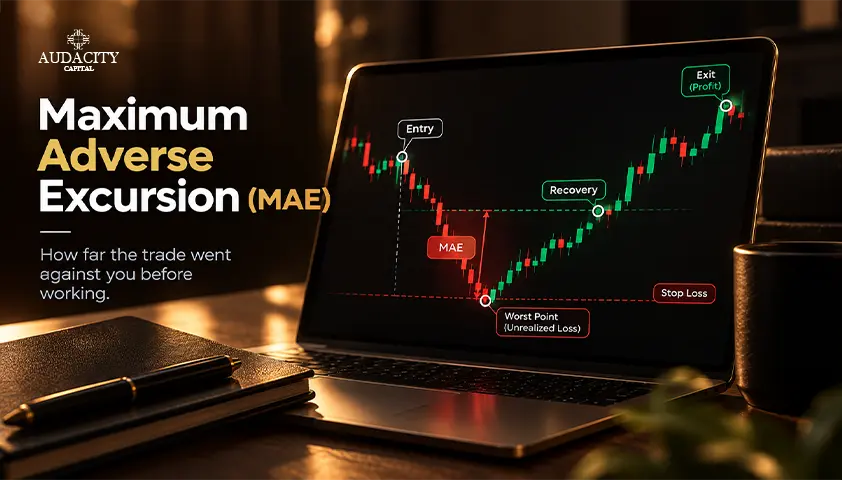
Maximum Adverse Excursion Explained for Traders
Learn how maximum adverse excursion measures a trade's worst open loss, how to calculate MAE, read charts, test stops, and avoid common errors.