


Calmar Ratio: Meaning, Formula and Examples


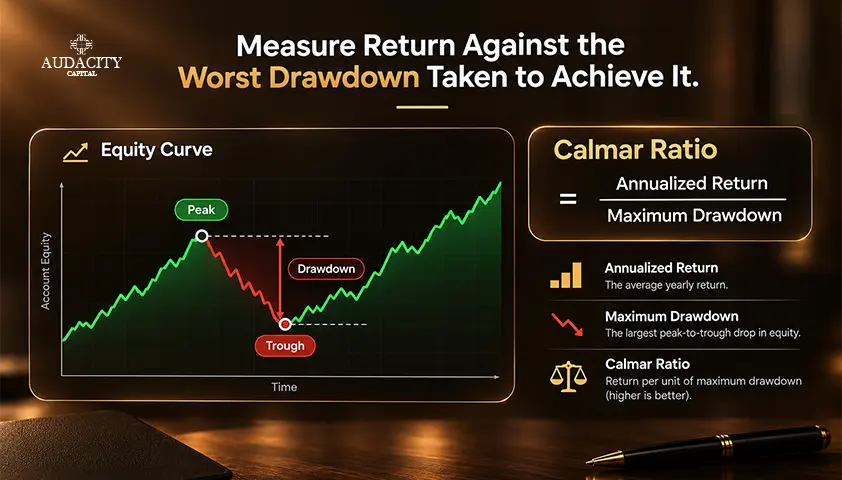
Profit alone can be a poor indicator of trading results. A strategy that brings a 40% profit over a year could also lead to a 30% reduction in account equity within that period of time, and that path is important.
The Calmar Ratio addresses this gap by comparing annualized returns to maximum drawdown, the biggest decline in account equity from the highest point. It provides traders with a single number to assess growth relative to the worst losses.
What Is the Calmar Ratio?
The Calmar Ratio is a risk-adjusted return indicator that divides the annualized return of a strategy by its maximum drawdown. Its definition lies in the balance between two factors: growth earned versus loss endured.
In other words, the ratio measures how much an account increased each year in comparison with the worst peak-to-trough loss over the same period.
Traders searching for what is Calmar Ratio wants to know if the profits were worth the worst losing period.
This is why systematic traders, fund managers and strategy developers rely on it to assess risk-adjusted returns in various methods. The Calmar ratio was invented by Terry W. Young and normally uses a three-year measurement period.
In like-for-like calculations, a higher positive ratio generally indicates a better return compared to the worst drawdown ever recorded.
Calmar Ratio Formula Explained
The Calmar ratio formula is short:
Calmar Ratio = Annualized Return (CAGR) / Maximum Drawdown
The annualized return is calculated by using CAGR (Compound Annual Growth Rate), which is a constant yearly growth rate that will allow the value of your portfolio to grow from its initial value to its final value during a specified period:
CAGR = (Ending Value / Starting Value)^(1/Years) - 1
The maximum drawdown is the largest percentage decrease from the previous equity peak to a later trough in that period of time. You can calculate it by (Peak - Trough) / Peak.
A maximum drawdown is not equal to one losing trade. It can accumulate through consecutive losses.
A very large losing trade may not produce a maximum drawdown at all.
Both measures have to be calculated during the same period of time. Comparing three years' return with five years' drawdown gives you an incomprehensible number.
Traditionally, the Calmar ratio uses a trailing 36-month window, but any period can be used as long as it is specified clearly.
How to Calculate the Calmar Ratio
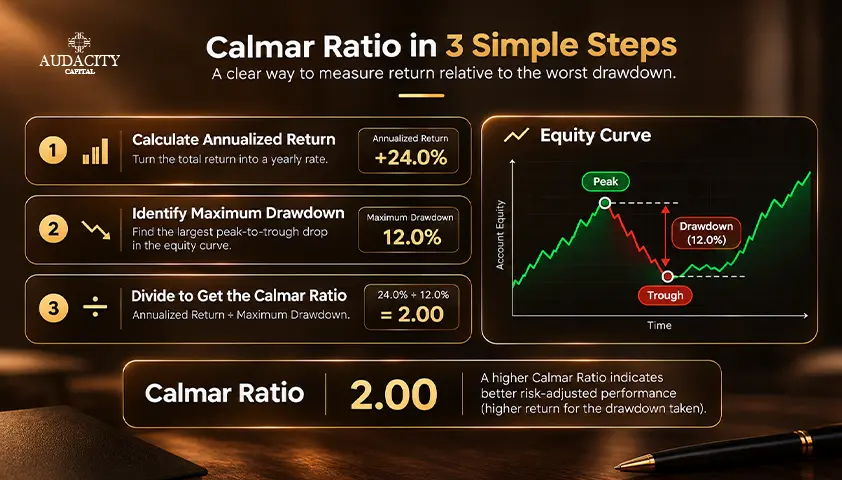
Here is an example of Calmar ratio calculation, built step by step.
Starting capital: $10,000
Capital after three years: $13,310
Maximum drawdown within that period of three years: 20%
- Calculate the growth multiple. $13,310 / $10,000 = 1.331
- Convert to CAGR. 1.331^(1/3) = 1.10, which makes CAGR = 1.10 - 1 = 10%
- Check the drawdown. The largest peak-to-trough drop in the same three years of the equity history was 20%
- Divide. Calmar Ratio = 10% / 20% = 0.50
The 20% figure must be drawn from the equity curve for that same 36-month period. Any drawdown from a different window will distort the comparison.
A ratio of 0.50 indicates that the annualized rate of return was half the size of the maximum drawdown. In other words, for each percentage point of maximum drawdown there was half a percentage point of annual growth.
This figure reflects a hypothetical historical performance. It is not predictive of future performance.
What Is a Good Calmar Ratio?
A higher positive Calmar Ratio is generally considered better, since it denotes higher annualized return relative to the largest past drawdown. The math behind the number is straightforward:
- Below 1: annualized return is lower than maximum drawdown.
- Equals 1: annualized return is equal to maximum drawdown.
- Above 1: annualized return is higher than maximum drawdown.
These ratios reflect the arithmetic, not performance benchmarks for all time and markets. There is no magic number that divides a good strategy from a bad one, because markets, timeframes and trading styles vary.
A negative ratio is obtained in case of negative annualized return. It requires interpretation, because the drawdown remains in the denominator, and the ratio itself does not say anything about the process of losses.
Ratios can be compared only if they are calculated within similar time periods using the same method.
How Traders Use the Calmar Ratio
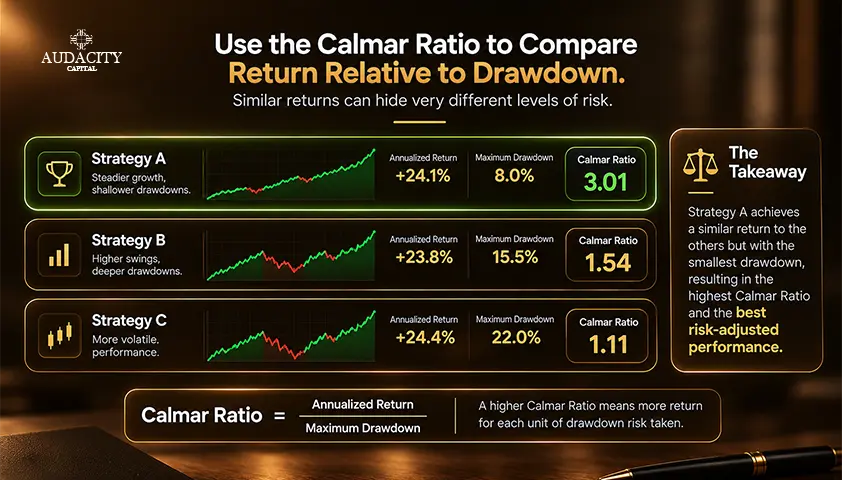
The ratio is useful in performing three specific tasks:
- Comparing trading strategies. A forex strategy with 18% annual return and 30% drawdown will be different from one with 12% annual return and 10% drawdown. The Calmar Ratio standardizes both metrics.
- Judging backtest performance. An appealing backtest with strong returns can conceal huge equity drawdowns. The ratio tells whether such returns had significant drawdowns behind them.
- Risk-adjusted performance tracking. Calculating the ratio on consistent time intervals, such as rolling 36-month intervals, helps identify any changes in a strategy's behavior.
Note one key restriction: the Calmar Ratio is a performance indicator and not a trading signal. It describes what has happened but does not dictate when to buy or sell.
Also note that it differs from the limits attached to a funded account. A historical maximum drawdown is an analytical tool.
Prop traders need to comply with the daily and maximum drawdown limits imposed by their firm separately. Those limits apply to live trading.
Calmar Ratio vs Sharpe Ratio vs Sortino Ratio
The three ratios evaluate risk-adjusted performance, although each evaluates risk in a different way.
Factor | Calmar Ratio | Sharpe Ratio | Sortino Ratio |
Primary risk measure | Maximum drawdown | Standard deviation | Downside deviation |
Focus | Return relative to worst drawdown | Return relative to overall volatility | Return relative to downside volatility |
Typical application | Drawdown-sensitive strategy evaluation | Broad risk-adjusted performance evaluation | Downside-risk-focused evaluation |
Calmar ratio vs Sharpe ratio differs in terms of what is considered risk. Sharpe Ratio views all volatility equally, no matter if it goes up or down.
Calmar Ratio evaluates the biggest drop in value. It allows identifying a significant period of losses which may not be visible due to overall volatility statistics.
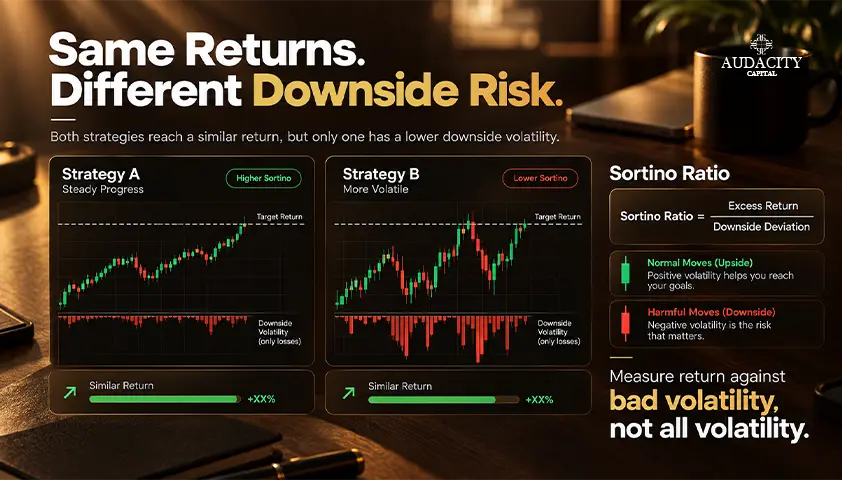
Calmar ratio vs Sortino ratio may differ in results as well. The Sortino Ratio calculates the number of times and distance below target returns occur.
Calmar Ratio evaluates just the worst peak-to-trough drop. A strategy which has many small losses and only one shallow drawdown may have different values for both ratios.
There is no one measure that says it all. Multiple measures provide a better understanding of the trading results.
Limitations of the Calmar Ratio
The measure is very practical, but has obvious limitations:
- Historical data dependence. Maximum historical drawdown doesn’t mean that the future drawdowns will be in the same magnitude.
- Dependence on the measurement period. Changing the measurement period may dramatically affect the ratio due to the possibility of a single poor month being included or excluded from the period.
- Limited drawdown information. The ratio shows the worst drawdown observed, but not its frequency and duration of recovery.
- Differences in calculations. Differences may arise due to the method of calculating return, frequency of equity sampling and handling of the transaction costs.
These are the reasons why the Calmar Ratio needs to be analyzed together with maximum drawdown, Sharpe Ratio, Sortino Ratio and other relevant performance metrics.
Conclusion
Calmar Ratio allows the trader to see how annualized returns relate to the maximum historical drawdown.
It is a useful instrument that makes it possible to compare various trading systems using a common scale. It does not measure all risks, so use it together with other indicators and good judgment prior to drawing any conclusions.
Ready to put disciplined performance tracking to work? Explore the funding paths at Audacity Capital and learn how to trade with company capital under clear rules.
This article is for informational purposes only and is not investment, financial, legal or tax advice. The example above is hypothetical, hypothetical performance does not guarantee actual results, and trading involves risk. Local-law restrictions apply.
Frequently Asked Questions
Yes, but only if they are directly comparable. A larger number based on a different period, data frequency or return calculation technique does not mean a better strategy. Compare similar numbers to draw any conclusions.
Yes. When annualized return is negative, the ratio turns negative. Because drawdown sits in the denominator, a negative value needs careful reading and should be reviewed alongside the underlying return and drawdown figures.
The traditional convention uses a trailing 36-month window, which gives a meaningful sample of returns and drawdowns.
Other periods can be used when the window is clearly disclosed. However, a ratio should only be compared with others that use the same one.
Yes. Forex traders can apply it to backtests or live trading records to see how annualized return compares with drawdown exposure. It describes past performance, so it should support a wider strategy review rather than replace one.

Готовы применить дисциплинированный риск к криптовалютам? Изучите новые криптоинструменты Audacity Capital и примените свою торговую стратегию.
Узнать большеРассылка
Подпишитесь на нашу рассылку.
Присоединяйтесь к нашему сообществу

Начните свое путешествие сегодня с нашей бесплатной пробной версией
С гордостью демонстрируйте свои навыки и достижения с помощью сертификатов и получайте признание за свой тяжелый труд и преданность делу от потенциальных инвесторов и коллег.
Бесплатная пробная версияПохожие статьи

Stochastic Oscillator
Learn how to use the stochastic oscillator in trading, interpret overbought and oversold levels, spot crossovers, and adjust settings.


Swap in Trading: What It Is, How It Is Calculated and How It Affects Your Positions
Learn what a swap in trading is, how overnight fees are calculated, when triple swaps apply, and how swap costs affect forex and CFD positions.

Maximum Favorable Excursion: How MFE and MAE Read a Trade
Learn how Maximum Favorable Excursion and MAE reveal a trade's best and worst open moves, exit giveback, and possible entry or exit problems.
Sortino Ratio in Trading: How It Measures Downside Risk
Learn what the Sortino Ratio means, how to calculate it using downside deviation, and how traders use it to compare risk-adjusted performance.