



How to Use Fibonacci Retracement in Forex Trading (And Actually Make It Work)


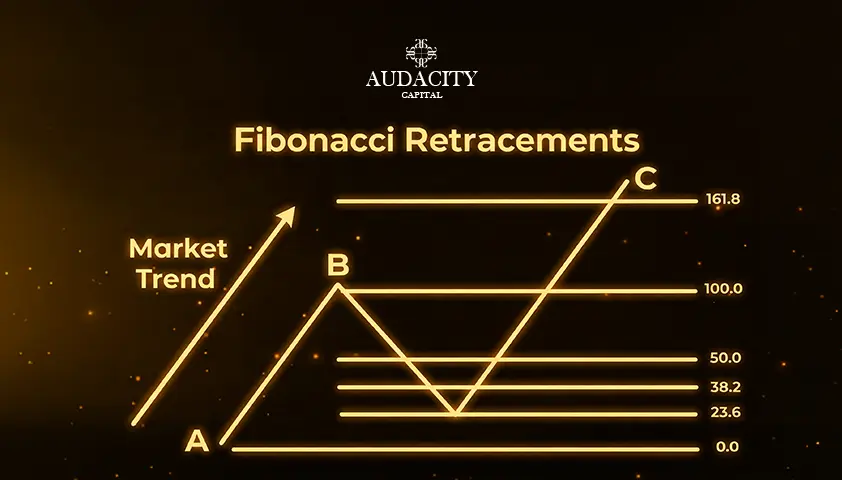
Most traders have heard of Fibonacci. Some have tried it. Fewer actually use it well.
The problem isn't the tool. It's that most traders are taught to treat Fibonacci levels like magic lines as if price will automatically bounce the moment it touches 61.8%. That's not how it works.
In this guide, we're breaking down exactly what Fibonacci retracement is, how to draw it correctly, and more importantly how to build it into a trading approach that actually holds up under pressure.
What Is Fibonacci Retracement?
Fibonacci retracement is a technical analysis tool that uses horizontal lines to identify potential support and resistance levels based on the Fibonacci sequence — a mathematical concept that appears throughout nature, architecture, and financial markets.
The key levels traders watch are:
- 23.6%
- 38.2%
- 50% (not technically a Fibonacci number, but widely used)
- 61.8% ( the "golden ratio," considered the most significant)
- 78.6%
The idea is straightforward: after a strong price move (either up or down), price rarely continues in the same direction without pulling back first. Fibonacci levels help you anticipate where that pullback might stall before the trend resumes.
Fibonacci retracement is only one part of the broader Fibonacci trading framework. Traders also use Fibonacci extensions, fans, arcs, and time zones to identify profit targets, trend strength, and potential reversal areas. To understand how all Fibonacci tools work together, read our complete guide to Fibonacci in Forex Trading.
Where Does the Fibonacci Sequence Come From?
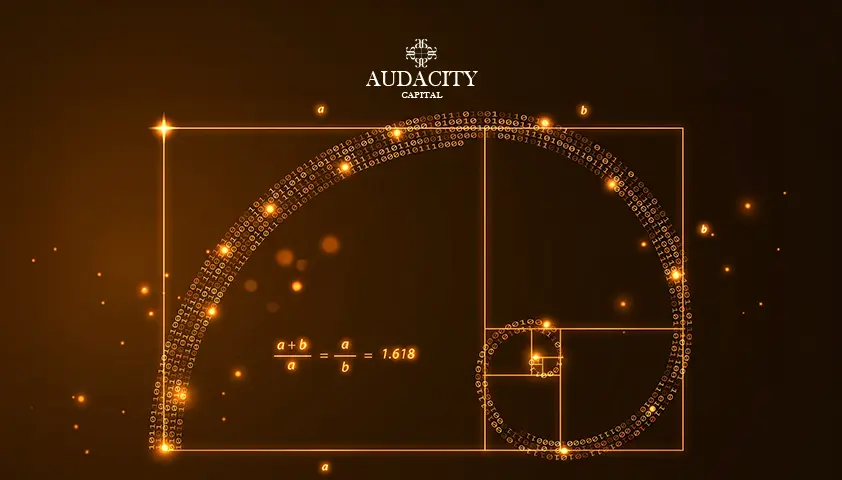
The sequence was popularised in the West by the Italian mathematician Leonardo Fibonacci in the 13th century. It works like this: each number is the sum of the two before it.
0, 1, 1, 2, 3, 5, 8, 13, 21, 34, 55, 89, 144…
The ratios between these numbers produce the Fibonacci percentages traders use. Specifically:
- Divide any number by the one that follows it and you get approximately 0.618 (61.8%)
- Divide any number by the one two places ahead and you get approximately 0.382 (38.2%)
These ratios appear repeatedly in financial markets not because markets are mystical, but because they reflect human psychology and the natural rhythm of crowd behaviour.
How to Draw Fibonacci Retracement Correctly
This is where most traders go wrong. If you draw the tool on the wrong swing, you'll get misleading levels.
Step 1: Identify a clear swing. Look for a strong, well-defined price move with an obvious swing high and swing low. The move should be clean not choppy.
Step 2: Draw from the base of the move to the top.
- In an uptrend: draw from the swing low to the swing high
- In a downtrend: draw from the swing high to the swing low
Step 3: Let the levels appear. Your charting platform will automatically plot the retracement levels between the two points.
Step 4: Look for price reaction at the levels. Wait for price to pull back into one of the key levels and watch how it behaves when it gets there. You're not entering because price touched a level. You're entering because price showed a reaction at that level.
The Most Important Fibonacci Levels for Forex Traders
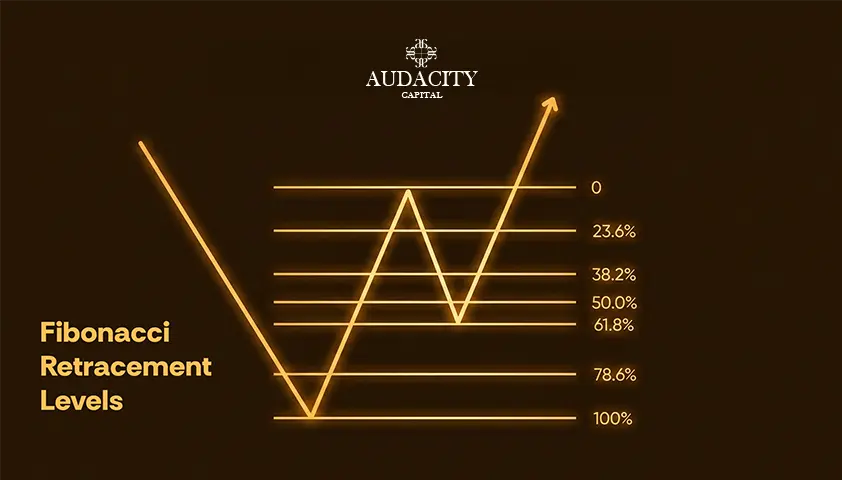
61.8% (The Golden Ratio)
This is the level that gets the most respect. When a currency pair pulls back to the 61.8% level of a prior move and shows a rejection, it's one of the cleaner high-probability setups in technical trading. Many institutions and algorithmic systems treat this level as significant, which is part of why it tends to hold.
38.2% (The Shallow Retracement)
Strong trends often don't retrace deeply. A 38.2% pullback suggests the market is in a powerful move and buyers (or sellers) are eager to re-enter early. If your bias is with a strong trend, this is the level to watch.
50% (The Middle Ground)
Not a true Fibonacci ratio, but it's used widely because price frequently finds equilibrium at the midpoint of a previous move. Think of it as a psychological checkpoint.
78.6% (The Deep Retracement)
The 78.6% level is the last significant support before a swing structure breaks. Some traders avoid it because a retracement that deep suggests the move is weakening. Others see it as an opportunity to enter with a tight stop just below the swing point.
How to Use Fibonacci Retracement in a Real Trade Setup
Fibonacci alone is not a trading strategy. It's a tool. Here's how to use it as part of a structured approach:
Combine with trend direction
Draw Fibonacci in the direction of the prevailing trend. If the market is in an uptrend, wait for a pullback into a Fibonacci level and look for signs that buyers are returning. Don't try to use retracement levels to trade against a strong trend.
Combine with price action signals
A Fibonacci level becomes much more meaningful when price action confirms the reaction. Look for:
- Bullish or bearish engulfing candles
- Pin bars / hammer formations
- Inside bars at the level
- Strong wicks rejecting the level
Price action confirmation tells you that something actually happened at that level — not just that price passed through it.
Combine with structure
The best Fibonacci setups occur where a retracement level aligns with a structural support or resistance zone a previous swing high or low, a round number, a moving average. When multiple factors line up at the same area, the probability of a reaction increases.
Define your invalidation point before entry
Before you enter, know exactly where you're wrong. If you're trading a bounce off the 61.8% level in an uptrend, your stop typically goes below the swing low that anchors the Fibonacci drawing. If price closes below that level, the setup is invalid. Respect it.
Common Fibonacci Mistakes (And How to Avoid Them)
Mistake 1: Drawing Fibonacci on every small move. Fibonacci works best on clean, significant swings. Not every minor fluctuation on a 5-minute chart deserves a retracement drawing. Use it on meaningful moves.
Mistake 2: Entering just because price touched a level. Price touching 61.8% means nothing on its own. What matters is how price behaves when it gets there. Wait for confirmation.
Mistake 3: Ignoring the higher timeframe. A 38.2% retracement on a 15-minute chart might fall right into a major resistance zone on the daily chart. Always check the bigger picture before committing to a level.
Mistake 4: Using Fibonacci as a standalone system. No single tool is a complete strategy. Fibonacci works when it's part of a structured approach with clear risk management, defined entries, and consistent execution.
Mistake 5: Moving your stop because price is near a "strong" level. This is how accounts blow up slowly. Your stop is your stop. If the level breaks, it breaks.
Fibonacci Extensions: Beyond the Retracement
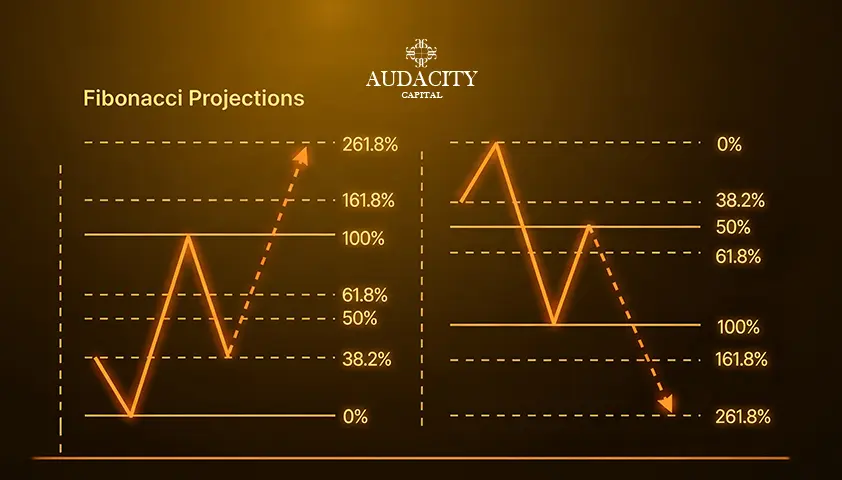
Once you understand retracements, Fibonacci extensions help you project where price might go after the pullback ends.
The common extension levels are 127.2%, 161.8%, and 261.8% drawn beyond the original move to suggest potential take-profit targets.
If you enter at the 61.8% retracement and the prior move was 200 pips, the 161.8% extension gives you a projected target of around 323 pips beyond the swing low (or high). This lets you set realistic targets based on the structure of the move, rather than arbitrary numbers.
Putting It All Together: A Simple Fibonacci Workflow
Here's a practical framework to apply everything above:
- Identify the trend on the higher timeframe (daily or 4-hour)
- Find a recent clean swing in the direction of that trend
- Draw Fibonacci from the swing base to the swing top (uptrend) or top to base (downtrend)
- Mark the key levels, 38.2%, 50%, 61.8%, 78.6%
- Wait for price to pull back into one of these zones
- Look for confirmation, price action signal, structural confluence, or both
- Define your entry, stop, and target before placing the trade
- Execute and manage according to your plan and not your emotions
Key Takeaways
- Fibonacci retracement identifies potential support and resistance zones based on mathematical ratios derived from the Fibonacci sequence
- The most significant level is 61.8% (the golden ratio) the one most respected by institutions and algorithms
- Drawing the tool correctly matters more than most traders realise always anchor it to a clean, significant swing high and low
- Fibonacci levels are not signals on their own; they become meaningful when combined with price action confirmation, trend direction, and structural confluence
- The 38.2% level signals a strong trend; the 78.6% level is the last line before a swing structure breaks
- Fibonacci extensions (127.2%, 161.8%, 261.8%) can be used to project realistic take-profit targets after a retracement entry
- The five most common Fibonacci mistakes all come down to the same root cause: treating the tool as a signal rather than a framework
- Consistent profitability with Fibonacci comes from patience, confirmation, and strict stop discipline not from memorising levels
Final Thoughts
Fibonacci retracement isn't a magic system. But it's one of the most useful technical tools available when applied with discipline and combined with proper risk management.
The traders who actually profit from it are not the ones who draw levels on every chart. They're the ones who wait patiently for price to come to a key zone, confirm before entering, and respect their stops without exception.
That kind of discipline doesn't come from the tool. It comes from you.
Frequently Asked Questions
The 61.8% level (the golden ratio) is widely considered the most reliable. It's the level that institutions and algorithmic systems most commonly reference, which is part of why it tends to produce cleaner reactions. That said, the "best" level depends on the strength of the trend — in a very strong trend, the 38.2% level often holds without price needing to reach 61.8%.
Yes, but not in isolation. Fibonacci retracement is a high-probability tool when combined with trend analysis, price action confirmation, and structural confluence. Used on its own, it produces too many false signals to be consistently profitable.
Fibonacci is effective across all timeframes, but the higher the timeframe, the more significant the levels. Levels drawn on the daily or 4-hour chart carry more weight than those drawn on a 5-minute chart. Many traders use the higher timeframe to identify key Fibonacci zones and then drop to a lower timeframe to time their entries.
Fibonacci retracement identifies potential entry zones during a pullback within a trend. Fibonacci extensions project where price might move after the retracement ends, they're used to set take-profit targets. Both are drawn using the same swing high and swing low, but extensions go beyond the 100% level of the original move.
Use the most recent, clean, well-defined swing that aligns with your trading timeframe. The move should be clear and impulsive, not a choppy, sideways range. In an uptrend, draw from the most recent significant swing low to the swing high. Avoid anchoring your Fibonacci to minor fluctuations.
Technically yes, but it's less reliable on very short timeframes (1-minute, 5-minute) because price moves tend to be more noise than signal. Fibonacci is most effective when applied to timeframes where genuine market structure is visible, typically 15 minutes and above.
Always combine it. On its own, Fibonacci simply draws lines. It has no predictive power without context. The most common and effective combinations are Fibonacci with moving averages, RSI divergence, or candlestick price action signals at key levels.
Because no tool works 100% of the time. Fibonacci levels fail when market conditions shift significantly; news events, sudden liquidity grabs, or trend reversals can all cause price to blow through a Fibonacci zone without reacting. This is why stop placement and risk management are non-negotiable.

Готовы применить дисциплинированный риск к криптовалютам? Изучите новые криптоинструменты Audacity Capital и примените свою торговую стратегию.
Узнать большеРассылка
Подпишитесь на нашу рассылку.
Присоединяйтесь к нашему сообществу

Начните свое путешествие сегодня с нашей бесплатной пробной версией
С гордостью демонстрируйте свои навыки и достижения с помощью сертификатов и получайте признание за свой тяжелый труд и преданность делу от потенциальных инвесторов и коллег.
Бесплатная пробная версияПохожие статьи
7 Best Forex Trading Indicators in 2026 & How to Use Them
Explore 7 forex trading indicators, including moving averages, RSI, MACD, and Bollinger Bands. Learn how they work and how to use them.

What Is Forex Trading Volume?
Learn what trading volume means in Forex trading, how it’s measured, and how traders use volume to confirm trends and price movements.

The Skills Traders Must Master To Survive The Next Market Cycle
Fibonacci in Forex Trading: How to Use Fibonacci Levels Like a Pro in 2026 ?
Learn how traders use Fibonacci in forex trading, including retracements, extensions, fans, arcs, time zones, and proven trading strategies.