


Sharpe Ratio: Formula, Calculation, Uses and Limitations


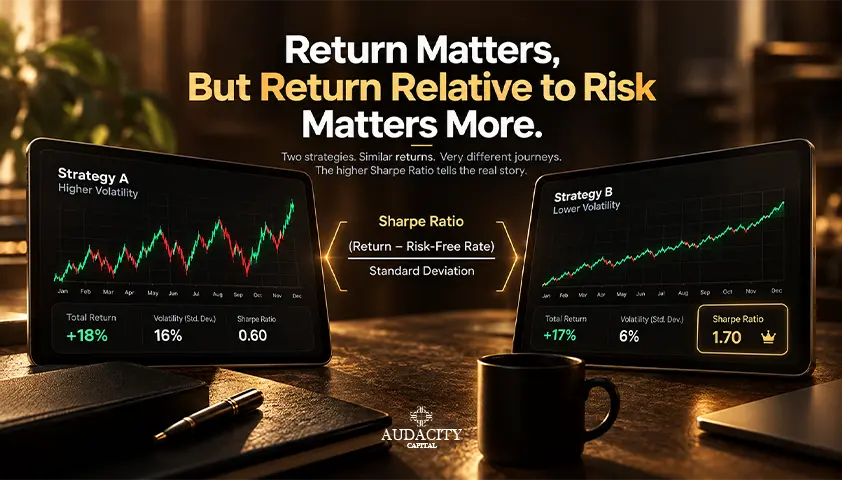
A 10% annual return tells you how far an investment travelled, not how rough the journey was. Imagine two portfolios that have both ended the year 10% higher, with one getting a small bump up nearly every month and the other swinging wildly between highs and lows.
They are parted by the Sharpe ratio which compares excess return against the volatility that is required to achieve that return.
This guide provides an overview of the formula and demonstrates a calculation with an example. It also provides insight into how to interpret the score, how to apply it in investing and trading and its limitations.
What Is the Sharpe Ratio?
Sharpe ratio indicates the amount of excess return for every unit of return variance.
In other words, it is an indicator of the performance of an asset compared to a certain base return. The ratio compares excess return to the level of variance of returns on investment.
It may be used to evaluate performance of individual investment, fund, portfolio or trading strategy. That is the reason why it is used in investment factsheet, portfolio report or strategy backtest.
This is a metric for comparison. This metric tells us about how the return series performed during a certain period of time. It does not predict future performance and it is not a complete risk measurement tool. Consider it a perspective on the risk adjusted return.
What the Sharpe Ratio Measures
The ratio is determined by three inputs:
- Excess Return: this is the return achieved beyond a certain base, which can be a risk-free rate or any other chosen benchmark.
- Risk-free/benchmark return: the return that an investor would get from an investment with negligible risk, normally measured through the interest rate on a short-term government bill.
- Standard Deviation: it is a statistical measure of how spread out are the returns around the mean.
Standard deviation does not distinguish between upside and downside risks equally. In other words, a very good return will affect the standard deviation as much as an extremely poor return.
Where the Sharpe Ratio Is Used
The most common uses are for fund selection, portfolio analysis, manager comparison, and strategy assessment. Comparisons can be done meaningfully only under the condition of identical methodology and observation period.
Two numerical values calculated differently can be similar yet measure different values.
Sharpe Ratio Formula Explained
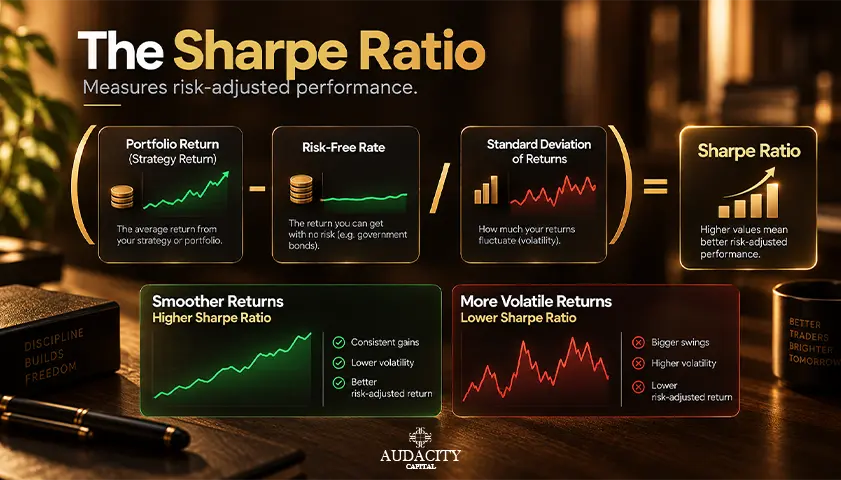
The formula for the standard Sharpe ratio is:
Sharpe ratio = (Average return - Risk-free return) / Standard deviation of returns
Or, in symbols: S = (Rp - Rf) / σp
Where:
- Rp is the average return of the portfolio, investment or strategy during each period.
- Rf is the risk-free rate or the benchmark return for the same time period.
- Rp - Rf is the average excess return.
- σp is the standard deviation of returns during the same time intervals.
The important part is to keep a regular frequency of returns. If you are using monthly returns, use a monthly benchmark return as well.
Compute the standard deviation of the same monthly returns. One of the most frequent mistakes in any Sharpe ratio calculation is to combine daily, monthly and annual performance.
You also must choose whether the returns are gross or net of costs. Gross returns do not include spreads, financing charges, and fees.
They are accounted for in net returns. The net return is more representative for those who are evaluating what an investor or trader retained on their books. Either way, make sure you make your point clear.
Portfolio or Investment Return
Use percentage returns from equal time periods, such as each month or each trading day. If you're using a trading strategy, employ the same account returns or equity-curve returns.
Do not use raw figures of profit or loss. The same $500 winnings are not the same on a $10,000 account compared to a $100,000 account. The percentage return helps to compare the two results.
Risk-Free Rate or Benchmark Return
A common measure is a Treasury bill rate, provided that it is the same currency and time series as the return series. If a strategy is measured in euros, then a euro-denominated rate should be used.
Do not deduct an annual rate from a monthly or daily return. Convert it first. For example, a yearly rate of 2.4% is approximately 0.2% per month.
Standard Deviation of Returns
The standard deviation measures the spread of a series of periodic returns from the average. In the formula, it represents volatility.
It does not account for all types of investment or trading risks, including market volatility, short-term lows, leverage risk and the length of a losing streak.
How to Calculate the Sharpe Ratio
Let's look at a step by step example of calculating the Sharpe ratio, for a hypothetical series of 12 monthly returns. All figures are based on assumptions and are for illustrative purposes only.
Hypothetical monthly returns:
Month | Return |
Jan | 2.0% |
Feb | -2.0% |
Mar | 4.0% |
Apr | 0.0% |
May | 2.0% |
Jun | 0.0% |
Jul | -2.0% |
Aug | 2.0% |
Sep | 4.0% |
Oct | 0.0% |
Nov | 2.0% |
Dec | 0.0% |
Step 1: Average return. The 12 returns sum to 12.0%. The average monthly return is 1.0% when divided by 12.
Step 2: Matching risk-free return. Use an annual risk-free rate of 2.4% which is approximately 0.2% per month.
Step 3: Average excess return. 1.0% subtracted by 0.2% equals 0.8% per month.
Step 4: Standard deviation. Subtract the average of 1.0% from each month, square the result, and add all of them up. The sum is 44 percentage-points.
Using the sample standard deviation calculation, 44 is divided by 11, the total number of observations minus 1. The result is 4, which when squared root results to a standard deviation of 2.0%.
Standard Deviation of Excess Returns = 2.0%, since the risk-free rate is constant.
Using the population convention (dividing by 12), the standard deviation is approximately 1.91%. It just goes to show how much using the other method affects the final result.
Worked Sharpe Ratio Example
Substituting the values into the formula:
Monthly Sharpe ratio = 0.8% / 2.0% = 0.40
In this Sharpe ratio example, this hypothetical portfolio had an excess monthly return of 0.40 for each unit of monthly volatility.
How to Annualize the Sharpe Ratio
When comparing a monthly and an annual value, remember that the two are not identical and many reports translate the monthly result to a yearly one.
The common shortcut is to simply multiply the period Sharpe ratio by the square root of the number of periods per year:
Annualized Sharpe ratio = 0.40 x √12 = 0.40 x 3.464 ≈ 1.39
In general, the multiplier is the square root of approximately 252 trading days for daily data. For weekly data, it is the square root of 52.
This square-root-of-time rule assumes that the return process is reasonably stable. It also makes the assumption that returns in one period are approximately independent of returns in the previous period.
It can be misleading if returns are autocorrelated, when pricing is infrequent, or with a small sample size. In those situations, the annualized data may seem more accurate and more positive than the actual data itself.
What Is a Good Sharpe Ratio?
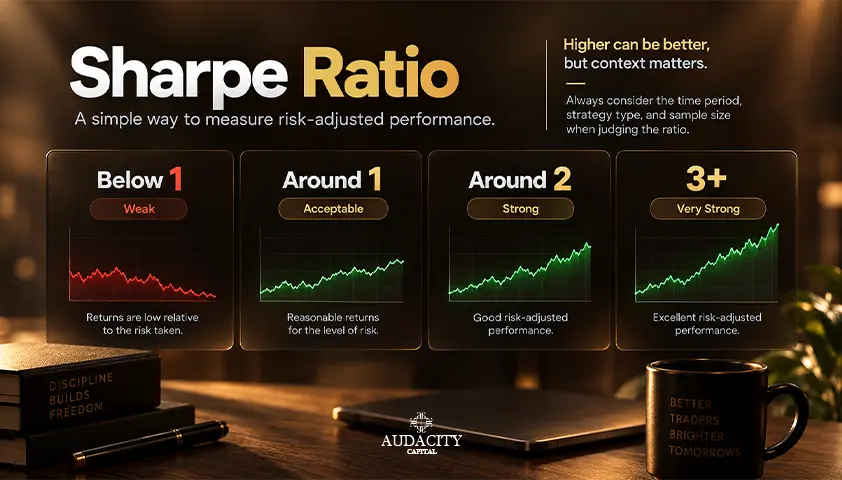
For readers who ask "what is a good Sharpe ratio", they typically look for a single rule. There are some common ranges, but none of them is a rule of general application:
- Below 0: the average return was less than the risk-free return or benchmark.
- 0 to 1: positive excess returns, but low compared to volatility.
- 1 to 2: generally considered adequate.
- 2 to 3: often regarded as very good.
- Above 3: usually excellent but always make sure to look at the data and method of calculation.
A value exceeding 1 every year is generally considered to be a positive rating. The more important question is how the outcome compares to other investments or strategies. Make sure they use the same calculation method and cover a suitable period.
A Sharpe of 0.8 could be good for one asset class and bad for another. Context is more important than any single cut-off.
How to Read Positive, Zero and Negative Values
The positive number means that the investment made gains above and beyond the chosen benchmark during the period in question.
If there is a zero score, it means that the investment did not make any excess returns.
There might be a case of negative Sharpe ratio where the average return of the investment is below the chosen risk-free rate or benchmark during the same period.
The investment may have made a positive gain but the investor did not outperform the baseline. The investor in both the negative cases suffered from volatility without getting rewarded for it over that period.
Why a Higher Sharpe Ratio Is Not Always Better
A high Sharpe ratio may be real or may be fabricated or enhanced by the following:
- Brief samples that fail to cover challenging market situations.
- Smoothed returns on less-frequently priced assets.
- Ignored costs such as commissions, spreads, and fees.
- Use the leveraging effects that overcome weak positioning.
- Extreme events that have not been observed in the data.
There is no one threshold that indicates a safe investment or strategy. Don't halt your questioning because of the number.
How Investors and Traders Use the Sharpe Ratio
The ratio is useful for investors to compare like funds and to evaluate portfolio adjustments. It also enables them to assess returns and volatility.
A new asset can contribute to returns being slightly lower but significantly less volatile. This can help to enhance the overall risk-return balance. The Sharpe ratio is one way to demonstrate that change.
For traders, it provides a framework to evaluate a trading strategy. Use net periodic account returns for a more realistic assessment. Next compare the backtest, out-of-sample and live Sharpe ratios if available.
When there is a notable disparity between the returns from the backtest compared to live trading, this could mean that there is overfitting, cost omission, or changes in market conditions.
The Sharpe ratio is just a reviewing tool. It cannot be a buy or sell signal and should never be used to make trade-related decisions.
Compare Investments and Portfolios
Comparing like with like: Same objectives, same currency, same benchmarks, sample period and frequency of returns.
In those circumstances, the ratio can indicate the time intervals during which a lower-return portfolio will earn a higher return commensurate with the level of measured volatility. It is possible for the headline returns to overlook this distinction.
Evaluate a Trading Strategy
The Sharpe ratio works best in trading when it is not the only number that has to be looked at in a single headline.
A rolling Sharpe ratio measures a performance over a certain period of time, like 6 or 12 months, and helps understand whether the performance is consistent or just a product of one fortunate period.
Breaking down the analysis by different market regimes (trending, ranging, volatile and non-volatile) gives more clarity.
Prior to accepting any backtest results, compare the ratio to maximum drawdown, win rate, average wins and losses and number of trades.
For a funded account and prop firm evaluation, drawdown is as important for a trader as his/her return consistency. Even having a high Sharpe ratio, violation of drawdown will result in termination of the account.
Limitations of the Sharpe Ratio
The Sharpe ratio is precise in form but sensitive to its inputs and assumptions. Several weaknesses deserve attention. The ratio treats standard deviation as a summary of risk. This works best when returns are roughly normally distributed.
Many real return series are not. Options-selling strategies, carry trades, and some trend-following approaches show skewed or fat-tailed returns that standard deviation does not describe well.
Serial correlation is another issue. When one period's return tends to follow the previous one, measured volatility can understate risk. This can also overstate the annualized Sharpe ratio.
Data smoothing, common in assets with infrequent valuations, produces a similar effect.
Lookback selection and estimation error matter too. A three-year window that happens to exclude a market shock can produce a very different value from one that includes it.
Short records also carry substantial statistical uncertainty. As a result, two strategies with Sharpe ratios of 1.2 and 1.5 may not differ meaningfully.
Finally, ignored trading costs can turn a strong-looking gross ratio into a weak net one, especially for high-frequency strategies.
Above all, the ratio describes a historical or assumed return series. It does not offer certainty about the future.
It Treats Upside and Downside Volatility the Same
Most investors do not view an unusually large gain as the same kind of risk as an unusually large loss. Yet both increase standard deviation and reduce the Sharpe ratio equally.
A strategy with occasional strong upside months can be penalized for outcomes that most people would welcome.
It Can Miss Tail Risk and Maximum Drawdown
Picture a hypothetical strategy that earns small, steady gains for 30 months, then suffers one severe loss. Before that loss, its return series looks smooth and its Sharpe ratio looks attractive.
This is classic tail risk: rare, damaging events that a short or calm sample can hide entirely. The ratio also says nothing about loss depth, recovery time, or the risk of breaching account limits.
The Result Changes With the Data and Method
The same strategy can produce different Sharpe ratios depending on several factors.
These include observation frequency, sample dates, the risk-free rate, cost treatment, the standard deviation method, and annualization. Changing just one of these inputs, as the worked example showed, can shift the result.
Sharpe Ratio vs Sortino Ratio
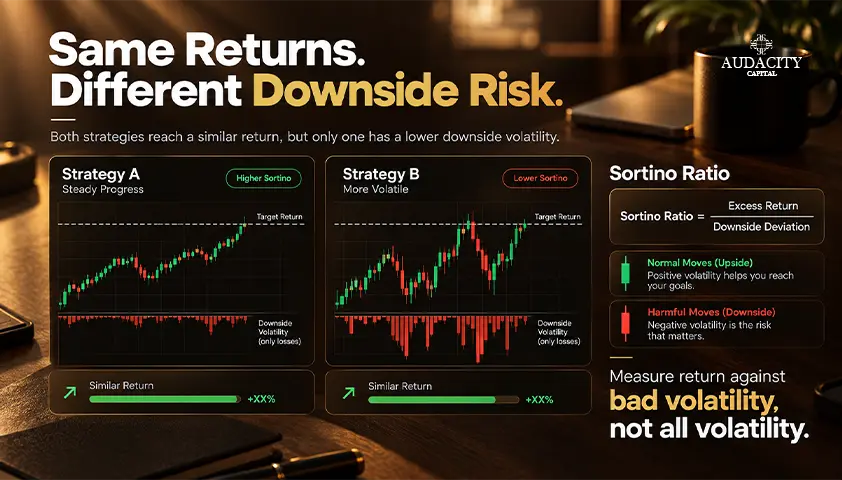
The Sharpe ratio uses total return variability, counting both upside and downside movement. The Sortino ratio also measures excess return.
However, it replaces standard deviation with downside deviation. This measures returns that fall below a chosen target, such as zero or the risk-free rate.
That makes Sortino especially helpful when returns are asymmetric. If a strategy's volatility comes mostly from large gains rather than losses, Sortino will usually reflect that more fairly.
Neither ratio provides a complete picture of risk. Both are summary measures. You should also review maximum drawdown and the return distribution, including the size and frequency of the worst losses.
When the Sortino Ratio Adds Useful Context
Consider two hypothetical strategies with the same average return. Strategy A produces frequent large positive months, which raise its standard deviation and lower its Sharpe.
Strategy B has smaller swings in both directions.
On Sharpe alone, B looks stronger. On Sortino, A may look better because its volatility is mostly upside. Reading Sharpe, Sortino, and maximum drawdown together gives a more balanced view.
Checklist Before Comparing Sharpe Ratios
Before placing two reported values side by side, confirm that they share:
- The same return frequency: daily, weekly, or monthly.
- The same benchmark method: the same risk-free rate or benchmark return.
- The same currency: returns and benchmark in a matching currency.
- The same sample dates: identical or closely aligned periods.
- The same annualization method: the same multiplier and assumptions.
- The same cost treatment: both gross or both net of costs.
- A sufficiently long, representative record: enough data to include varied market conditions.
For trading strategies, add one more check: is the figure from a backtest, an out-of-sample test, or live trading? Those three sources should never be treated as equivalent.
Confirm the Inputs and Comparison Basis
Check the inputs and calculation methods before comparing headline values. If a platform, fund, or report does not state its method, treat any comparison as provisional rather than conclusive.
Conclusion
The Sharpe ratio helps compare excess returns with variability across investments, portfolios, and trading strategies. Its usefulness depends on consistent inputs and a suitable calculation method. Pair it with downside measures such as the Sortino ratio and maximum drawdown for a fuller view of risk.
Frequently Asked Questions
The Sharpe ratio measures average excess return earned for each unit of return variability. It helps compare risk-adjusted performance across investments, portfolios, and trading strategies, but it does not forecast future results.
Subtract the matching risk-free or benchmark return from the average periodic return, then divide by the standard deviation of returns. Keep every input on the same return frequency, as the worked example shows.
An annualized value above 1 is often viewed favorably, and 2 to 3 is often regarded as very good. These are conventions, so compare against similar strategies measured by the same method.
A negative Sharpe ratio means the investment's average return fell below the chosen risk-free rate or benchmark during the measured period. The investment may still have earned a positive absolute return, but it did not outperform the baseline.
No. A high value can be inflated by short samples, smoothed returns, ignored costs, leverage, or rare large losses that have not yet appeared. Treat it as a reason to investigate further.
Multiply the period Sharpe ratio by the square root of the number of periods per year, such as √12 for monthly data. This shortcut can mislead with autocorrelated, smoothed, or short samples.
A short-term government bill rate is a common proxy. It should match the currency and period of your returns, so convert an annual rate before subtracting it from monthly or daily returns.
Neither is universally better. Sharpe uses total volatility, while Sortino focuses on downside deviation, which can be fairer for asymmetric returns. Read both alongside maximum drawdown for a fuller risk picture.

Готовы применить дисциплинированный риск к криптовалютам? Изучите новые криптоинструменты Audacity Capital и примените свою торговую стратегию.
Узнать большеРассылка
Подпишитесь на нашу рассылку.
Присоединяйтесь к нашему сообществу

Начните свое путешествие сегодня с нашей бесплатной пробной версией
С гордостью демонстрируйте свои навыки и достижения с помощью сертификатов и получайте признание за свой тяжелый труд и преданность делу от потенциальных инвесторов и коллег.
Бесплатная пробная версияПохожие статьи
How to Use Anchored VWAP in Trading
Learn how Anchored VWAP works, choose meaningful anchor points, read price reactions, compare it with VWAP, and avoid common mistakes.

Sortino Ratio in Trading: How It Measures Downside Risk
Learn what the Sortino Ratio means, how to calculate it using downside deviation, and how traders use it to compare risk-adjusted performance.

Maximum Favorable Excursion: How MFE and MAE Read a Trade
Learn how Maximum Favorable Excursion and MAE reveal a trade's best and worst open moves, exit giveback, and possible entry or exit problems.

Profit Factor in Trading: Formula and What Counts as Good
Learn the profit factor formula, calculate it with an example, judge useful ranges, and see why costs, sample size, and drawdown still matter.