


Average True Range: A Complete Guide for Traders


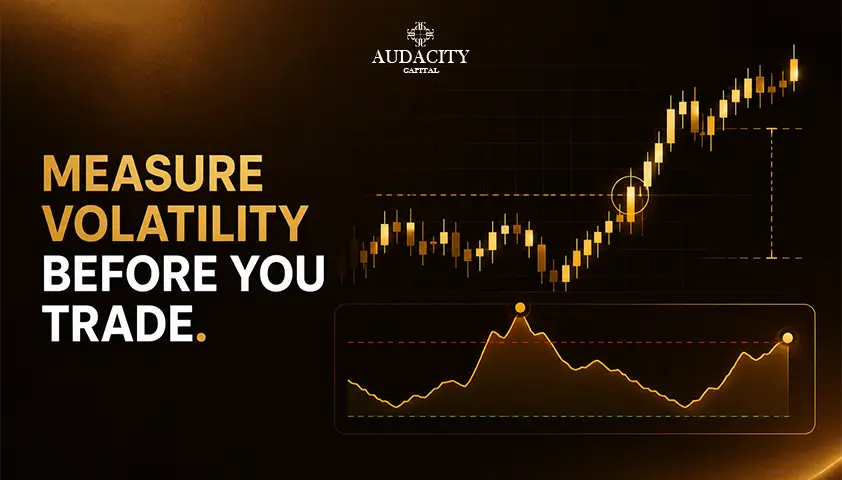
Average true range (ATR) measures how much an asset has been moving over a selected number of bars, including gaps between periods. It is a volatility measure, in the same units as price, so it is directly applicable for stops and sizing.
The important thing to remember about Average True Range is that it measures volatility and not the direction of movement.
If ATR is rising, it does not mean that price is moving up. Similarly, a declining ATR does not mean that price is falling. It simply measures how much the price moves.
This guide will explain how to interpret ATR, when to use ATR% over the actual number, and how traders can leverage it for stops, position sizing, and trailing exits.
What Is Average True Range (ATR)?
ATR is the smoothed average of the true range over a given lookback period. The difference of True Range from the usual high-low range is that the former takes into account gaps and jumps between the bars, which occur at night when the market is closed.
The unit is the same as the price of the instrument. If the daily ATR for a stock is $2.40, then the daily true range in the past period has averaged $2.40 using the current lookback and smoothing methodology.
This is a statement about the size of the recent movement, not a prediction. Price is not "expected" to rise or fall by $2.40 tomorrow.
This concept was first introduced by J. Welles Wilder Jr. in 1978 in New Concepts in Technical Trading Systems, and is one of the most popular volatility indicators used in today’s trading platforms.
How Is ATR Calculated? The ATR Formula
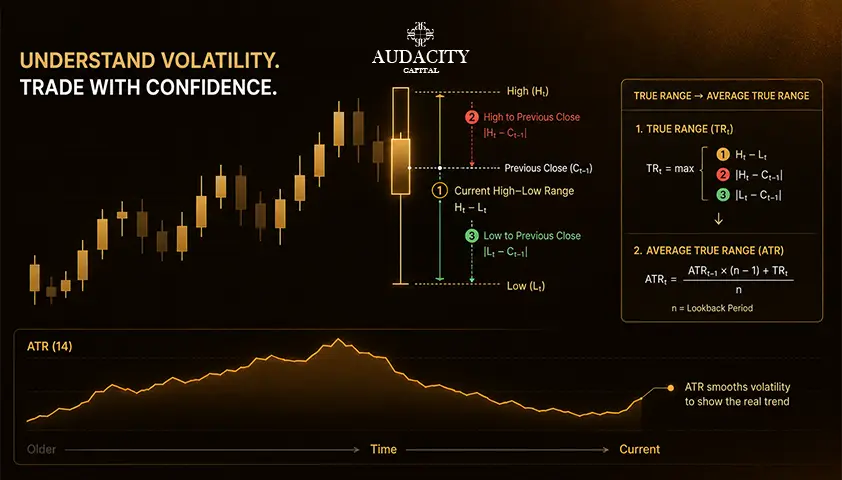
The ATR formula starts by computing the true range for each bar. True range is the greatest of three values:
- Current high minus current low
- The absolute value of current high minus previous close
- The absolute value of current low minus previous close
ATR then averages these true-range values over the selected lookback period, typically 14 periods, using Wilder's smoothing method. Wilder's method is a recursive calculation of the exponential type and NOT just a simple moving average, although other platforms offer SMA or EMA options that will give you a slightly different number.
For example, suppose there are three hypothetical daily bars over a stock:
- Day 1: High 102, Low 100, Close 101
- Day 2: Gaps up. High 106, Low 104, Close 105. Previous close 101, so true range is max(106 - 104, |106 - 101|, |104 - 101|) = 5.
- Day 3: High 107, Low 103, Close 104. Previous close 105, so true range is max(107 - 103, |107 - 105|, |103 - 105|) = 4.
Notice how the true range on Day 2 of 5 is greater than the intraday range of 2 because of the gap which occurs during the night session. The regular "high-low" wouldn't capture this move at all.
How to Read ATR Correctly?
The higher the ATR, the bigger the price range in recent periods; the lower the ATR, the narrower the price range in recent periods. The absolute value level has meaning in context of the same instrument, same time frame and similar prices only.
ATR can increase during a strong rally or a sharp selloff, but it can also decrease when markets are trending sideways or slowly.
The main point is that its slope is not a standalone trading advice, but rather an indication of the volatility conditions.
The time frame of calculation is as important as the value itself. 14-period ATR on a 5-minute chart gives us the volatility measure of the intraday movements during several hours.
14-period ATR on a daily chart shows us price dynamics for about 2-3 weeks. Both measurements cannot be compared even for the same instrument.
ATR vs ATR%: How to Compare Volatility Across Assets
The raw ATR is displayed in price units and therefore can’t be compared directly with different priced instruments. A $5 ATR on a $500 stock is not the same volatility as a $5 ATR on a $25 stock.
ATR% solves this. The ATR is expressed as a percentage of the current price. It shows the recent price movement expressed as percentage of price, making cross-asset comparisons much more useful.
Asset | Price | ATR | ATR% |
Asset A | $100 | $2.00 | 2.0% |
Asset B | $20 | $1.00 | 5.0% |
Asset C | $500 | $6.00 | 1.2% |
If you look at Raw ATR, it looks like Asset C is the most volatile mover. However, on a percentage basis, Asset B is the most volatile in relation to its value. When using volatility, look for regime shifts or sort a watchlist by movement, ATR percentage is typically a more useful tool.
The comparison of ATR vs standard deviation is similar in that ATR shows the entire range of trading, including gaps, whereas standard deviation shows the dispersion of returns from the mean.
They both refer to the volatility, but the inputs and interpretations are different.
How to Use ATR for Stop-Loss Placement
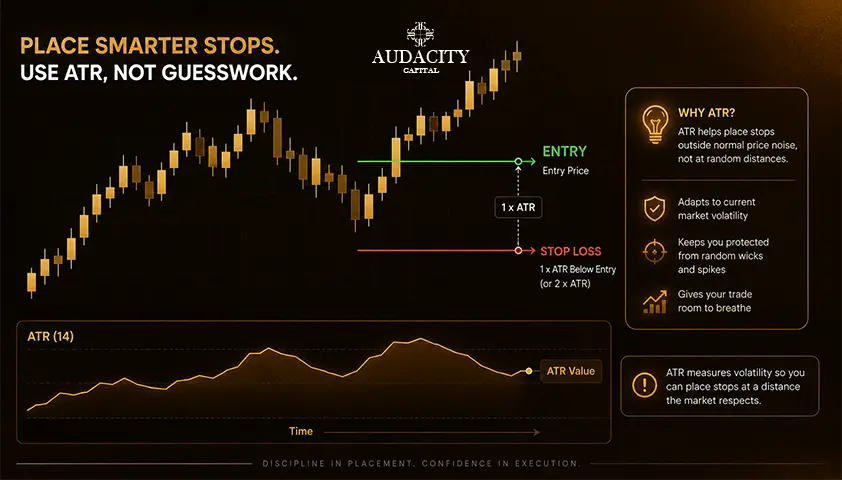
The ATR stop loss is best viewed as a volatility buffer, and not as a magic stop location. A stop should be based upon a trade thesis, and/or the market structure (swing low, broken level, invalidation point). ATR can be used to help determine the buffer size around that reason.
The normal approach is to set the stop at a desired number of ATRs either from the entry point or from a structural point, allowing sufficient time to absorb normal noise. It isn't a rule of 1.5x or 2x, it's a parameter to test against your entry, therefore be careful with that one.
Let's go over this real-world trade-off. The wider the ATR-based stop, the less risk of being knocked out by random move and the higher the dollar risk if you don't minimize your position size.
A tighter stop reduces dollar risk, but increases the chance of being stopped early due to noise before the thesis is realized.
For example, A trader has spotted a solid structural stop at 1.8 ATR below their entry point. They didn’t change the stop to their preferred multiple, instead they used the distance of 1.8 ATR and calculated their position based on this distance. The stop follows the market, size follows the stop.
How to Use ATR for Position Sizing
ATR position sizing relates the volatility of the instrument to how much risk you are willing to take. This is where ATR becomes a practical tool and not just a pretty addition to your chart.
A general formula for the size of the position:
Position Size = Maximum Planned Risk (in $) / Risk per unit
ATR can help determine the stop distance, which becomes the denominator in the position-sizing calculation. If your stop is $1.50 away from the entry point, each share is exposed to $1.50 of risk before fees, slippage and gaps.
In case a trader has an imaginary maximum planned risk equal to $150, they would calculate a position size of 100 shares and after that adjust position size taking into account instrument specifics such as lot size or minimum tick.
Flow of the decision:
ATR and structure → stop distance → dollar risk per unit → position size
The maximum risk figure above is a theoretical number for illustration. You should have your own unique risk parameters that fit your account, your strategy, the risk you've tested, and your personal risk tolerance. This is educational content and not financial advice.
ATR Trailing Stops and the Chandelier Exit
ATR can follow an exit as volatility changes, not at a set dollar level. The main principle behind the Chandelier Exit is to follow a multiple of ATR from a recent high in long trades or a recent low in short trades.
For example, if a stock's recent highest price is $120 and its ATR is $3, a 3× ATR Chandelier Exit for a long trade would place the trailing stop at $111 ($120 − 3 × $3).
The stop can follow the stock price upward if the stock sets a new price high, and can be pushed further away from the stock price if a volatility spike occurs.
The advantage here is that the distance of the trailing stop changes according to the change in volatility, while the distance of the regular trailing stop is fixed in dollar terms.
The trade-off is that a volatility-based trail can also deliver a solid portion of open profit, and it can be triggered when there's a volatility spike unrelated to your thesis. Test the multiplier and the reference point instead of taking them as a given.
Using ATR to Read Volatility Regimes and Breakouts
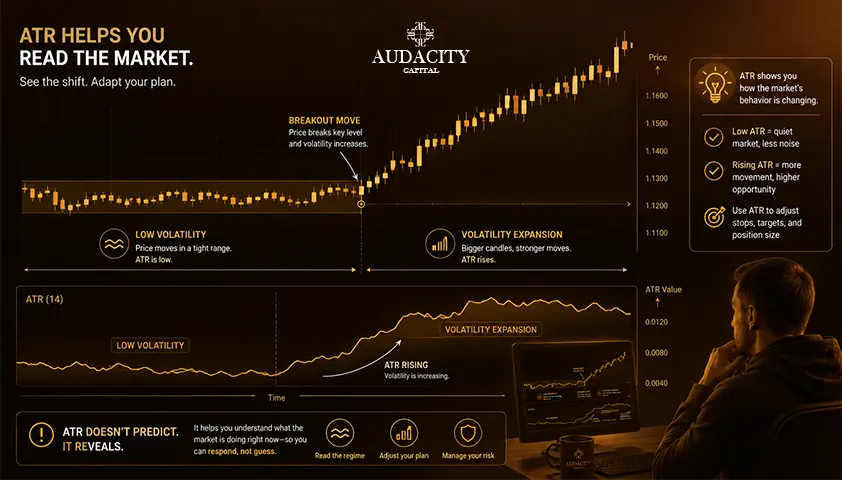
A constantly low ATR means that the volatility regime is compression, where recent ranges have been small. An ATR spike indicates an expansion regime. In both cases, no direction is chosen. Compressions can resolve into either side, while expansions can accompany trending moves or reversal.
These regimes can be used as a filter in an ATR trading strategy. For instance, a system could only trade breakouts when the current ATR is higher than the longer-term ATR average, or fade extremes when the ATR is high compared to a baseline.
This threshold needs to be tested within the complete strategy, and not taken from another source.
ATR is particularly useful to identify a breakout from a marginal price level as opposed to a large price move relative to the recent price range. That context is helpful. It is not a validation of the breakout on its own.
What ATR Settings Should You Use?
Many people use 14 periods as the default, based on Wilder's original convention. It's a starting point, not the optimum.
Shorter ATR settings (like 7 or 10) are more sensitive to the recent changes in volatility and can flip quickly after one large bar. Longer ATR settings, such as 20 or 30, incorporate more history and move slower when the regime changes. Neither one is better.
There is a practical way to select:
- Loosely match the lookback with the holding period.
- Choose an initial value.
- Try the size stability and regime classification for stop behaviour on out-of-sample data, not just on the trades that you remember.
Creating an absolute table and stating that a scalper should use X, a swing trader should use Y, and a position trader should use Z is not realistic and misleading. The right environment is determined by the strategy, market and time frame.
How to Use ATR: Common Mistakes
These are the top hidden errors that can cost traders a lot when they are still working out how to use ATR:
- Taking ATR as a directional indicator. ATR measures range, not market direction.
- Comparing raw ATR on assets with different prices. For that, use ATR%.
- Use of a predetermined multiplier without experimentation. One strategy that works well with a 2x stop can be the worst on another.
- Widening a stop after entering due to ATR expansion. When you get in, you should know what the rules are.
- Adjusting ATR indications after each losing trade. Curve-fitting to recent pain rarely improves the next trade.
- Ignoring gaps, slippage and contract specs when converting ATR to dollar risk. Real fills are NOT chart fills.
- Assuming high ATR means a better opportunity. More movement does not necessarily equate to good setup quality.
The key to solid volatility-based risk management is to correlate ATR with rules, and then stick to the rules when things get tough.
Conclusion
ATR is a measure of price volatility, not price direction. This is the crucial point that separates proper use of this indicator from its misuse.
Apply ATR to learn about how volatile the instrument is on the timeframe you are trading. Apply ATR% if you want to compare volatility for different assets. Next convert your selected stop size into corresponding position size, keeping the risk per trade within your desired parameters.
ATR won’t help you avoid losing trades.
But it may provide you with some extra structure in the way you take volatility into account when trading. That makes it a useful part of a disciplined risk-management framework.
If you're keen to develop these skills in a controlled trading setting, the education resources provided at Audacity Capital's Trader University are a great place to start.
Frequently Asked Questions
High ATR indicates that the recent bars have been trading off of greater ranges, compared to the rest of the instrument's history. It indicates movement, but not direction. Position sizing and stop distances should be modified because the same trade at higher volatility has a higher dollar risk per unit.
Neither. Low ATR indicates compression (ranges have gotten tighter). The eventual expansion may run in either direction. Don't interpret low ATR as a forecast of direction; it's just information about conditions.
ATR is measured in price units and ATR% expresses ATR as a percentage of price. The advantage of using ATR% is that it allows for volatilities to be compared across very different price instruments, hence it is often used for cross-asset ranking and screening.
There is no single optimum setting. Fourteen periods is a typical default that has been retained from Wilder's original work. Shorter windows are more responsive; longer windows provide more smoothing of history. The best option is the one that suits your time frame, strategy, and the nature of the environment in which you're testing.
There is no best multiplier in general. The ATR range of 1X to 3X ATR range is a simple guideline that is used in published examples, but it is not a market law. The right value for the multiplier will be one that suits your entry logic, market structure, costs and tested risk model.
Yes, there are some traders who set profit targets in multiples of ATR, meaning the profit target is based on recent volatility, not a fixed dollar amount. Like stops, the multiplier is a parameter to test, along with the rest of the system.
The calculation is the same, but there are different interpretations. Forex ATR is often read in pips, stock ATR in dollars per share and crypto ATR in the quoted currency. There are also no traditional session gaps with Crypto running 24 hours a day. ATR% can be used to normalize across these markets.

Handa nang maglapat ng disiplinadong panganib sa crypto? Galugarin ang mga bagong instrumento ng crypto ng Audacity Capital at dalhin ang iyong diskarte sa pangangalakal.
Matuto PaNewsletter
Sumali sa aming newsletter.
Sumali sa Aming Social Community

Simulan ang Iyong Paglalakbay Ngayon Gamit ang Aming Libreng Pagsubok
Ipagmalaki ang iyong mga kasanayan at tagumpay sa pamamagitan ng mga sertipiko at makakuha ng pagkilala para sa iyong pagsusumikap at dedikasyon mula sa mga potensyal na mamumuhunan at kasamahan.
Libreng PagsubokMga Kaugnay na Artikulo
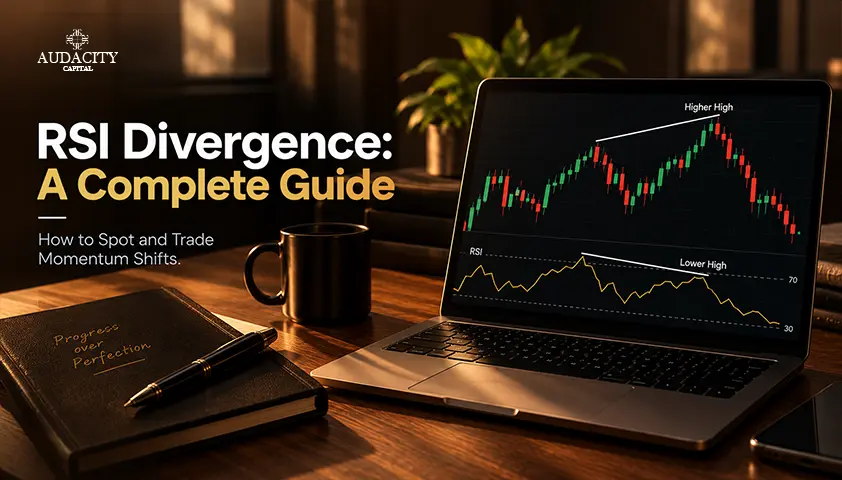
RSI Divergence: A Complete Guide to Spotting and Trading Momentum Shifts
Learn what RSI divergence is, explore bullish, bearish and hidden divergence, and discover how to identify, confirm and trade RSI divergence.

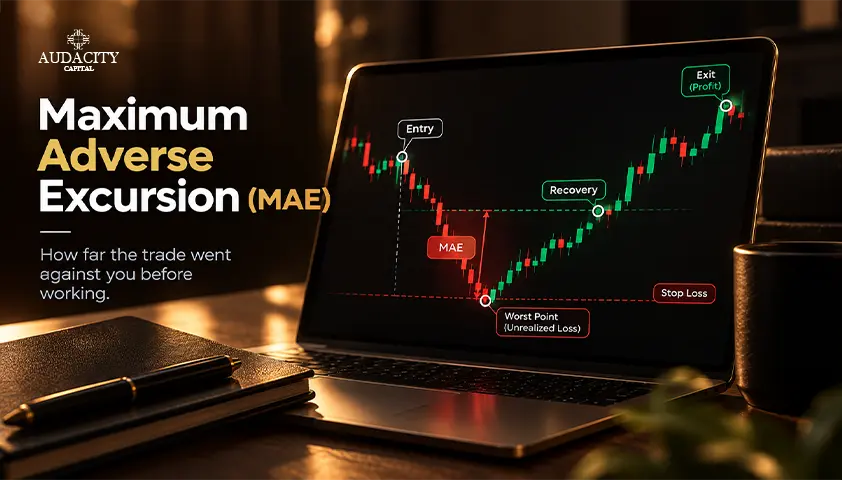
Maximum Adverse Excursion Explained for Traders
Learn how maximum adverse excursion measures a trade's worst open loss, how to calculate MAE, read charts, test stops, and avoid common errors.
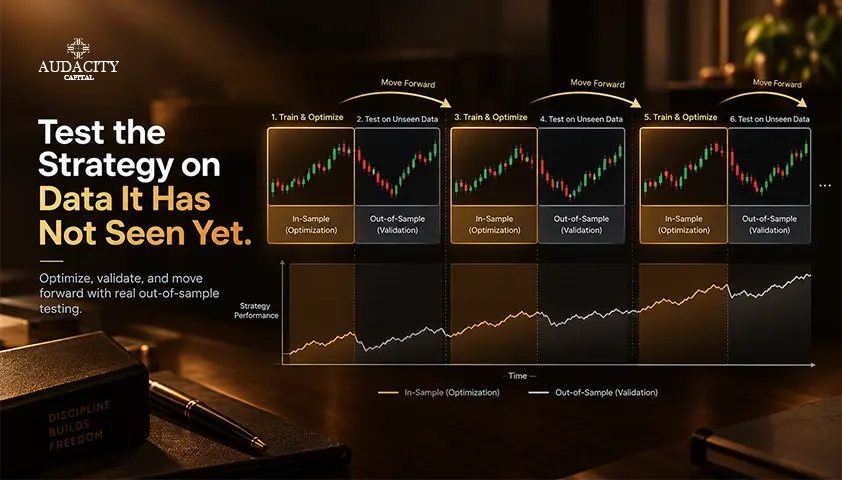
Walk-Forward Analysis in Trading: A Practical Guide
Learn how walk-forward analysis works in trading: in-sample and out-of-sample windows, rolling vs anchored designs, a worked example, and how to read results.

Market Profile Trading: How to Read TPO Charts
Learn Market Profile Trading with TPO charts, value area, POC, initial balance, day types, practical examples, and risk controls.