



Fibonacci in Forex Trading: How to Use Fibonacci Levels Like a Pro in 2026 ?


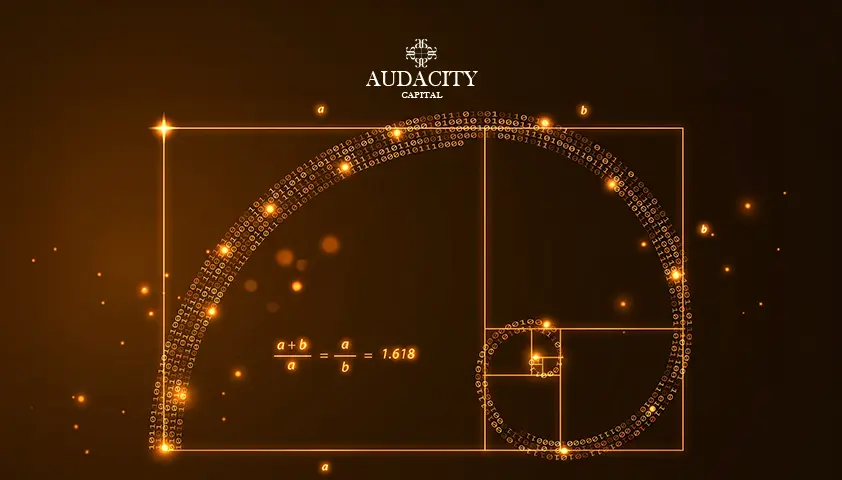
Fibonacci in forex trading is a technical analysis method that uses Fibonacci ratios such as 23.6%, 38.2%, 50%, and 61.8% to identify potential support levels, resistance levels, entry points, and profit targets. Traders commonly use Fibonacci retracement and Fibonacci extension tools to analyse market trends and improve trade timing.
If you have spent any time studying technical analysis, you have likely come across Fibonacci In forex trading, Fibonacci tools are widely used to identify potential support and resistance levels, find trade entry points, set profit targets, and analyse market trends.
Based on the Fibonacci sequence developed by the 13th-century Italian mathematician Leonardo of Pisa (known as Fibonacci), these tools have become a staple of technical analysis across the financial markets. From day traders looking for pullback entries to swing traders targeting larger market moves, Fibonacci levels help traders make more structured trading decisions.
In this guide, you'll learn what Fibonacci is in forex trading, how Fibonacci retracement and extension levels work, and how to use Fibonacci tools to improve trade entries, exits, and overall risk management.
What Is the Fibonacci Sequence?
The Fibonacci sequence is a series of numbers where each number is the sum of the two preceding ones:
0, 1, 1, 2, 3, 5, 8, 13, 21, 34, 55, 89, 144...
Dividing any number in the sequence by the one that follows it produces approximately 0.618. Dividing it by the number two places ahead gives approximately 0.382. These ratios, and a handful of others derived from them, form the backbone of every Fibonacci tool used in trading:
- 23.6%
- 38.2%
- 50% (not a true Fibonacci ratio, but widely observed)
- 61.8% (the golden ratio)
- 78.6%
These levels appear repeatedly across all timeframes and all currency pairs. That is not a coincidence. It is the result of collective market behaviour.
Why Forex Traders Use Fibonacci
Fibonacci is one of the most widely used technical analysis tools because it helps traders identify potential entry points, profit targets, and areas where trends may continue or reverse. Rather than guessing where a pullback might end, traders use Fibonacci levels to create a structured trading plan based on objective price levels.
Forex traders commonly use Fibonacci to:
- Identify potential support and resistance zones
- Find pullback entry opportunities in trending markets
- Set realistic profit targets using extension levels
- Improve risk-to-reward ratios
- Confirm trade setups with other technical indicators
- Analyse market structure across different timeframes
Because millions of traders monitor the same Fibonacci levels, these zones often become self-fulfilling areas of market reaction.
What Is Fibonacci in Forex Trading?
Fibonacci in forex trading refers to a collection of technical analysis tools that use Fibonacci ratios to identify potential support levels, resistance levels, entry points, profit targets, and trend continuation opportunities.
The most commonly used Fibonacci tools include:
- Fibonacci Retracement
- Fibonacci Extension
- Fibonacci Fan
- Fibonacci Arc
- Fibonacci Time Zones
- Fibonacci Channels
Forex traders use these tools to improve trade timing, manage risk, and identify high-probability market reactions.
How to Use Fibonacci in Forex Trading (Step-by-Step)
Understanding the Fibonacci tool is only the first step. The real value comes from applying it within a structured trading process.
Step 1: Identify the Market Trend
Before drawing Fibonacci levels, determine whether the market is trending higher or lower. Fibonacci works best in trending markets where price is likely to retrace before continuing in the original direction.
Step 2: Draw the Fibonacci Tool
- In an uptrend, draw from the swing low to the swing high.
- In a downtrend, draw from the swing high to the swing low.
This automatically plots the key retracement levels.
Step 3: Wait for a Pullback
Allow price to retrace into one of the key Fibonacci zones:
- 38.2%
- 50%
- 61.8%
Avoid entering immediately after a breakout.
Step 4: Look for Confirmation
Combine Fibonacci with:
- Candlestick patterns
- Trendlines
- Moving averages
- Support and resistance
- Market structure
Step 5: Enter the Trade
Once confirmation appears, enter in the direction of the trend.
Step 6: Set Your Stop Loss
Place your stop loss below the next Fibonacci level or beyond the swing point.
Step 7: Use Extensions for Profit Targets
Use Fibonacci extensions such as:
- 127.2%
- 161.8%
- 261.8%
to determine realistic exit targets.
Best Fibonacci Levels for Forex Trading
Not all Fibonacci levels carry the same importance. The table below shows how traders commonly use each level.
Fibonacci Level | Common Usage |
|---|---|
23.6% | Very strong trends with shallow pullbacks |
38.2% | Moderate retracements in healthy trends |
50% | Popular mid-point retracement level |
61.8% | Golden Ratio and most important level |
78.6% | Deep pullback before possible trend continuation or reversal |
Among all levels, the 61.8% retracement is generally considered the highest-probability area for trend continuation trades.
Common Trading Approach
Wait for price to pull back to a key Fibonacci level. Look for a confluence signal (a pin bar, engulfing candle, or support from a moving average at the same level). Enter in the direction of the original trend, with your stop loss placed just below the next Fibonacci level.
Different Fibonacci Tools Used in Forex Trading
Fibonacci Retracement
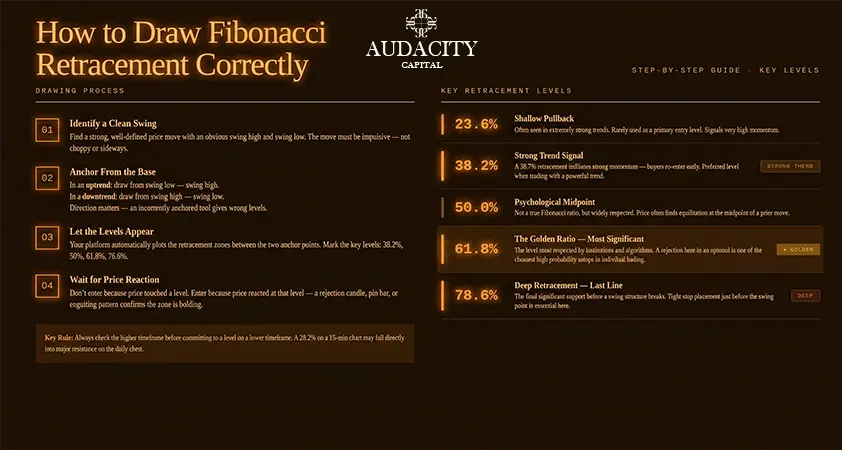
Fibonacci retracement is the most widely used Fibonacci tool in forex trading. It helps traders identify potential support and resistance levels during a pullback within an existing trend.
To draw Fibonacci retracement:
- In an uptrend, draw from the swing low to the swing high.
- In a downtrend, draw from the swing high to the swing low.
The tool automatically plots key retracement levels, including:
- 38.2% – Common in strong trends
- 50% – Popular mid-range pullback level
- 61.8% – The Golden Ratio and most important Fibonacci level
- 78.6% – Deep retracement level
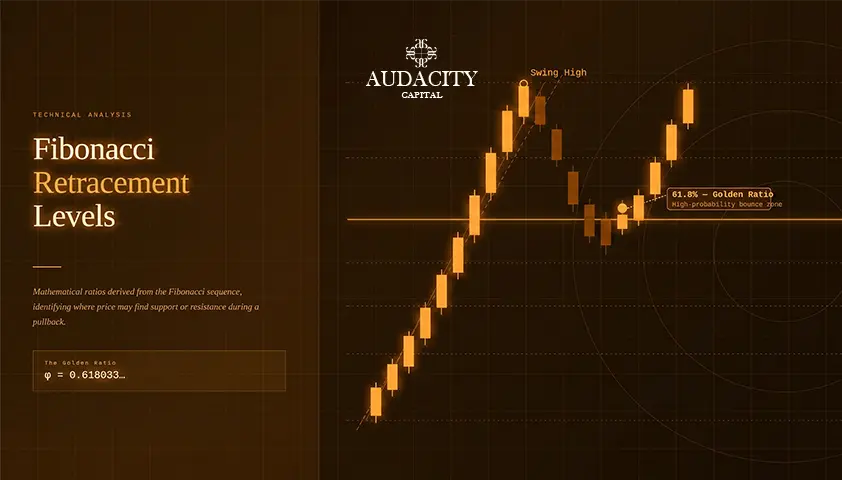
Among these, the 61.8% level is the most closely watched because it often acts as a potential trend continuation zone.
For a more detailed explanation, examples, and trading strategies, read our complete guide on Fibonacci Retracement in Forex Trading.
Fibonacci Extension
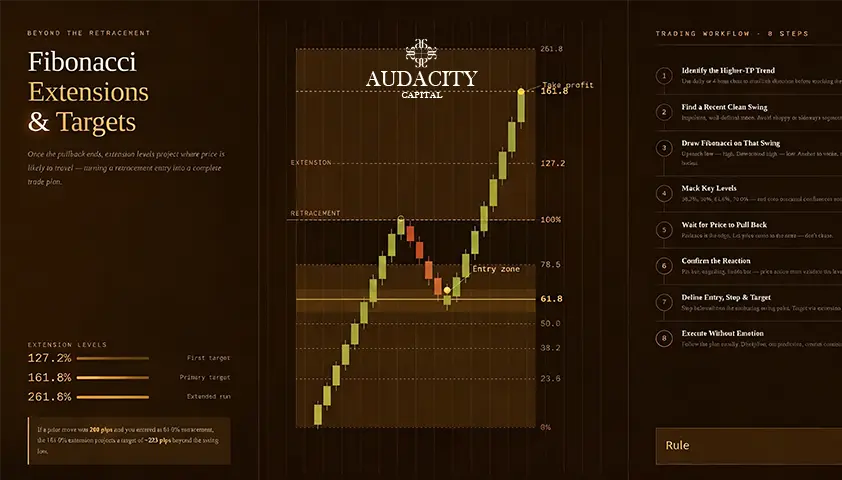
Fibonacci extension helps traders identify potential profit targets after entering a trade. Unlike retracement levels, which focus on pullbacks, extension levels project where the next price move could reach if the trend continues.
The most commonly used extension levels are:
- 127.2%
- 161.8%
- 200%
- 261.8%
For example, if EUR/USD pulls back to the 61.8% retracement level and resumes its uptrend, traders often use the 127.2% or 161.8% extension levels as potential profit targets.
When used together, Fibonacci retracement helps traders find entries, while Fibonacci extension helps determine exits.
Fibonacci Fan
A Fibonacci fan is a less commonly used Fibonacci tool that draws diagonal support and resistance lines from a significant swing point.
Unlike retracement levels, which are horizontal, Fibonacci fan lines move with the trend and can help traders visualise the speed and direction of price movement.
The fan is typically based on the:
- 38.2%
- 50%
- 61.8%
Fibonacci levels.
Most forex traders use Fibonacci fans as a secondary confirmation tool rather than a primary method for entering trades.
For a more detailed explanation, examples, and trading strategies, read our complete guide on Fibonacci fan
Fibonacci Arc
Fibonacci arcs are a less commonly used Fibonacci tool that combines price and time to identify potential support and resistance zones. Unlike retracement levels, arcs appear as curved lines extending from a significant swing point. Most traders use arcs as a supplementary tool rather than a primary trading signal.
Fibonacci Time Zones
Fibonacci time zones focus on identifying potential periods when market reversals or significant price movements may occur. They are plotted using Fibonacci intervals measured from a key swing high or low. While useful for advanced analysis, most forex traders rely more heavily on retracement and extension levels for day-to-day trading decisions.
Fibonacci Channels
Fibonacci Channels are a technical analysis tool that uses parallel trend lines based on Fibonacci ratios to identify potential support, resistance, and price targets within a trending market.
Unlike Fibonacci Retracement, which plots horizontal levels, Fibonacci Channels create a series of parallel lines above and below a trend line. These lines are spaced according to Fibonacci ratios, helping traders anticipate where price may react as it moves within a trend.
Fibonacci Trading Strategies For Forex
1. Trend Continuation Pullback Strategy
This is the most common Fibonacci-based approach, built around the retracement tool.
- Identify a strong trending market on your chosen timeframe.
- Wait for a pullback to the 38.2%, 50%, or 61.8% retracement level.
- Look for a price action signal confirming the pullback is ending (pin bar, engulfing candle, inside bar).
- Enter in the direction of the original trend with a stop below the 78.6% level.
- Set your target using the 127.2% or 161.8% extension level.
2. Fibonacci Confluence Strategy
Confluence is the idea that when multiple technical factors align at the same level, that level carries greater significance. A Fibonacci approach to confluence involves looking for areas where:
- A Fibonacci retracement level overlaps with a previous area of support or resistance.
- The 61.8% retracement coincides with a major moving average (such as the 200 EMA).
- A Fibonacci fan line passes through the same zone as a horizontal retracement level.
- A Fibonacci time zone lines up with a key retracement and a chart pattern.
The more elements that align at a single zone, the more traders are likely watching it, and the higher the probability of a meaningful reaction.
3. Fibonacci and Market Structure
This approach uses Fibonacci tools to confirm what is already visible in the market structure. In a healthy uptrend, price makes higher highs and higher lows. When price pulls back to a Fibonacci level and then makes a new higher low before pushing to a new higher high, that confirms the structure is intact. Traders use this as a signal to add to or initiate positions.
Conversely, if price breaks below the 78.6% retracement on a pullback and then fails to make a new high, the structure may be breaking down. Fibonacci levels help make this structural analysis more precise.
Why Fibonacci Confluence Matters
Fibonacci works best when multiple technical factors point to the same trading zone. This concept is known as confluence.
Confirmation Tool | What It Adds |
|---|---|
RSI | Momentum confirmation |
Moving Averages | Trend confirmation |
Support & Resistance | Market structure confirmation |
Candlestick Patterns | Entry confirmation |
Trendlines | Directional confirmation |
A Fibonacci level by itself may not be enough to justify a trade. However, when a 61.8% retracement aligns with a support level, a 200 EMA, and a bullish engulfing candle, the probability of a successful trade setup can increase significantly.
Fibonacci + RSI Trading Strategy
One of the most effective ways to use Fibonacci in forex trading is by combining it with the Relative Strength Index (RSI). While Fibonacci identifies potential support and resistance levels, RSI helps traders measure momentum and identify overbought or oversold conditions.
How It Works
- Identify a strong trend.
- Draw Fibonacci retracement levels from the swing low to the swing high.
- Wait for price to retrace into the 38.2%, 50%, or 61.8% zone.
- Check RSI for confirmation.
- Enter when price action confirms the reversal.
Example
Suppose EUR/USD retraces to the 61.8% Fibonacci level while RSI drops below 30 and begins turning higher.
This creates a stronger setup because both price structure and momentum support a potential bullish reversal.
Why Traders Use It
- Improves trade timing
- Filters weak setups
- Adds momentum confirmation
- Works across multiple timeframes
Fibonacci + Moving Average Strategy
Moving averages are frequently used alongside Fibonacci retracement levels to identify high-probability trend continuation opportunities.
How It Works
- Use a 50 EMA or 200 EMA to determine trend direction.
- Draw Fibonacci retracement levels during a pullback.
- Look for overlap between Fibonacci levels and moving averages.
- Wait for price action confirmation.
- Enter in the direction of the trend.
Example
If GBP/USD retraces to the 50% Fibonacci level while also testing the 50 EMA, traders often view this as a stronger support area than either tool alone.
Why Traders Use It
- Confirms trend direction
- Improves trade quality
- Creates stronger confluence zones
- Helps reduce false signals
Real Fibonacci Trading Example
Understanding the theory is important, but seeing Fibonacci applied in a real trade helps bring the concept to life.
EUR/USD Uptrend Example
Imagine EUR/USD rallies from 1.0800 to 1.1000.
You draw the Fibonacci retracement from the swing low to the swing high.
The resulting levels are:
- 38.2% = 1.0924
- 50% = 1.0900
- 61.8% = 1.0876
Price retraces to the 61.8% level and forms a bullish engulfing candle.
Trade Setup
Trade Element | Value |
|---|---|
Entry | 1.0880 |
Stop Loss | 1.0840 |
Risk | 40 pips |
Target | 1.1120 |
Reward | 240 pips |
Risk-to-Reward | 1:6 |
This demonstrates how Fibonacci can be used to create a complete trade plan from entry to exit.
Best Currency Pairs & Timeframes for Fibonacci Trading
One of the most common questions traders ask is: Does Fibonacci work in forex? The answer is yes—but its effectiveness often depends on the currency pair and timeframe being analyzed.
Fibonacci tools tend to work best on highly liquid currency pairs because they attract significant participation from retail traders, institutions, and algorithmic trading systems. Since many market participants watch the same Fibonacci levels, price reactions around these areas can become self-fulfilling.
Best Currency Pairs for Fibonacci Trading
The most reliable pairs for Fibonacci analysis include:
- EUR/USD – The most liquid forex pair, known for respecting key technical levels.
- GBP/USD – Higher volatility creates strong retracements and extension opportunities.
- USD/JPY – Often forms clean trends that work well with Fibonacci tools.
Traders should be cautious when using Fibonacci on exotic or thinly traded currency pairs, as lower liquidity can result in less predictable price reactions and more false signals.
Best Timeframes for Fibonacci Trading
For the highest-probability Fibonacci setups, many traders focus on:
- Daily (D1) – Ideal for identifying major support, resistance, and trend levels.
- 4-Hour (H4) – Popular among swing traders seeking institutional-level setups.
- 1-Hour (H1) – Useful for refining entries while maintaining a broader market perspective.
Scalpers can use M15 or M5 charts, but Fibonacci levels should ideally be drawn from higher timeframe swing highs and lows to avoid market noise.
Trading Style | Recommended Timeframe | Best Currency Pairs |
|---|---|---|
Position Trading | Daily (D1) | EUR/USD, GBP/USD, USD/JPY |
Swing Trading | H4 | EUR/USD, GBP/USD, USD/JPY |
Day Trading | H1 | EUR/USD, GBP/USD, USD/JPY |
Scalping | M15 / M5 | EUR/USD, GBP/USD |
Key Takeaway
For most traders, the best timeframe for Fibonacci forex trading is the H4 or Daily chart, while EUR/USD, GBP/USD, and USD/JPY remain the most reliable currency pairs due to their liquidity and consistent technical behavior.
Fibonacci vs Other Technical Analysis Tools
Fibonacci works best when combined with other forms of technical analysis rather than used in isolation.
Fibonacci vs Support and Resistance
Traditional support and resistance rely on historical price reactions. Fibonacci provides mathematically derived levels that often align with those same areas.
Fibonacci vs Moving Averages
Moving averages help identify trend direction, while Fibonacci helps identify pullback entry zones within that trend.
Fibonacci vs RSI
RSI measures momentum and overbought or oversold conditions. Fibonacci identifies potential reaction zones. Together they can improve trade timing.
Fibonacci vs Trendlines
Trendlines show the direction of the market. Fibonacci helps identify where pullbacks may end before the trend resumes.
The strongest setups often occur when multiple tools point to the same trading zone.
Fibonacci Indicators
Beyond manually drawing Fibonacci tools, many traders use indicator-based Fibonacci tools that automate the process. These include:
- Auto Fibonacci Retracement: Automatically detects recent swing highs and lows and draws retracement levels without manual input.
- Fibonacci Pivot Points: Combines traditional pivot point analysis with Fibonacci ratios to generate support and resistance levels based on the previous period's price range.
- Fibonacci Moving Averages: Some traders use EMAs or SMAs set to Fibonacci numbers (8, 13, 21, 34, 55, 89, 144) as dynamic trend filters. When price is above all of these, the trend is strong. When it starts breaking below them in sequence, momentum may be shifting.
- Fibonacci Oscillators: Oscillators built around Fibonacci-derived period settings to identify momentum and potential reversal zones.
The value of automated Fibonacci indicators is speed and consistency. The risk is over-reliance. Understanding why Fibonacci levels work, and developing the judgment to read price behaviour at those levels, is what separates traders who use Fibonacci well from those who are simply drawing lines.
Fibonacci and Trend Analysis
One of the most powerful applications of Fibonacci tools is in broader trend analysis. Rather than using them in isolation for single trades, experienced traders use Fibonacci structures to map the larger picture:
- Trending markets tend to retrace to the 38.2% or 50% level before continuing. Deep retracements to the 61.8% or 78.6% can suggest a weakening trend or a potential reversal.
- Extension targets help define the expected range of a trend leg. If price consistently hits the 161.8% extension before retracing, you are in a strong trend. If price is struggling to reach the 127.2%, the trend may be losing momentum.
- On higher timeframes, mapping Fibonacci across major swing points can reveal macro levels that act as significant barriers for price over months or years.
This macro use of Fibonacci is common among institutional traders and fund managers who need to plan positions over longer timeframes. It is also directly relevant for prop traders managing positions across multiple sessions or holding trades overnight.
The best Fibonacci traders do not rely on the tools blindly. They use Fibonacci to frame their analysis, then let price behaviour at the key levels tell them what to do.
Quick Reference Summary
Tool | Primary Use | Key Levels / Feature |
Retracement | Find pullback entry zones | 23.6%, 38.2%, 61.8% |
Extension | Set profit targets | 127.2%, 161.8%, 261.8% |
Fan | Visualise trend channels | 3 diagonal fan lines |
Arc | Combine price & time | Curved support/resistance |
Time Zones | Forecast reversal timing | Vertical date lines |
Common Fibonacci Trading Mistakes
Even though Fibonacci is simple to use, many traders apply it incorrectly.
Drawing from Incorrect Swing Points
Using insignificant highs and lows often produces unreliable levels.
Trading Against the Trend
Fibonacci performs best when used in the direction of the dominant trend.
Ignoring Confirmation Signals
Never enter a trade solely because price reaches a Fibonacci level.
Using Too Many Fibonacci Levels
Cluttering a chart with excessive Fibonacci tools creates confusion.
Ignoring Risk Management
No Fibonacci level guarantees a market reaction. Always use stop losses and proper position sizing.
Key Takeaways
Your essential checklist from this guide
- Fibonacci ratios (23.6%, 38.2%, 61.8%, 78.6%) are derived from the Fibonacci sequence and act as high-probability support and resistance zones in all markets.
- The 61.8% retracement, known as the golden pocket, is the single most important Fibonacci level. It attracts the most institutional interest and produces the highest-probability trade setups.
- Fibonacci retracement finds your entry. Fibonacci extension finds your target. Always use both together to give every trade a defined risk-to-reward structure.
- A Fibonacci fan adds a directional, time-based dimension to your analysis. It is best used to track how fast or slow a trend is moving, not just where it is going.
- Fibonacci arcs and time zones are advanced tools. Use them to confirm setups already identified by retracement and extension levels, not as standalone signals.
- Confluence is the key to high-probability Fibonacci trading. A 61.8% retracement that aligns with a horizontal support level, a major moving average, and a time zone line is far more reliable than a retracement level in isolation.
- Fibonacci works across all timeframes. The same principles apply whether you are scalping on the 5-minute chart or swing trading on the daily.
- Automated Fibonacci indicators add speed, but do not replace judgment. Understanding why price reacts at a level is more valuable than having a tool that marks every level automatically.
- No Fibonacci level works 100% of the time. Pair every Fibonacci setup with price action confirmation, clear trend structure, and disciplined risk management.
- Start simple. Master the retracement tool before adding extensions, fans, arcs, and time zones. A trader who executes the pullback strategy with consistency will outperform one who uses five Fibonacci tools poorly.
Using Fibonacci in Prop Trading
Fibonacci is particularly useful for prop traders because it helps create structured trading plans that align with strict risk management rules.
Many funded traders use Fibonacci to:
- Identify high-probability pullback entries
- Improve risk-to-reward ratios
- Manage drawdown effectively
- Set objective profit targets
- Maintain consistency during prop firm challenges
When combined with sound risk management and disciplined execution, Fibonacci can become a valuable tool for both retail and funded traders.
Final Thoughts
Fibonacci is not magic, and it does not work 100% of the time. No tool does. What Fibonacci offers is a structured, repeatable framework for making sense of price movement. It transforms the seemingly random behaviour of markets into identifiable zones, timings, and targets.
The traders who get the most out of Fibonacci are not the ones who chase every retracement level. They are the ones who combine Fibonacci with solid trend analysis, patience for confluence, and disciplined risk management.
Whether you are trading EUR/USD on a 1-hour chart or holding a swing position on the daily, Fibonacci gives you a language for reading the market that is consistent, logical, and time-tested.
Start with the retracement tool. Get comfortable drawing it on clean swing highs and lows. Learn to recognise what a genuine bounce off the 61.8% level looks like versus a false one. From there, layer in extensions for target-setting and experiment with the other tools as you develop your eye for the charts.
Ready to put Fibonacci to work on a funded account? Audacity Capital gives serious traders the capital they need to trade at the level they deserve.
Learn, practice, and apply your trading strategy in Audacity Capital's free monthly trading competition.
Frequently Aaked Questions
Yes, and the reason is largely self-fulfilling. Because millions of traders worldwide use the same Fibonacci levels, those levels attract real buying and selling pressure. That collective behaviour makes the levels function as genuine support and resistance zones. Like any tool, Fibonacci works best when combined with trend analysis, price action confirmation, and proper risk management.
The 61.8% retracement level, often called the 'golden pocket,' is widely considered the most significant. It is the direct expression of the golden ratio (1/1.618) and attracts the most attention from institutional and professional traders. The 38.2% level is the second most important for identifying shallow pullback entries in strong trends.
Start with Fibonacci retracement. It is the foundation of all Fibonacci trading. Once you are comfortable identifying clean swing highs and lows, drawing the tool correctly, and reading price behaviour at the key levels, you can layer in extensions for target-setting. The other tools (fan, arc, time zones) come after you have built that foundation.
Retracement measures how far price has pulled back within an existing move. It identifies potential entry zones. Extension projects how far price could travel beyond the original swing high or low. It identifies potential profit targets. The two tools are designed to work together: retracement for entry, extension for exit.
Yes. Fibonacci levels are fractal, meaning the same principles apply whether you are looking at a 5-minute chart or a monthly chart. Many traders use multiple timeframes, identifying the key Fibonacci zones on the higher timeframe and then dropping to a lower timeframe to find a precise entry signal.
Confluence occurs when two or more independent technical factors point to the same price zone. In Fibonacci trading, this might mean a 61.8% retracement level that also coincides with a previous area of support, a 200 EMA, or a Fibonacci time zone line. Confluence zones are more significant because they are being watched by more traders for more reasons, which increases the probability of a meaningful reaction.
News-driven price moves can blow through Fibonacci levels without pausing. During major economic releases (such as NFP or central bank decisions), price can gap or spike past key levels entirely. Most experienced traders avoid entering Fibonacci setups immediately before or during major news events, waiting for the volatility to settle before looking for a reaction at a Fibonacci level.
Always anchor your retracement to the most recent, clearly defined swing that relates to the trend you are trading. On a daily chart, that might be the last major swing before a pullback. On a 1-hour chart, it is the most recent impulse move in the direction of the trend. The cleaner and more obvious the swing, the more traders will have drawn their Fibonacci from the same points, making the resulting levels more significant.
Yes. Day traders commonly use Fibonacci retracement on 15-minute, 30-minute, and 1-hour charts to find intraday entry points during pullbacks. Swing traders apply the same logic on 4-hour and daily charts. The key difference is that lower timeframe Fibonacci levels can be more sensitive to noise, which is why price action confirmation becomes even more important for day trading applications.
Absolutely. Fibonacci tools are compatible with trend-following, pullback, and breakout strategies, all of which can be structured to respect drawdown limits and risk parameters. The key is using Fibonacci to define precise entry zones, stop loss placement, and profit targets, which naturally supports consistent risk management. A well-defined Fibonacci setup makes it easier to size positions correctly and avoid the emotional decision-making that erodes funded account performance.

Handa nang maglapat ng disiplinadong panganib sa crypto? Galugarin ang mga bagong instrumento ng crypto ng Audacity Capital at dalhin ang iyong diskarte sa pangangalakal.
Matuto PaNewsletter
Sumali sa aming newsletter.
Sumali sa Aming Social Community

Simulan ang Iyong Paglalakbay Ngayon Gamit ang Aming Libreng Pagsubok
Ipagmalaki ang iyong mga kasanayan at tagumpay sa pamamagitan ng mga sertipiko at makakuha ng pagkilala para sa iyong pagsusumikap at dedikasyon mula sa mga potensyal na mamumuhunan at kasamahan.
Libreng PagsubokMga Kaugnay na Artikulo

The Skills Traders Must Master To Survive The Next Market Cycle

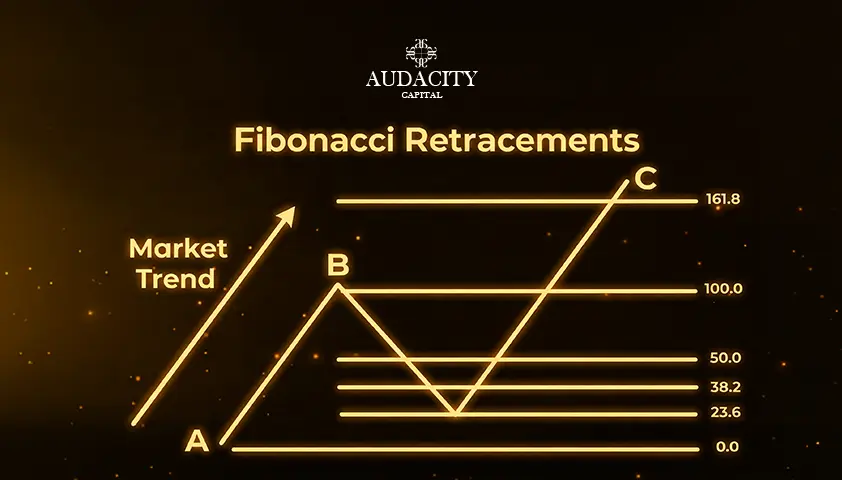
How to Use Fibonacci Retracement in Forex Trading (And Actually Make It Work)
Learn how to use Fibonacci retracement in forex trading to identify pullbacks, support and resistance levels, and high-probability trade entries.

What Is Forex Trading Volume?
Learn what trading volume means in Forex trading, how it’s measured, and how traders use volume to confirm trends and price movements.
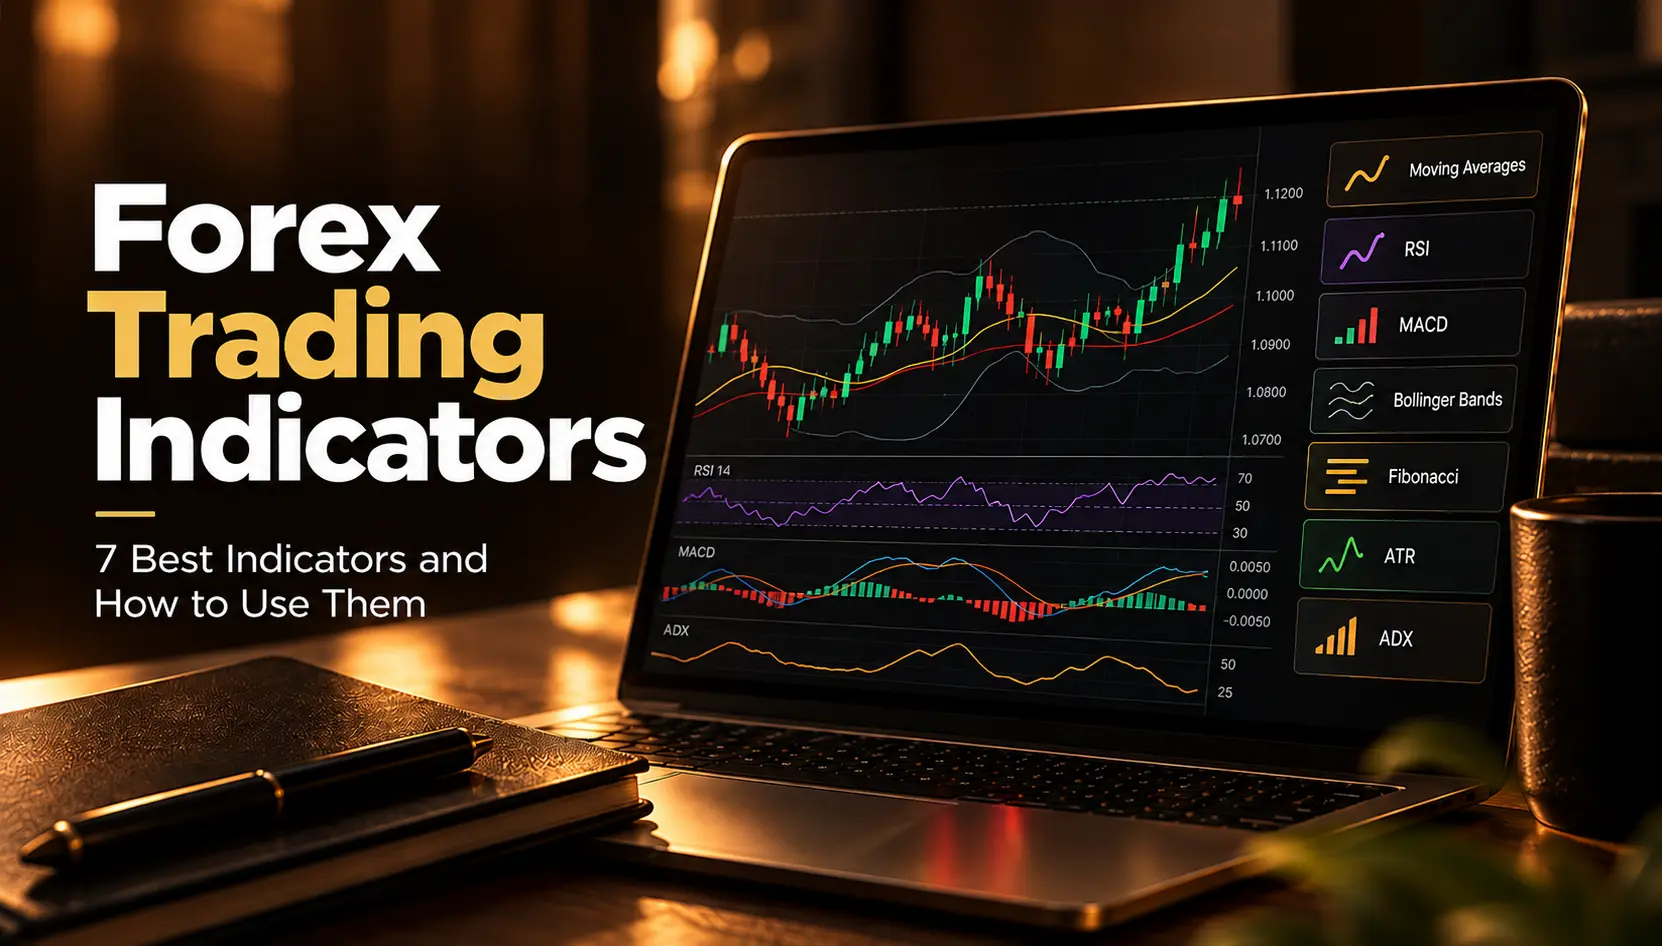
7 Best Forex Trading Indicators in 2026 & How to Use Them
Explore 7 forex trading indicators, including moving averages, RSI, MACD, and Bollinger Bands. Learn how they work and how to use them.