


Supply and Demand Zones: A Complete Guide for Traders



Supply and demand zones mark price areas where large, uneven buying or selling has already moved the market hard in one direction. What creates the zone in the first place is the unfilled institutional orders left behind during a tight consolidation.
Traders validate a demand zone and supply zone setup by checking freshness, higher-timeframe alignment, and the strength of the original departure. Not every zone deserves a trade, though, since repeat retests drain the orders that made it work. Here is a detailed guide every trader should move through at least once:
What Are Supply and Demand Zones?
Supply and demand zone setups mark specific price bands where buyers and sellers were badly out of balance.
A supply zone sits above the current price, where selling interest overwhelmed available buyers and pushed price down fast.
A demand zone sits below the current price, where buying interest absorbed the available sellers and drove price up hard.
But both form the same way. Large institutional orders can’t fill instantly at one exact price without moving the market against themselves, so they get worked through gradually during a tight consolidation instead. That consolidation, known as the base, gets followed by a strong, fast move away from it, often on candles with unusually wide ranges. When price eventually comes back to test that base, whatever orders never filled during the first time around can trigger a fresh reaction in the same direction as the original move.
A Zone Is an Area, Not a Single Price
Because those orders sit across a range, a zone gets drawn as a rectangle. Boxing in the base gives room for normal noise and spread, the kind of small penetration that happens even when the zone still holds.
A Zone Is an Area of Interest, Not a Guaranteed Reversal
A zone flags where a reaction is more likely to happen. Every time price retests a zone, it uses up some of what’s left of the original unfilled orders. A zone tested several times already carries a lot less weight than one being touched for the very first time, and thus treating every zone as an automatic turning point is a fast way to lose trades that look good on paper.
How to Draw Supply and Demand Zones?
Learning how to draw demand and supply zones matters consistently more than any single indicator because a sloppy zone gives false signals no matter how good the rest of the analysis is.
How to Draw a Demand Zone?
- First, spot a strong bullish move, a clear run of large-bodied candles pushing up fast.
- Now trace that move back to where it actually started.
- Find the base, the small, tight candles sitting right before the breakout.
- Mark the price area by boxing in that base between two lines.
- Extend the zone forward across the chart into unplayed price space.
- Check whether price has already revisited this base, and how many times.
- Confirm the setup lines up with the higher timeframe trend.
How to Draw a Supply Zone?
Interestingly, the same process now runs in reverse:
- For the supply zone, first spot a strong bearish move, with large-bodied candles pushing price lower.
- Trace the move to its origins, where the downward move began.
- Find the base, where price briefly consolidated before the move.
- Mark the zone, boxing the relevant area around the base.
- Extend the zone forward into untested price space.
- Check previous revisits and how often the price has returned.
- Confirm the context, including higher-timeframe structure or trend.
Where Exactly Should the Zone Start and End?
Two lines define the zone. The proximal line sits closest to current price: the top of the base for demand, the bottom for supply, and it’s where an entry actually triggers. The distal line sits at the far edge, the lowest wick for demand or the highest for supply, marking where the setup is invalidated and where a stop-loss belongs.
Wick vs Body - When Drawing a Zone
Two conventions handle the proximal line differently. Body-to-wick uses the candle’s real body for the proximal edge and the wick for the distal edge, producing a tighter zone with a better risk-reward ratio but more missed entries. Wick-to-wick uses the full wick on both edges, catching more fills but demanding a wider stop. Either works, but what matters more is picking one and sticking with it across every chart.
How Wide Should a Supply or Demand Zone Be?
Too narrow, and normal price noise trips the stop before the setup gets a fair chance. Too wide, and precision disappears along with the risk-reward ratio, since the stop has to sit that much further away. The best width captures the base’s real wicks without dragging in volatility spikes that come from somewhere else on the chart.
Supply and Demand Zone Patterns
Every supply and demand zone pattern setup falls into one of four shapes, based on what happened before the base and what happened after.
Pattern | Zone Type | Role |
Rally-Base-Rally (RBR) | Demand | Continuation |
Drop-Base-Drop (DBD) | Supply | Continuation |
Drop-Base-Rally (DBR) | Demand | Reversal |
Rally-Base-Drop (RBD) | Supply | Reversal |
Continuation vs Reversal Zones
RBR and DBD form mid-trend, where the market pauses briefly before continuing. DBR and RBD form at turning points instead, where the prior move gets fully absorbed.
Why Context Matters for Each Pattern
The shape alone doesn’t make a setup tradable. Continuation patterns need the broader trend behind them. Reversal patterns need real structural confirmation first.
Can a Single Candle Form a Zone?
Yes. One sharp pin bar or engulfing candles, followed by a strong departure, can work as a base on its own.
How to Identify Strong Supply and Demand Zones?
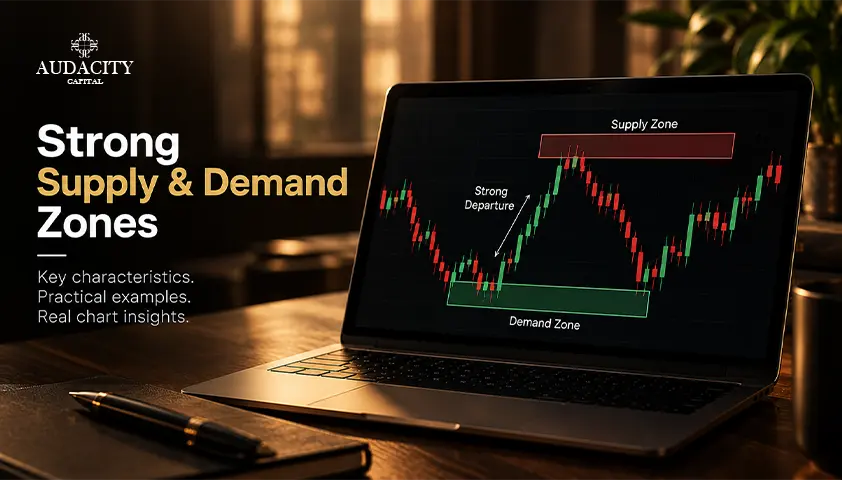
Not every base produces a tradable zone. Strong supply and demand zones share a handful of physical characteristics that separate genuine institutional footprints from ordinary consolidation.
- Strong Departure - The speed and distance price travels away from the base reveal much order imbalance that actually sat behind it. A slow, grinding move away suggests light interest. A violent one suggests real buying or selling pressure got left unfilled.
- Short Base Consolidation - A tight base, roughly one to six candles, points to institutional orders getting worked through quickly. A base that drags on for longer often reflects retail indecision more than a clean institutional footprint.
- Displacement, Candle Size and Speed - The strongest zones form from large-bodied candles with small wicks, the kind that show price moving with real conviction.
- Freshness and Retest History - A zone nobody has touched yet holds the most unfilled orders, which is why a first retest likely produces the sharpest reaction.
Zone Quality Checklist
Beyond those physical traits, a handful of context checks decide whether a zone is actually worth trading:
- Higher-timeframe alignment: Does the zone sit with the dominant trend on a higher chart, not against it?
- Market-structure alignment: Did the departure actually break structure or shift character, not just bounce?
- Location: Does the zone sit at a real swing extreme, not buried in the middle of a range?
- Liquidity context: Did the move sweep prior highs or lows before departing?
- Space to the opposing zone: Is there enough room on the chart for the trade to actually develop?
- Risk/reward potential: Does the distance from entry to stop still allow a reasonable 1:2 or better target?
Zone Location Also Matters
A departure sitting in the middle of a range carries less weight than an identical one forming at a genuine swing extreme. Mid-range zones chop and get mitigated early, since real institutional liquidity clusters at the edges of a range instead of its center.
Available Room to Target
A strong zone isn’t automatically a strong trade. A fresh, well-formed demand zone sitting directly under a major supply zone leaves little room to actually run. Checking the distance from entry to the nearest opposing zone before committing capital is what turns a good-looking setup into a genuinely tradable one.
Fresh Zones Vs Tested Zones
A zone's edge depends on how many of its original orders are still unfilled. Fresh supply and demand zones hold the full pool of unfilled orders and tend to produce the sharpest reaction. Tested supply and demand zones have already given some of that up, since each visit uses up a portion of what's left.
The Supply and Demand Zone Lifecycle
Zones likely move through a rough progression: fresh, tested, re-tested, weakened, then broken. This isn't a fixed rule that plays out the same way every time, just a useful way to gauge how much strength a zone likely has left.
What Happens When a Zone Breaks?
A decisive break invalidates the zone and often signals a shift in market structure. Sometimes the broken level flips roles entirely, turning old resistance into new support, or vice versa.
How to Rank Multiple Supply and Demand Zones?
When several zones sit on the same chart, ranking them beats treating every one as equally tradable. Run each candidate against the same eight factors:
- Freshness
- Departure strength
- Base quality
- Higher-timeframe alignment
- Market structure
- Location
- Retest history
- Available reward
A zone that scores well across most of these deserves priority over one that looks strong on only one factor, since a genuinely high-probability setup likely checks several boxes at once.
Supply and Demand Trading Strategy
A supply and demand trading strategy works best as a repeatable sequence and not as a set of loose ideas applied inconsistently.
- Establish the higher-timeframe bias - Decide the dominant direction on the daily or 4-hour chart first.
- Mark the zones - Identify fresh zones that line up with that bias.
- Wait for the return - Let price come back to the zone rather than chasing it early.
- Look for confirmation - Watch how the price actually behaves once it arrives.
- Enter - Trigger the trade based on the entry style in use.
- Set the stop - Place it just beyond the distal line.
- Set the target - Aim just ahead of the nearest opposing zone.
Reaction vs Acceptance at the Zone
How price behaves once it reaches a zone says a lot about what's actually happening underneath.
Reaction means price gets rejected quickly. Sharp wicks, pin bars, strong engulfing candles, all pointing to real orders defending the levels.
Acceptance means price pushes into the zone and simply stays there, stalling instead of reversing, which usually signals the zone is running out of strength.
Touch Entry vs Confirmation Entry vs Scale-In
Three entry styles cover most approaches.
- A touch entry places a limit order at the proximal line, the fastest option with the best risk-reward, but the most exposed if price runs straight through.
- A confirmation entry waits for an actual rejection signal inside the zone, trading some risk-reward for a better win rate.
- A scale-in entry splits the difference, taking a particular position on the initial touch and adding the rest once confirmation shows up.
Multi-Timeframe Supply and Demand Analysis
Looking at just one timeframe misses the bigger picture. Multi-timeframe analysis pairs a higher timeframe’s sense of where to trade with a lower timeframe’s precision on how to trade, which together make for the best timeframe for the supply and demand zones approach.
A Practical Timeframe Workflow:
A simple top-down process covers most of it. It uses the higher timeframe to locate the dominant zones, an intermediate timeframe to assess how structure is holding up as price approaches, and the lower timeframe to refine the actual entry.
When Lower-Timeframe Confirmation Helps
Dropping to a lower timeframe can sharpen entries and tighten stops, but it also introduces more noise and more false signals. It helps most on reversal setups, where extra confirmation genuinely reduces risk, and matters less on a clean continuation move that doesn’t need the extra step.
Supply Zone vs Demand Zone
Dimension | Demand Zone | Supply Zone |
Location relative to price | Below current price | Above current price |
Dominant pressure | Net buying | Net selling |
Departure | Fast move upward | Fast move downward |
Trade bias | Long entry | Short entry |
How Supply and Demand Behave on a Retest?
On a demand retest, the question is whether incoming selling is absorbed by leftover buy orders, usually shown through lower wicks or a bullish candle. On a supply retest, it's the reverse: whether incoming buying gets met with real selling pressure, typically shown through upper wicks or a bearish rejection candle.
Supply and Demand Vs Support and Resistance
Both aim to flag areas where price might turn. Supply and demand vs support and resistance comes down to shape and behavior, though. Support and resistance are drawn as single lines, and classical theory treats more touches as strength. Supply and demand zones are drawn as ranges, and they actually weaken with more touches, since each retest uses up the orders that gave the zone its edge.
Supply and Demand Zones vs Order Blocks
A supply and demand vs order blocks comparison starts with scope. A zone covers the full consolidation base where the imbalance built up. An order block isolates something narrower, just the last opposing candle right before the move.
Both track the same underlying idea: institutional footprints ahead of a displacement, and both get traded on retest. Many traders use them together like the zone for context, the order block for a tighter entry, and not the two as interchangeable.
Supply/Demand Zones vs Fair Value Gaps
A supply and demand vs fair value gaps comparison works similarly. A zone marks the broader reaction area, while a fair value gap marks a specific price imbalance left behind during the move. The two often overlap, and a zone that leaves a gap on departure carries more weight, a clear sign of confluence.
When NOT to Trade a Supply and Demand Zone?
Knowing when to walk away matters as much as knowing how to draw a zone:
- Weak Departure: A slow, small-bodied exit from the base signals light interest, not a real imbalance worth trading.
- Over-Tested Zone: A zone touched three or four times already has burned through most of its original orders.
- Choppy/Sideways Market: Range-bound conditions produce more false reactions and whipsaws than trending ones.
- Conflicting Higher-Timeframe Structure: A demand zone sitting against a dominant higher-timeframe downtrend fights the larger trend.
- Poor Risk/Reward: If the nearest opposing zone sits too close, the setup rarely justifies the risk.
- Price Has Already Broken the Zone: A zone that’s been decisively broken no longer holds its original meaning.
- Major Event/News Volatility: Scheduled high-impact releases can blow through a zone regardless of how well it was drawn.
Supply and Demand Zone Examples
Seeing the process in action makes it easier to apply than a list of rules alone. Here are different examples that follow the same shorthand: context, zone, retest, reaction, entry, stop, target, outcome.
Demand Zone Example:
A market in a clear uptrend pulls back into a fresh demand zone aligned with the higher-timeframe trend. The first retest produces a sharp rejection candle. Entry triggers near the proximal line, stop sits just beyond the distal line, target sits at the next supply zone. Ultimately, the price reaches the target cleanly.
Supply Zone Example:
A downtrending market rallies into a fresh supply zone against the dominant trend. Rejection shows up fast, entry triggers on confirmation, stop sits above the distal line, and price runs to the next demand zone below.
Failed Zone Example:
A demand zone forms mid-range, away from any real structural extreme. Price returns, stalls briefly, then closes decisively through the zone instead of reacting. The setup invalidates.
An Example With No Trade:
A technically clean-looking zone sits directly beneath a major opposing zone, leaving almost no room to target. Despite looking at the textbook, the correct call is to skip it entirely.
Supply and Demand Zone Invalidation
A supply and demand zone stops being valid once prices move decisively through it.
Wick Through vs Decisive Break - A quick wick beyond the distal line, followed by a snap back, isn’t the same as a full candle closing beyond it. The close matters more than the wick.
Acceptance Beyond the Zone - When price trades through a zone and stays there instead of reversing, that’s acceptance, a sign the zone has genuinely failed.
What to Do After Invalidation - A broken zone often flips roles; an old demand zone can become new supply, and vice versa. Watching for that shift beats ignoring the break entirely.
Supply and Demand Zone Checklist

Before entering, you should not miss running through this checklist:
- Strong, clear departure from the base.
- Short, tight base structure.
- Zone still fresh, not over-tested.
- Aligns with higher-timeframe structure.
- Price has actually returned to the zone.
- Confirmation signal present, not a blind entry.
- Invalidation level clearly defined.
- Target set at the next opposing zone.
- Risk-to-reward ratio acceptable.
- Zone sits in a meaningful location (but definitely not mid-range).
- Enough room before the opposing zone.
- Clear plan for what happens if price accepts beyond it.
- No trading based on the zone alone, without confirmation.
Risk Management Around Zones
A measured risk management around a zone starts with the zone itself, not a fixed dollar figure decided beforehand.
Define Risk Before Entry: Zone width sets the stop distance, and that stop distance sets position size. A wider zone means a wider stop, which means a smaller position to keep risk consistent.
Consider the Opposing Zone Before Setting a Target: A target picked in isolation, without checking where the nearest opposing zone actually sits, risks aiming for a level price never realistically reaches.
Market Conditions and Supply/Demand Zones
So, it is important to know that zones don’t behave identically in every market condition:
Trending Markets: Demand zones tend to work best in an uptrend and supply zones work best in a downtrend, since price is already leaning that direction.
Ranging Markets: Zones at the actual boundaries of the range carry more weight here, while zones sitting mid-range deserve extra caution and often chop.
High-Volatility/Event Conditions: Around major news or unusually volatile stretches, zones are tested and broken more aggressively than they would in calmer conditions.
Common Supply and Demand Trading Mistakes
A handful of habits undo otherwise solid zone analysis:
- Treating every zone as automatically tradable.
- Ignoring the available room to the next opposing zone.
- Redrawing a zone's boundaries after it fails, just to make it fit.
- Re-entering a zone simply because it worked once before.
- Mistaking a zone for a guaranteed reversal.
- Ignoring the broader market regime entirely.
- Reading meaning into random price action that isn't actually there.


Trading Competition
Free Prop Firm ChallengeHow to Combine Supply and Demand With Other Confluence?
Combining supply and demand zones with other confluence is recommended because a zone doesn’t work in isolation but shows its best alongside other evidence.
- Market Structure - A break of structure near the zone adds real weight.
- Volume - A volume spike at the departure supports genuine institutional involvement.
- Liquidity - A prior sweep of highs or lows before the move adds context.
- Price Action Confirmation - A clean rejection candle at the zone strengthens the case.
- Fair Value Gaps - An FVG sitting inside the zone can reinforce it.
Confluence supports a decision, but it never guarantees one.
Why Does Supply and Demand Work in Any Market?
The underlying idea, unfilled orders leaving a footprint, applies across forex, stocks, indices, commodities, and crypto alike, since every market runs on the same basic order-book mechanics.
What Changes Between Markets?
Liquidity, volatility, trading sessions, event risk, and the typical timeframe worth trading all shift from one market to another, even while the core concept stays the same.
Wrapping Up
After a detailed discussion over supply and demand zones, there’s one common conclusion. Mastering this area of trading requires you to see beyond simple support and resistance to understand institutional order flow. You, as a trader, can identify high-probability reversal and continuation setups effectively by systematically drawing precise boundaries, ranking zone freshness, validating multi-timeframe context, and enforcing strict risk controls.
Frequently Asked Questions
Supply and demand zones are price bands marking institutional order imbalances where aggressive buying or selling creates sudden price expansion.
Identify a sharp price departure, locate the consolidation base, and enclose it between proximal and distal boundary lines.
The strength comes from explosive departure velocity, a brief base, freshness (untested state), higher-timeframe alignment, and adequate profit target room.
It starts at the proximal line (inner boundary near current price) and ends at the distal line (outer wick boundary).
A decisive close beyond the distal line invalidates the zone, signalling a market regime shift and a potential role reversal (zone flip).
Avoid trading in over-tested zones, weak departures, choppy ranges, higher-timeframe trend conflicts, compressed target clearance, or major news events.
The main difference is that supply/demand zones capture the entire consolidation base, while order blocks isolate the single last opposing candle before breakout.
The main difference is that supply & demand zones mark origin reaction bases, but Fair Value Gaps represent 3-candle price imbalances formed during departure.

Handa nang maglapat ng disiplinadong panganib sa crypto? Galugarin ang mga bagong instrumento ng crypto ng Audacity Capital at dalhin ang iyong diskarte sa pangangalakal.
Matuto PaNewsletter
Sumali sa aming newsletter.
Sumali sa Aming Social Community

Simulan ang Iyong Paglalakbay Ngayon Gamit ang Aming Libreng Pagsubok
Ipagmalaki ang iyong mga kasanayan at tagumpay sa pamamagitan ng mga sertipiko at makakuha ng pagkilala para sa iyong pagsusumikap at dedikasyon mula sa mga potensyal na mamumuhunan at kasamahan.
Libreng PagsubokMga Kaugnay na Artikulo
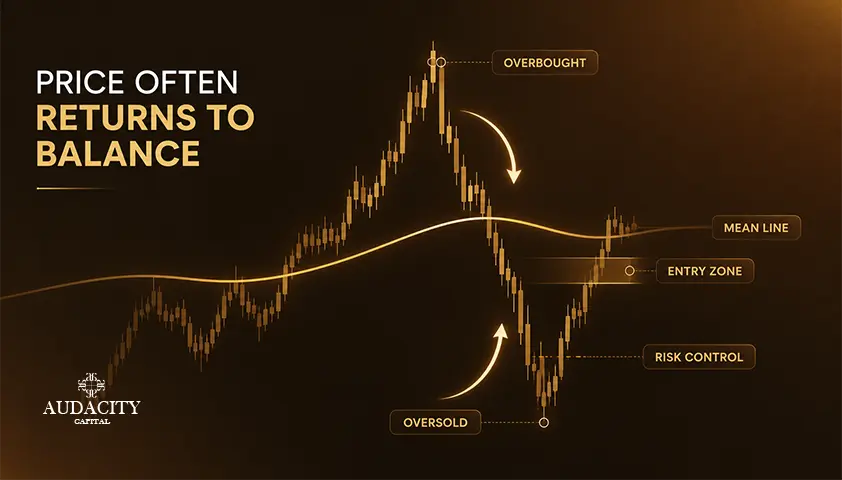
Mean Reversion Trading Strategy Explained (2026)
Prices that stretch too far tend to snap back to an average, but only in the right market. Learn the tools, the setup, and the trend risk.

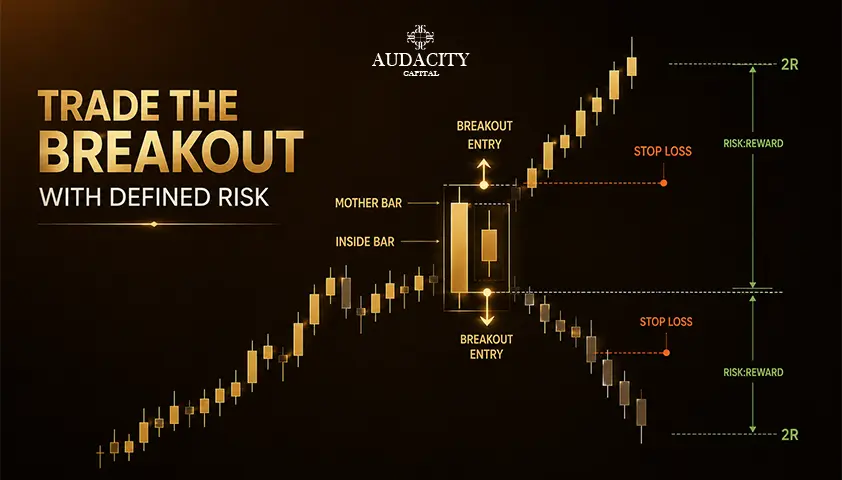
Inside Bar Trading Strategy: Rules, Entries and Risk Guide
Master the inside bar trading strategy with practical rules for pattern identification, entry triggers, stop placement, risk management, and testing.

ICT Silver Bullet Strategy: Windows, Setup and Execution Rules
The ICT Silver Bullet windows, the setup step most guides skip, entry and stop rules, and what the published win rates rest on.
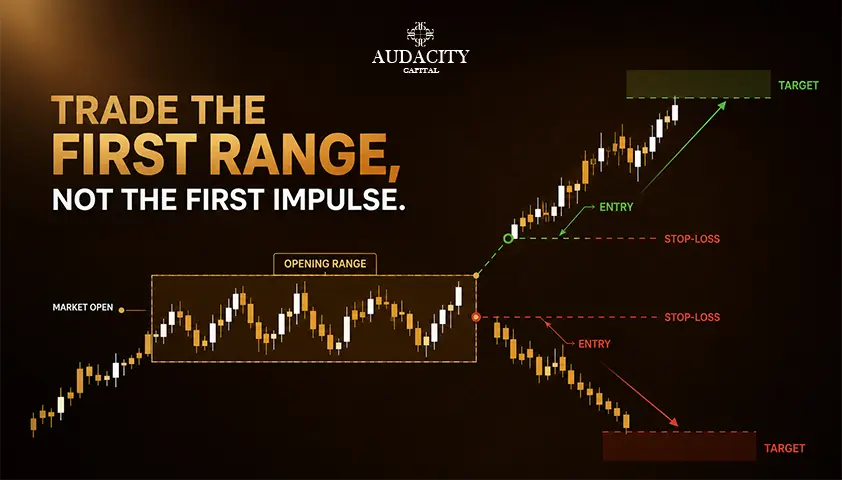
Opening Range Breakout Strategy: Rules, Setups and Examples
Learn how the opening range breakout strategy works, including ORB rules, 5, 15 and 30-minute setups, entry signals, stop losses and risk management.