


Bull Flag Pattern: A Comprehensive Guide


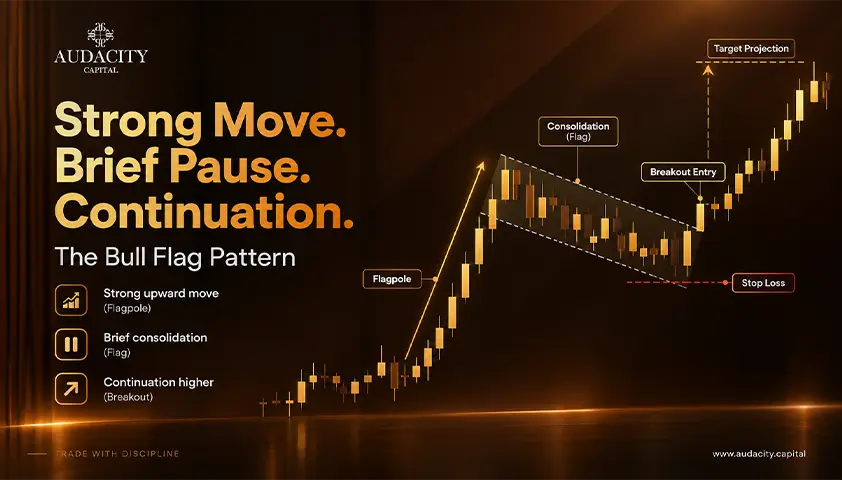
Traders like the bull flag pattern because it hands them three decisions from the chart alone: where to enter, where to place a stop, and where to aim.
That structure is exactly why it deserves to be understood properly rather than repeated from memory.
This guide covers the whole pattern: anatomy, identification, the trade itself, and what the research actually shows. Along the way it fixes the two errors that follow this pattern across the web, namely how to define the flagpole outside the stock market and what the published statistics really say.
What Is a Bull Flag Pattern?
A bull flag is a continuation pattern that forms inside an uptrend.
Price makes a sharp advance, called the flagpole, then enters a short, orderly consolidation that drifts slightly downward or moves sideways within parallel boundaries, called the flag.
Once that pause resolves, price breaks out and resumes the original move. That sequence is the entire bull flag pattern meaning in one sentence.
The psychology behind it runs in three beats: impulse, digestion, continuation. The pole reflects buying strong enough to overwhelm the supply available at those prices.
The flag is early buyers taking partial profits while traders who missed the initial move wait for a pullback rather than chase.
The breakout is those waiting buyers stepping back in, which pushes price out of the consolidation and onward.
The Three Parts, and the Warning Sign in Each
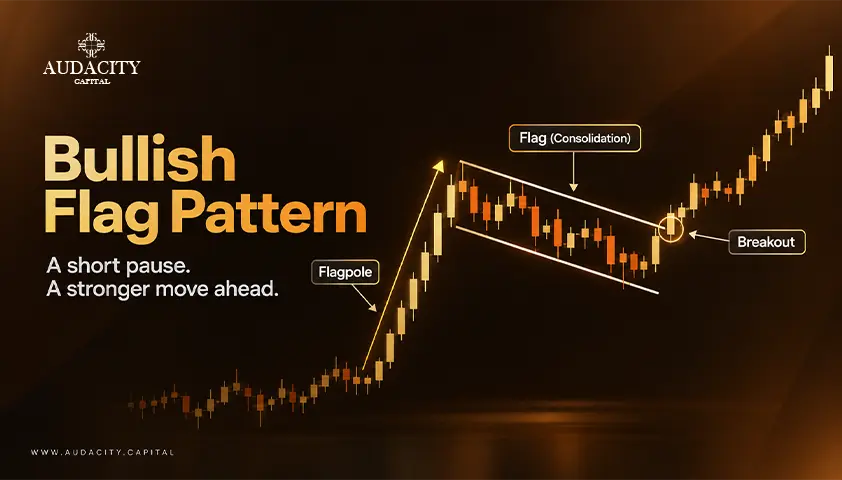
The pole.
A sound flagpole is a sharp, decisive move with expanding activity. The warning sign is a gradual, grinding advance.
That is a trend, not an impulse, and it does not produce the same setup or the same follow-through.
The flag.
A sound flag is a tight, orderly pullback inside a narrow channel, with activity declining as it forms. Two things should make you doubt it.
First, a pullback that retraces a large share of the pole, which several practitioners read as a move that has lost control. Second, activity that rises during the flag rather than falls, which points to active selling rather than resting.
The breakout.
A sound breakout is a close above the upper boundary with activity picking up. The warning sign is a break on thin participation, or one that immediately falls back inside the flag.
On how deep the flag can retrace, practitioner guidance varies between sources, commonly landing somewhere around a third to a half of the pole.
Treat that as practitioner guidance rather than a fixed rule, and note that different sources draw the line in different places.
Part | What a sound one looks like | What should make you doubt it |
Flagpole | A sharp, decisive advance with rising activity | A slow grind higher rather than an impulse |
Flag | A tight, orderly drift in a narrow parallel channel | A deep retracement or rising activity during the pullback |
Breakout | A close above the upper boundary as activity picks up | A break on thin participation, or an immediate return inside |
How Big Should the Flagpole Be?
At least one widely read page defines the pole as a gain of 10 to 20%. That is a stock-market convention.
On a major currency pair, a move of that size would be historic, so a trader applying it to forex will simply never find a valid flag.
The better approach measures the pole against how the instrument normally moves, not against a fixed percentage.
A useful lens is a volatility measure such as average true range. A pole that covers several times the instrument's typical range over a short span is a genuine impulse on that instrument, whatever the percentage happens to be.
In practice, calibrate against your own instrument and timeframe. Look back through its history and note what a genuinely sharp move looks like there.
That becomes your reference point, and it will not match any figure published for stocks.
Bull Flag, Pennant, Wedge or Channel?
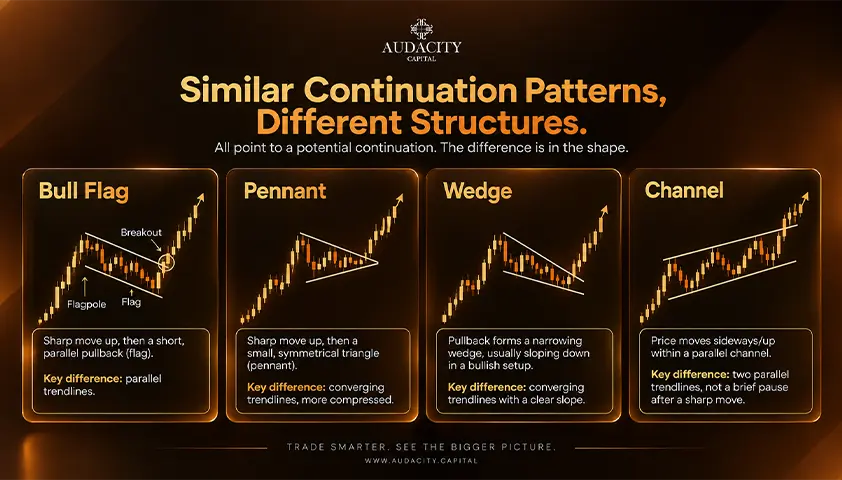
Four formations look similar and are traded differently.
A bull flag consolidates between parallel boundaries that slope slightly against the trend.
A bull pennant consolidates between converging boundaries, forming a small symmetrical triangle, and is otherwise traded much like a flag.
A rising wedge also has converging boundaries, but it slopes upward and is commonly read as bearish rather than bullish, which makes it the dangerous one to misread.
A channel is a longer, larger structure with no preceding impulse, so it is not a pause in a move but the move itself.
The consequence of a wrong label differs by case. Confusing a flag with a pennant changes very little. Confusing a flag with a rising wedge means taking the opposite side of the trade the structure is suggesting.
Formation | Shape of the boundaries | Slope | Common reading |
Bull flag | Parallel | Slightly down or flat | Bullish continuation |
Bull pennant | Converging | Roughly symmetrical | Bullish continuation |
Rising wedge | Converging | Upward | Commonly bearish |
Channel | Parallel, larger and longer | Either direction | Trend structure, not a pause |
Entry, Stop and Target
Three decisions in order, each with its trade-off attached. Once you know how to trade a bull flag mechanically, the discipline is in applying the same definitions every time.
Entry.
The conventional trigger for a bull flag breakout is a close above the flag's upper boundary. Some traders enter on an intrabar break instead, taking a better price and accepting more false signals in exchange.
Waiting for the close avoids some of those false signals but costs part of the move. Both are valid, provided you know which cost you are paying.
Stop.
The conventional placement sits below the flag's low, because a move below it means the consolidation failed. A tighter alternative sits below the most recent swing low inside the flag.
That reduces risk per trade but raises the chance of being stopped out on ordinary noise. This is the essence of stop loss placement: closer stops cost less when wrong and fail more often on nothing.
Target.
The measured move target projects the height of the pole upward from the breakout point. What competing pages rarely mention is that sources disagree on where the pole starts, and a different starting point produces a materially different target.
Pick one consistent definition, such as the start of the impulsive move, and apply it every time rather than choosing whichever start produces the prettiest number.
Before entering, compare the distance to target against the distance to stop. A flag whose stop is wider than its projected move is not worth taking, however clean it looks.
Note: Any figures here are illustrative only, and this guide recommends no risk percentage, position size, or account allocation.
What the Research Actually Shows
Here is the key fact, verified directly at thepatternsite.com (checked November 2024). Thomas Bulkowski, whose research is the most widely cited source on chart pattern performance, does not assign a performance rank to standard flags.
He measures a flag's performance against the short-term price swing rather than from the breakout to the ultimate high, which is how he measures most other patterns.
That different basis is why the average rise he reports for flags looks small.
The error worth correcting follows from that. Because the measurement basis differs, a flag's average rise cannot be compared with the figures quoted for patterns such as head and shoulders.
Secondary sites routinely set the two side by side and conclude that flags perform poorly, or quote them the other way to claim flags are strong. Both comparisons are invalid. They measure different things.
The research does draw one useful distinction: tight flags, with heavily overlapping price bars and a horizontal drift, tend to resolve better than loose ones that meander. Treat that qualitatively.
If you want a figure, verify it yourself at the primary source rather than trusting percentages presented as success rates on secondary pages, which are frequently pulled from the older book rather than the current site.
Signs a Bull Flag Is Failing
Use this while a trade is live, and read each sign as evidence rather than certainty.
- The flag retraces deeper than your own threshold for the pattern.
- Activity during the consolidation rises instead of falling.
- The flag extends much longer in time than the pole took to form, which suggests the impulse has dissipated.
- Price breaks above the flag and then quickly returns inside it.
- Price breaks below the flag's low, which invalidates the setup outright.
A failed flag is information, not just a loss. When a bullish setup breaks down instead of up, the traders positioned for the upside become forced sellers, which is why a busted pattern can precede a sharp move in the opposite direction.
Conclusion
The bull flag chart pattern gives you a clean structure for joining a trend with defined risk, and that structure is genuinely useful. Its reputation for reliability, though, rests largely on statistics that are misquoted or out of date, and on a flagpole definition that only works on stocks.
A trader who calibrates the bullish flag pattern to their own instrument and treats it as a setup rather than a signal will use it far better than one who trusts the headline claims.
Here is one concrete thing to do before trading it. Go back through your instrument's history, identify what a real impulse looks like there, and mark every flag that formed after one.
Record how each is resolved. That produces the only reliability figure that actually applies to what you trade.
Note: For anyone trading flags on very short timeframes: the firm's trading guidelines treat positions held for two minutes or less as prohibited scalping, so factor that into your entries. The pattern does not improve your odds of passing an evaluation, and most retail traders lose money.
Frequently Asked Questions
There is no single best timeframe, because the pattern forms on all of them. Shorter timeframes produce far more formations and far more noise. Higher timeframes produce fewer and cleaner ones. Match the choice to how much noise you can filter reliably.
A flag should be short relative to the pole that preceded it. The consolidation is a pause, not a new phase. If it lasts much longer than the pole took to build, it is usually no longer behaving like a flag and the impulse has probably faded.
A bear flag is the mirror image of the bull flag. It is a sharp decline followed by a slight upward drift inside a parallel channel, read as a bearish continuation. Everything in this article applies in reverse, including the entry, stop, and target logic.
A flag that breaks below its low is commonly called a busted pattern. Traders positioned for the upside are suddenly forced sellers, and that unwinding can produce a sharp move lower. This is descriptive, not a recommendation to trade the breakdown.
The volume signature works differently on currency pairs. The forex market is decentralised with no central record of traded volume, so platforms display tick volume, which counts price updates rather than size. Treat the volume story in most bull flag guides as a rough tempo reading rather than confirmation on currency pairs.

Kriptoya disiplinli risk uygulamaya hazır mısınız? Audacity Capital'in yeni kripto enstrümanlarını keşfedin ve ticaret stratejinizi getirin.
Daha Fazla BilgiBülten
Yeniliklerden haberdar olmak için bültenimize katılın.
Sosyal Topluluğumuza Katılın

Bugün Yolculuğunuza Başlayın Ücretsiz Denememizle
Becerilerinizi ve başarılarınızı sertifikalar aracılığıyla gururla sergileyin ve potansiyel yatırımcılardan ve akranlarınızdan sıkı çalışmanız ve özveriniz için takdir alın.
Ücretsiz Denemeİlgili Makaleler

Spread Betting vs CFD Trading
Spread betting vs CFD trading for UK traders: how each is priced, the real tax difference and its conditions, expiry costs, and which suits which trader.

Double Top Pattern: How to Trade It
Learn how to identify, confirm, and trade a valid double top pattern with precise targets and stops.

Prop Firms With No Minimum Trading Days
Prop firms with no minimum trading days compared, with evaluation rules, payout conditions and who each one suits.
What Is BOS in Trading? A Complete Guide to Break of Structure (2026)
Learn what BOS in trading means, how Break of Structure works, how to identify bullish and bearish BOS, and how traders use it in market analysis.