



What Is Consolidation in Trading? A Complete Guide for 2026


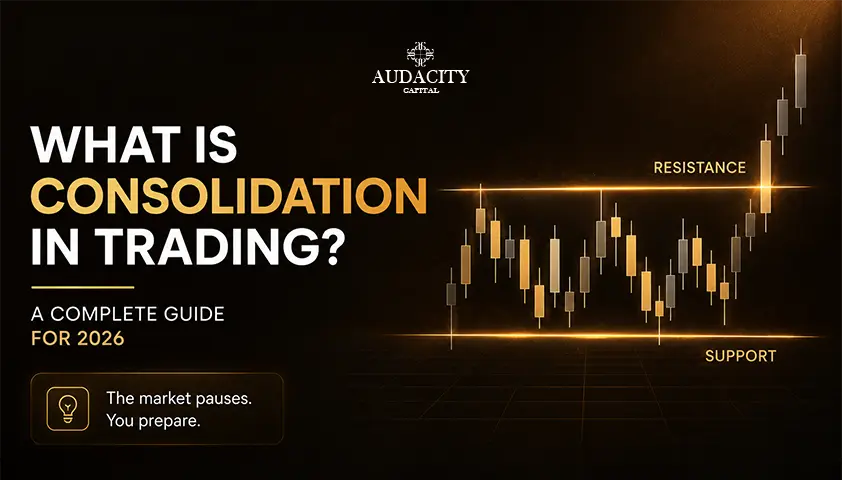
Consolidation in trading is a period when an asset's price moves sideways within a defined range instead of trending higher or lower. During this phase, buyers and sellers are evenly matched, causing price to fluctuate between support and resistance until a breakout or breakdown determines the next market direction. |
|---|
Introduction
Markets don't trend all the time. In fact, they spend a surprising amount of time moving sideways while traders wait for the next major catalyst. This phase is known as consolidation in trading, and understanding it can help you avoid low-quality trades and prepare for the next significant price move.
If you've ever wondered what is consolidation in trading, the answer is simple: it is a temporary pause where price trades within a defined range because buyers and sellers are in balance. While consolidation itself is neither bullish nor bearish, recognising it early allows traders to manage risk more effectively and prepare for potential breakout opportunities. In this guide, you'll learn what consolidation is, why it happens, how to identify it on a chart, and the most common ways traders approach these market conditions.
What Is Consolidation in Trading?
Consolidation is a period where price moves sideways within a fairly defined range instead of trending clearly higher or lower. Price gets trapped between a ceiling, which acts as resistance, and a floor, which acts as support, and it bounces between the two without making meaningful directional progress.
The contrast with a trend makes it clearer. In an uptrend, price carves out higher highs and higher lows. In a downtrend, it prints lower highs and lower lows. In consolidation, that structure disappears. The highs stop climbing, the lows stop falling, and you get a rough horizontal band instead of a staircase. What you are looking at is a temporary balance between buyers and sellers, where neither side has enough conviction to take control.
The single most important thing to understand is that consolidation is neutral on its own. It is not bullish and it is not bearish. It is a pause, not a prediction. The direction of the next big move depends on where price eventually breaks out and what the broader trend around it was doing. A consolidation that forms in the middle of an uptrend often leads to more upside, while one that forms inside a downtrend often leads to further weakness. But the range itself is just the market catching its breath.
Consolidation also has no fixed duration. It can last a handful of candles on a lower timeframe or stretch across weeks and months on a daily or weekly chart. The length depends on the asset, the timeframe, and what is happening in the wider market. A quiet holiday period, the hours before a major economic release, or the lull between two trading sessions can all produce it.
Why Does Consolidation in Trading Happen?
Consolidation usually appears for a reason, and knowing the reason helps you anticipate it rather than being surprised by it.
The most common trigger is a strong preceding move. Price runs hard in one direction, then stalls as the market digests what just happened. Traders who caught the move start banking profits, which creates selling pressure in an uptrend or buying pressure in a downtrend. At the same time, new participants who missed the move begin positioning for the next one. Those two forces roughly cancel out, and price goes flat while the market sorts itself out.
Indecision is the other big driver. When buyers and sellers genuinely disagree about what an asset is worth, or when they are all waiting for the same piece of information, nobody wants to commit. You see this constantly ahead of scheduled events: a central bank decision, an inflation print, an earnings release, or a major geopolitical development. Volume tends to thin out, ranges tighten, and price hovers because everyone is waiting for the same catalyst to tell them what to do.
Session timing plays a part too. Liquidity ebbs and flows across the trading day, and quieter windows naturally produce tighter, more range-bound conditions. The gap between the New York close and the Asian open is a classic example, as is the mid-session lull before the London and New York overlap fires up. Price often consolidates in these quieter windows simply because there are fewer participants pushing it around.
How to Spot Consolidation in Trading
You do not need fancy tools to identify consolidation in trading, but a few reliable signals help you confirm what you are seeing.
The first and most obvious is repeated touches of the same levels. If price bounces off roughly the same floor two or three times and gets rejected from roughly the same ceiling two or three times, you have a range worth respecting. The more clean touches on each side, the more reliable the boundaries. A single touch is a maybe. Three or more touches on both sides is a proper range.
The second signal is contracting or flat swing structure. When the higher highs and higher lows of a trend flatten out into a sideways band, or when the swings start getting smaller and tighter, price is consolidating. Your eye can usually pick this out before any indicator does.
Volume is the third clue, and it is a good one. Consolidation typically comes with declining or below-average volume. The market is quiet because participation has dropped. That matters later, because a genuine breakout is usually accompanied by a noticeable pickup in volume, which is one of the cleaner ways to tell a real move from a fake one.
Some traders lean on tools like Bollinger Bands, which visibly squeeze together when volatility drops, or the Average True Range, which falls during quiet periods. These are optional. The core skill is reading price structure directly, and the tools simply confirm what the chart is already telling you.
Common Consolidation Patterns
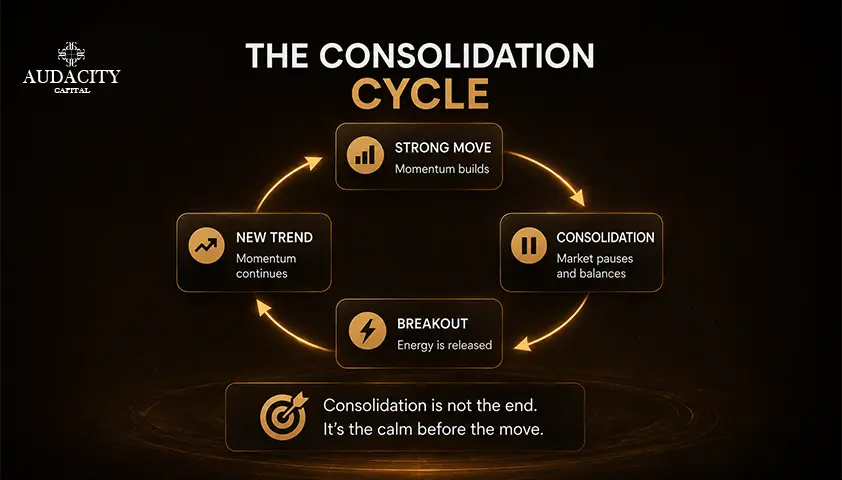
Consolidation shows up in a handful of recognisable shapes. They all express the same underlying idea, which is price compressing before it expands, but each has a slightly different character.
Rectangles are the cleanest form. Price bounces between a horizontal support and a horizontal resistance, forming a box. This is the textbook range, and it is the easiest to trade because the boundaries are obvious.
Triangles form when the range narrows as it goes. An ascending triangle has a flat top and a rising bottom, which often hints at building buying pressure. A descending triangle has a flat bottom and a falling top, which often hints at building selling pressure. A symmetrical triangle narrows from both sides and is more neutral about which way it will break.
Flags and pennants are short, sharp pauses that appear after a strong move. A flag looks like a small rectangle that tilts against the prior trend, while a pennant looks like a tiny triangle. Both tend to be brief and typically resolve in the direction of the move that came before them.
Wedges slope in one direction while narrowing. A rising wedge drifts upward but often resolves downward, and a falling wedge drifts downward but often resolves upward, which makes them a bit more nuanced than the others.
You do not need to memorise every variation. What matters is recognising that price is compressing, marking the boundaries, and being ready when it expands again.
How the Range Resolves: Continuation vs Reversal
Every consolidation eventually ends, and it ends in one of two ways.
A continuation is when price breaks out in the same direction as the trend that preceded the range. This is the more common outcome, which is why so many traders treat consolidation as a "rest stop" within an existing trend. The market pauses, absorbs the previous move, then carries on in the same direction. Flags, pennants, and ranges that form in the middle of a strong trend frequently resolve this way.
A reversal is when price breaks out against the prior trend. The consolidation turns out to be a turning point rather than a pause, and the market changes direction. Reversals are less frequent but more dramatic, and they often catch out traders who assumed the trend would simply continue.
The practical takeaway is that you should not assume the direction in advance. Some patterns lean one way, but a range is only truly resolved once price commits. The broader trend gives you a bias, and the breakout gives you the answer. Trading the bias before the breakout confirms it is one of the more expensive habits a trader can pick up.
There is also a rough rule of thumb worth knowing: the longer and tighter the consolidation, the more powerful the eventual breakout tends to be. Energy builds up while price coils, and when it finally releases, the move can be sharp. That is why experienced traders often pay closer attention to a market that has been quiet for a long time, rather than dismissing it as boring.
The False Breakout Problem
If there is one thing that punishes traders around consolidation, it is the false breakout. It deserves its own section because it is that common and that costly.
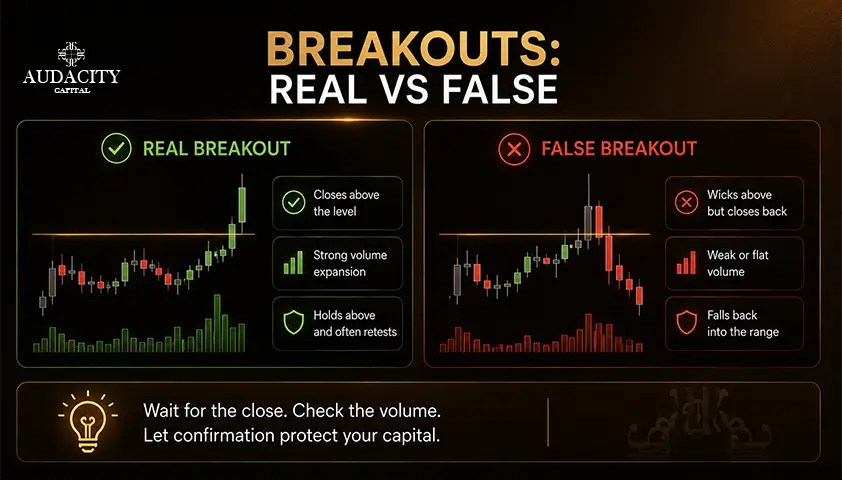
A false breakout happens when price pokes beyond the range boundary, tempts breakout traders into entering, and then snaps straight back inside the range. Anyone who jumped in on the initial move is now offside, and their stops often become fuel for the reversal.
These fakeouts are not random. They tend to cluster around obvious support and resistance because that is exactly where orders pile up. Breakout traders place entry orders just beyond the boundary, and traders inside the range place protective stops just beyond it too. That cluster of orders is a magnet. A brief spike through the level can trigger a cascade of activity, and if there is no real momentum behind it, price simply drifts back in once those orders are filled. In modern markets, algorithmic activity around these levels can make the effect even sharper.
So how do you avoid getting trapped? The most reliable filter is waiting for a confirmed close beyond the range rather than reacting to the first spike. A candle that pushes through the level with only its wick, then closes back inside, is a warning sign, not a signal. A candle that closes decisively beyond the level with a strong body is far more trustworthy.
Volume is the second filter. A genuine breakout usually comes with a noticeable expansion in volume as more participants commit to the move. A breakout on flat or below-average volume is more likely to fade. Put simply, look for the close beyond the level and the volume behind it before you believe the move.
Some traders add a third layer by waiting for a retest. Instead of entering the moment price breaks out, they wait for it to come back and defend the broken level, so old resistance becomes new support or old support becomes new resistance. A successful retest gives you a better entry price, a tighter stop, and fewer false signals. The trade-off is that not every breakout offers a retest, so this more patient approach will cause you to miss some moves entirely.
Two Ways to Trade Consolidation in Trading
There are broadly two schools of thought when it comes to consolidation in trading, and they suit different temperaments.
Range trading means working inside the box. You buy near support, sell near resistance, and take your profit as price travels back across the range. This approach can work well while the range holds, but it comes with a warning. The profit potential on each trade is small because you are trading the width of the range, and you need clean, well-defined boundaries with several touches on each side to do it with any confidence. Trading a messy, uneven range where the highs and lows are all over the place is mostly guesswork, and your stops and targets end up sitting on thin air.
Breakout trading means sitting on your hands until price commits, then trading the move that follows. Breakout traders assume consolidation is preparing for expansion, so they wait for a confirmed close outside the boundary before entering. Done well, this catches the meaningful moves and avoids the chop entirely. The cost is patience, because not every range produces a clean breakout, and the discipline to skip the ones that do not qualify is what makes or breaks this style.
Neither approach is inherently better. Range trading gives you more frequent, smaller opportunities inside a well-behaved range. Breakout trading gives you fewer, larger opportunities but demands more waiting. Many traders end up favouring one based on their personality, their timeframe, and the market they trade. What matters is picking an approach, defining your rules clearly, and executing them consistently rather than switching between the two on a whim.
A Worked Example
Numbers make this concrete, so here is a simple walkthrough using a breakout approach on a hypothetical currency pair. The figures are illustrative, and the point is the method, not the specific levels.
Suppose a pair has been ranging for several sessions between support at 1.0800 and resistance at 1.0850, giving a range that is 50 pips tall. Price has touched each boundary three times, so the range is clean and worth respecting.
You decide to trade a bullish breakout. Rather than entering the moment price pokes above 1.0850, you wait for a full candle to close above resistance with a strong body and a visible pickup in volume. That close is your confirmation. Say price closes at 1.0855.
For your stop, you place it back inside the old range, at a level price should not revisit if the breakout is genuine, for example just below the broken resistance at around 1.0835. That is roughly 20 pips of risk from your entry.
For your target, a common method is to project the height of the range from the breakout point. The range was 50 pips tall, so you project 50 pips up from the breakout to land around 1.0905. That gives you 50 pips of potential reward against 20 pips of risk, a reward-to-risk ratio of 2.5 to 1, which clears the threshold most traders want before committing.
If price had merely wicked above 1.0850 and closed back inside the range, you would have stood aside and avoided the false breakout entirely. That is the whole discipline in miniature: define the range, wait for the confirmed close, size the trade so the maths works, and let the ones that do not qualify pass by.
Consolidation and Funded Account Trading
Consolidation carries a particular significance if you are trading a funded or evaluation account, where the goal is steady, controlled progress rather than heroics.
Sideways markets are where a lot of funded traders quietly do damage to their accounts. When the chart offers no clear direction for a long stretch, the urge to "do something" builds up, and that boredom often leads to overtrading. Every time price nudges a boundary, there is a temptation to jump in, and each of those low-quality trades chips away at the balance through spread, commission, and small losses. In an environment with daily loss limits and drawdown rules, a run of impatient trades in a choppy range can end a challenge that a bit of patience would have preserved.
The healthier way to treat consolidation on a funded account is as a filter rather than an opportunity to force. Quiet, directionless conditions are often a signal to trade smaller or to stand aside and wait for a clean setup, rather than a signal to trade more. The traders who pass evaluations and hold onto funded accounts tend to be the ones who can sit through the dead periods without feeling compelled to act.
If you trade with a specific prop firm, it is worth checking that firm's current rules on daily loss limits, drawdown models, and consistency before you build a plan around trading ranges, since these parameters vary between firms and change from time to time.
Common Consolidation Trading Mistakes to Avoid
A few recurring errors catch traders out around consolidation, and most of them are avoidable.
The first is entering on the first spike beyond the range instead of waiting for a confirmed close. This is the fast track to being caught in a false breakout. Patience for the close is not optional.
The second is ignoring volume. A breakout without a pickup in participation often fades, and traders who skip the volume check regularly find themselves on the wrong side of a fizzling move.
The third is trading a messy range. If the highs and lows are uneven and the boundaries are unclear, your stops and targets are guesswork. Stick to ranges with clean, repeated touches on both sides.
The fourth is setting stops too tight. Volatility often expands right after a breakout, and a retest of the boundary is normal. A stop placed too close to the entry gets clipped by that routine retest before the real move even begins. Give the trade a sensible amount of room based on the structure, not on how much you wish you could risk.
The fifth, and maybe the most common, is overtrading out of boredom. A quiet range is not an invitation to trade constantly. It is often a reason to trade less. Recognising when to stand aside is a genuine edge.
Key Takeaways
- Consolidation is a sideways phase where price ranges between support and resistance instead of trending, reflecting a temporary balance between buyers and sellers.
- It is neutral on its own. The direction of the next move depends on where price breaks out and what the wider trend is doing.
- It usually forms after a strong move, during indecision ahead of major events, or in quieter, lower-liquidity sessions.
- Spot it through repeated touches of the same levels, flattening swing structure, and declining volume.
- Ranges resolve as either a continuation of the prior trend or a reversal against it, and the longer and tighter the range, the sharper the eventual breakout tends to be.
- False breakouts are the main risk. Wait for a confirmed close beyond the range, look for expanding volume, and consider waiting for a retest before committing.
- You can trade the range from the inside or trade the breakout from the outside. Pick one, define clear rules, and execute consistently.
- On a funded account, treat quiet ranges as a filter, not a licence to overtrade. Patience protects the account.
FAQ
Neither by itself. Consolidation is a neutral pause. It only takes on a directional meaning once price breaks out, and the broader trend around it gives you a bias for which way that is more likely to go.
Wait for a full candle to close beyond the range rather than reacting to the first spike, and look for a noticeable increase in volume behind the move. A break on a wick alone, or on flat volume, is far more likely to fail. Some traders also wait for a successful retest of the broken level for extra confirmation.
The usual culprit is overtrading. Ranges tempt traders into taking too many low-quality trades, and the spread, commissions, and small losses add up. Trading less, waiting for clean setups, and standing aside during messy conditions usually helps.

Kriptoya disiplinli risk uygulamaya hazır mısınız? Audacity Capital'in yeni kripto enstrümanlarını keşfedin ve ticaret stratejinizi getirin.
Daha Fazla BilgiBülten
Yeniliklerden haberdar olmak için bültenimize katılın.
Sosyal Topluluğumuza Katılın

Bugün Yolculuğunuza Başlayın Ücretsiz Denememizle
Becerilerinizi ve başarılarınızı sertifikalar aracılığıyla gururla sergileyin ve potansiyel yatırımcılardan ve akranlarınızdan sıkı çalışmanız ve özveriniz için takdir alın.
Ücretsiz Denemeİlgili Makaleler
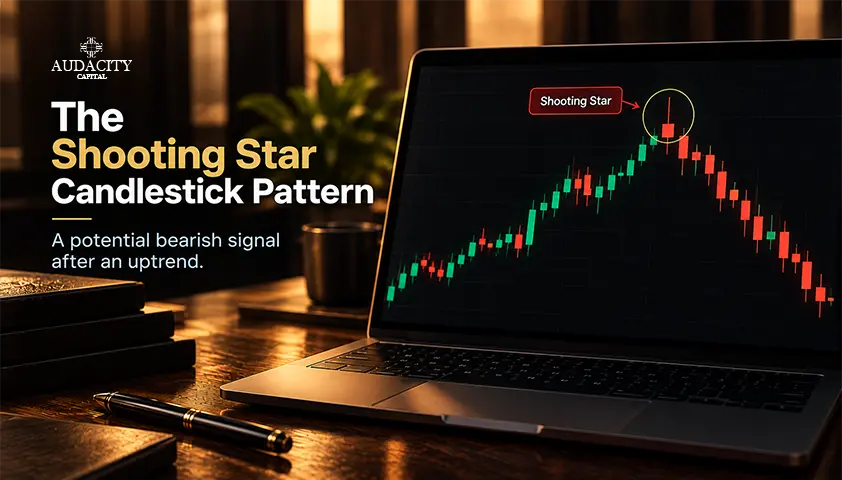
All About the Shooting Star Candlestick Pattern – Learn to Decode It
Learn what the shooting star candlestick pattern means, how to identify it, confirm bearish reversal signals, and manage trading risk.

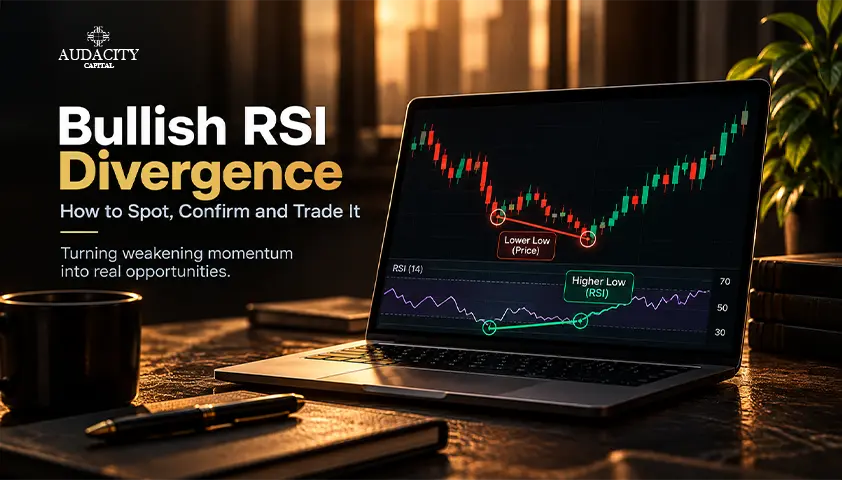
Bullish RSI Divergence: How to Spot, Confirm and Trade It
Learn how to identify bullish RSI divergence, confirm reversal signals, choose entries, set stop losses, and manage risk effectively.
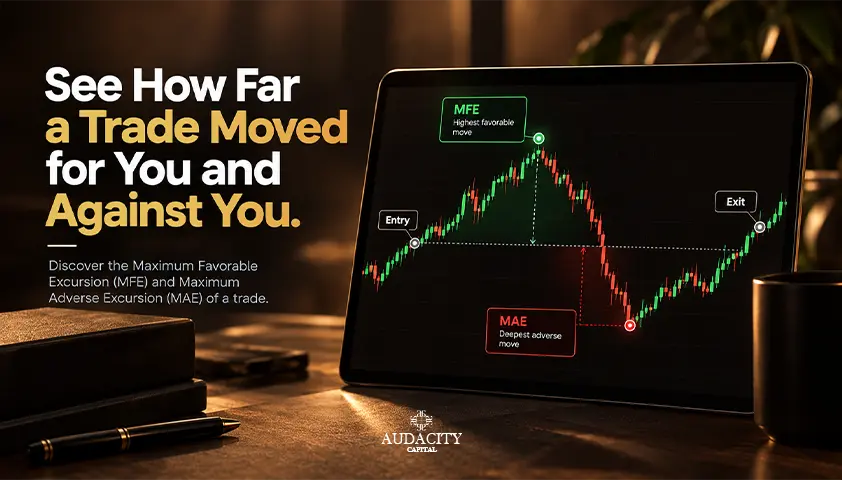
Maximum Favorable Excursion: How MFE and MAE Read a Trade
Learn how Maximum Favorable Excursion and MAE reveal a trade's best and worst open moves, exit giveback, and possible entry or exit problems.

Sharpe Ratio: Formula, Calculation, Uses and Limitations
Learn how the Sharpe ratio works, how to calculate it, what a good score means, and where it can mislead investors, portfolios, and trading strategies.