


Walk-Forward Analysis in Trading: A Practical Guide


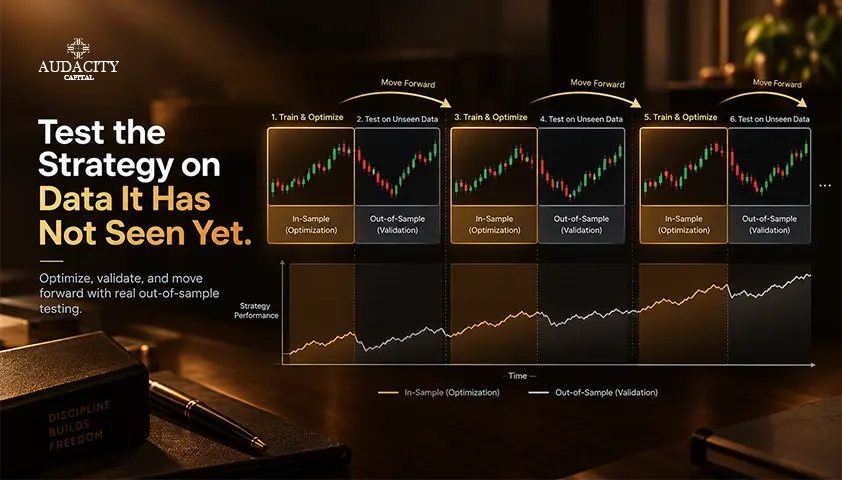
A strategy can look excellent across one long backtest and then fade once trends, volatility, or liquidity shift. Walk-forward analysis asks a harder question: could a scheduled process of choosing parameters on past data keep working in the next segment it had not yet seen?
This guide covers a clear definition, the step-by-step process, rolling and anchored windows, a worked example, an evaluation checklist, and the method's limits. Historical tests do not guarantee future results, and trading involves risk of loss.
What Is Walk-Forward Analysis
Walk-forward analysis (WFA) is a time-ordered validation method. It optimizes a strategy on an in-sample window, freezes the selected parameters, and tests them on the next out-of-sample window. The windows then move or expand forward, and the cycle repeats.
In WFA trading research, the method tests two things at once: the trading rules and the proposed recalibration schedule. Because results are measured across several periods, it can show whether performance persists or depends on one favorable sample.
Every segment in a completed analysis is still historical. The procedure imitates a sequence of decisions that could have been made at each window boundary.
That is useful, but it is not a live forward test, because no new market data arrives after the research is finished.
The terms walk-forward testing, walk-forward validation, and walk-forward optimization are often used loosely. In this guide, "analysis" means the full repeated process.
"Walk-forward optimization" means the parameter selection that happens inside each training window.
How Walk-Forward Analysis Works
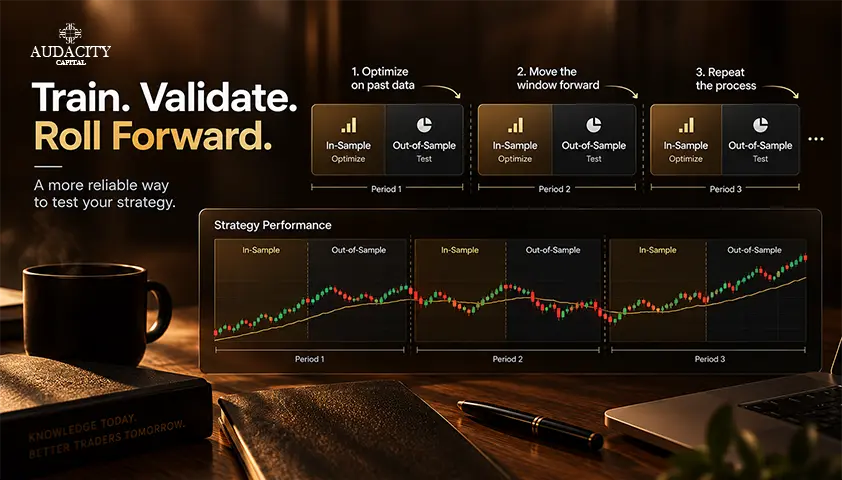
The process is simple to describe and demanding to execute well. Here is how to perform walk-forward analysis in six steps:
Step 1: Define everything first.
Order the data chronologically. Set the strategy rules, parameter ranges, objective function, cost assumptions, and acceptance rules before examining any test results. The objective function is the score the optimizer tries to maximize, such as net profit or a risk-adjusted ratio.
Step 2: Optimize on the first in-sample window.
Select a parameter set using the training data only. Where the research design supports it, prefer a stable region of acceptable values over one isolated peak.
Step 3: Freeze and test.
Apply the chosen parameters to the immediately following out-of-sample window. Do not tune anything inside that test segment.
Step 4: Step forward.
Move or expand the training window by the planned step size. Repeat the optimization and test on the next chronological segment.
Step 5: Stitch the test segments.
Join each out-of-sample segment once to form the walk-forward result. Exclude in-sample returns from the validation curve, and avoid overlapping test segments that count the same period twice.
Step 6: Review the whole and the parts.
Check aggregate performance and each individual window. A profitable total can hide one severe failure. A smooth curve can also come from too few trades to support any conclusion.
Rolling vs Anchored Walk-Forward Analysis
A rolling walk-forward analysis keeps the training window at a fixed length. Each step drops the oldest observations and adds newer data. This rolling window design emphasizes recent conditions, but it may discard rare market regimes that still matter.
An anchored walk-forward analysis keeps the original start date and extends the training end date at every cycle. This expanding window uses more history over time.
The trade-off is that older regimes can dominate the objective as the sample grows.
Tie the choice to the strategy logic and the recalibration schedule you would actually follow. You can test reasonable alternatives, but only under a protocol declared in advance.
Picking the best window design after viewing the results adds another layer of optimization, and another route to overfitting.
Design | Training window | Main benefit | Main risk |
Rolling | Fixed length and moves forward | Focuses on recent data | Drops older but relevant regimes |
Anchored | Fixed start and expands forward | Uses growing history | Old data can dominate |
Walk-Forward Analysis vs Backtesting and Forward Testing
Four validation methods often get confused. A standard backtest applies fixed rules to historical data. A single holdout split uses one training period and one test period.
Walk-forward analysis repeats chronological training and testing. Paper trading or a live forward test observes data that arrives after the rules are frozen.
Method | Data timing | Parameter updates | Primary question |
Standard backtest | Historical period | None or fixed before run | How did fixed rules behave historically? |
Single holdout | Historical train then test | One selection before test | Did the model generalize once? |
Walk-forward analysis | Repeated historical train and test windows | At scheduled boundaries | Did the full recalibration process persist? |
Paper or live forward test | New data after research | Only under the frozen plan | How does the strategy behave going forward? |
Walk-forward testing is usually more demanding than a single split because the strategy must hold up across several test periods. It has a weakness, though.
If you review those test periods repeatedly during research and adjust the strategy each time, they stop being independent evidence. This is a form of data snooping.
How to Set Up a Walk-Forward Test
1. Fix the Rules First
Freeze the market universe, entries, exits, position sizing, parameter ranges, and data-cleaning rules. Where relevant, record how you handle corporate actions, missing values, session boundaries, and delisted instruments.
2. Choose the Objective Before Running Cycles
Return alone can favor strategies with unstable risk. If you use a risk-adjusted or multi-constraint objective, write down its formula and a minimum trade count. Do not switch objectives after seeing which one produced the best history.
3. Size the Windows to the Strategy
There is no universal window ratio. Base the training and test lengths on holding period, trade frequency, seasonality, and how quickly you expect regimes to shift. Both segments need enough trades to interpret. A popular ratio is not evidence that it fits your strategy.
4. Match Step Size to Recalibration
The step size should mirror your planned update schedule. A three-month test window implies the model stays fixed for three months before the next update in the historical simulation.
5. Model Costs and Execution
Include commissions, spread, slippage, financing, borrow constraints, and realistic fills where they apply. Parameter changes can increase turnover, so recalculate transaction costs inside every out-of-sample segment.
6. Control Leakage
Use only information available at each simulated decision time. Lag indicators and external data correctly to avoid look-ahead bias. If labels or positions span a split boundary, apply a gap or purge rule so future outcomes cannot enter the training set. Chronological windows alone do not stop data leakage.
7. Keep a Final Holdout
Reserve an untouched final period, or run a later paper test. Once you change the strategy in response to a walk-forward result, those historical test windows no longer count as fully unseen evidence. Out-of-sample testing only works while the sample stays out of the research loop.
How to Evaluate Walk-Forward Results
Aggregate Result
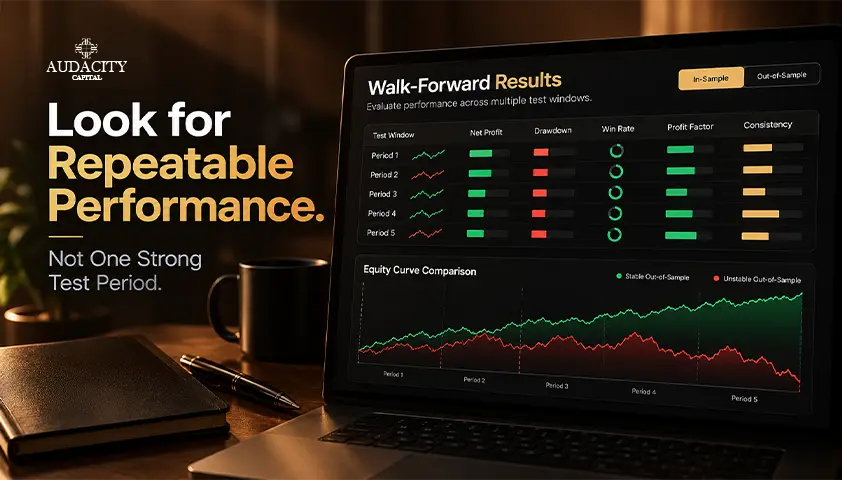
Review net return or expectancy, drawdown, volatility, risk-adjusted return, turnover, and trade count for the stitched out-of-sample curve. Expectancy is the average result per trade after costs. Use the same formulas and cost assumptions in every window. For a full treatment of peak-to-trough decline, see our Maximum Drawdown guide.
Window Consistency
Show the spread of results across test windows. Count profitable and losing windows, find the worst one, and compare drawdown and trade count between them. One exceptional quarter should not hide repeated small failures.
Performance Degradation
Some decline from in-sample to out-of-sample results is expected, because the parameters were fitted to training data. Severe or erratic performance degradation can signal overfitting, weak economic logic, or an execution assumption that breaks outside the training window.
Parameter Stability
Plot the selected values by cycle. Values that stay within a neighborhood are often more reassuring than jumps between unrelated extremes. Parameter stability alone does not prove profitability.
Benchmarks
Compare the process with fixed parameters, a simple benchmark, and a few reasonable alternative schedules under identical costs and risk rules. Do not search dozens of schedules and report only the winner.
Walk-Forward Efficiency
If you use this metric, define the numerator, denominator, and annualization method. Tools calculate it differently, so an unexplained pass threshold means little.
Common Walk-Forward Analysis Mistakes
- Choosing window sizes after seeing the full result. The window design becomes one more optimized parameter.
- Using future data. Leakage can hide in features, labels, instrument membership, or fill logic, even inside chronological windows.
- Reusing test segments until the strategy passes. Repeated feedback turns test data into research data.
- Mixing in-sample and out-of-sample returns in one headline curve. Validation claims should come from the stitched test segments only.
- Ignoring costs and turnover. Frequent recalibration changes positions and can erase a small gross advantage.
- Judging only the total. One regime, instrument, or quarter can drive apparent success while other windows fail.
Walk-forward analysis trading research reduces some forms of overfitting, but it cannot remove them. It cannot predict a regime change, repair a weak premise, or guarantee that the next period will resemble any historical window.
When Walk-Forward Analysis Is Useful
The method fits best when a strategy has tunable parameters, enough chronological data, and a plausible update schedule. It is especially relevant if your live process would re-optimize at fixed intervals, as many EA and systematic workflows do.
It may add little when there are no parameters to update, when each window produces too few trades, or when the data cannot cover several market conditions.
In those cases, fixed-rule testing followed by a genuine forward test may be easier to interpret.
Treat it as one layer of evidence. Economic logic, data quality, execution realism, risk limits, and ongoing monitoring still matter.
Conclusion
The sequence is straightforward: define the process, optimize on past data, freeze the parameters, test the next segment, repeat, and combine only the out-of-sample results.
Predeclare your windows and costs, protect a final holdout, and paper-test the process before risking capital.
Frequently Asked Questions
It is a validation method that selects strategy parameters on one historical window, then tests that frozen choice on the next unseen historical window. The process moves forward repeatedly, and only the test results are combined.
An ordinary backtest usually applies one fixed rule set across a single span of history. Walk-forward analysis simulates repeated parameter selection and testing across several chronological cycles, measuring whether the full recalibration process holds up.
There is no universal length. Base it on the strategy's holding period, trade frequency, seasonality, and expected recalibration rate. Both the training and test windows need enough observations and trades to produce interpretable results.
It compares out-of-sample performance with in-sample performance. Formulas and annualization methods differ between tools, so define the exact calculation before interpreting any figure or relying on a pass threshold.
No. It can expose instability and reduce reliance on one data split. Leakage, repeated reuse of test windows, window selection after the fact, and broad parameter searches can still overfit the history.

Kriptoya disiplinli risk uygulamaya hazır mısınız? Audacity Capital'in yeni kripto enstrümanlarını keşfedin ve ticaret stratejinizi getirin.
Daha Fazla BilgiBülten
Yeniliklerden haberdar olmak için bültenimize katılın.
Sosyal Topluluğumuza Katılın

Bugün Yolculuğunuza Başlayın Ücretsiz Denememizle
Becerilerinizi ve başarılarınızı sertifikalar aracılığıyla gururla sergileyin ve potansiyel yatırımcılardan ve akranlarınızdan sıkı çalışmanız ve özveriniz için takdir alın.
Ücretsiz Denemeİlgili Makaleler
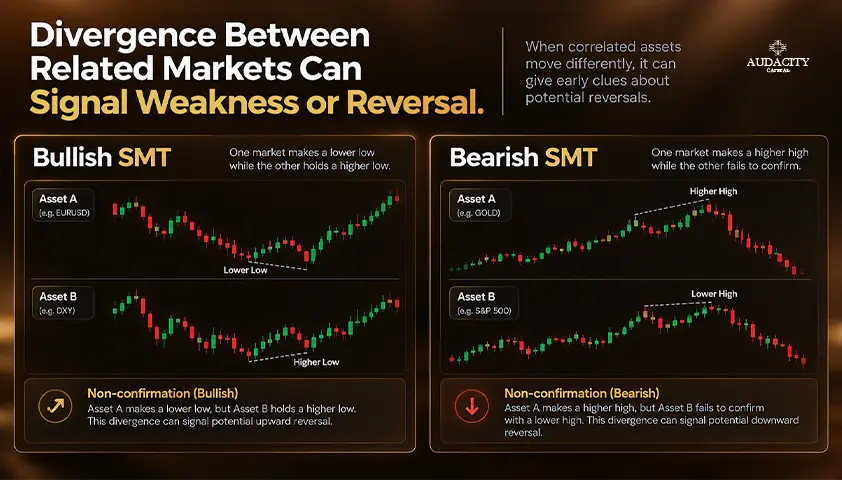
SMT Divergence in Trading: Bullish and Bearish Examples
Learn what SMT divergence means, how bullish and bearish setups form, which markets traders compare, and how to confirm signals and manage risk.

RSI Divergence: A Complete Guide to Spotting and Trading Momentum Shifts
Learn what RSI divergence is, explore bullish, bearish and hidden divergence, and discover how to identify, confirm and trade RSI divergence.
Wyckoff Method Explained: Phases, Rules and Examples
Learn the Wyckoff Method, its three laws, accumulation and distribution phases, trade examples, and the limits of price and volume analysis.
Market Profile Trading: How to Read TPO Charts
Learn Market Profile Trading with TPO charts, value area, POC, initial balance, day types, practical examples, and risk controls.