


Average Daily Range (ADR): How to Use It for Trading


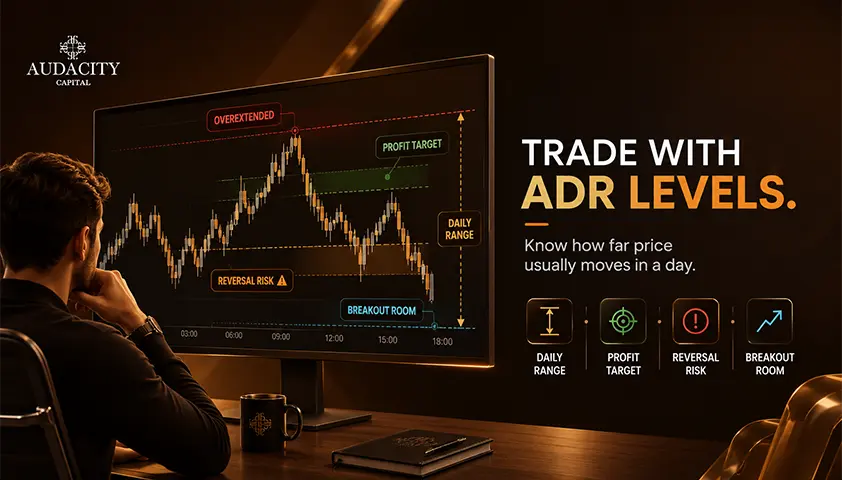
Every trading day has its own rhythm, and Average Daily Range is a simple way to measure it. ADR tells you how far an asset usually moves from its daily low to its daily high during a chosen number of past sessions. It is a magnitude indicator, not a directional one.
Traders use ADR to estimate the daily market volatility and set realistic targets for intraday trading. It also allows them to determine if the new setup still has the potential to move further. Properly used, ADR will ensure realistic entries, stops and targets for the session.
What Is Average Daily Range (ADR)?
ADR is a historical average of completed daily high-low ranges. It is a measure of an instrument's movements during a session, not the direction of the next move.
A simple example makes this clear. For instance, there is a stock with an ADR of $4; that means the price of this stock in recent sessions has moved approximately $4 from its session low to session high. This does not necessarily mean the next session will move exactly $4; neither does it indicate in which direction the session will move.
Why should this interest intraday traders? Two similar setups can have very different prospects.
One may be formed after 30% of the usual range has been used, and another after 110%. In the first case there is some room. The second one requires more work from the session. ADR lets you quantify this difference.
How Is Average Daily Range Calculated?
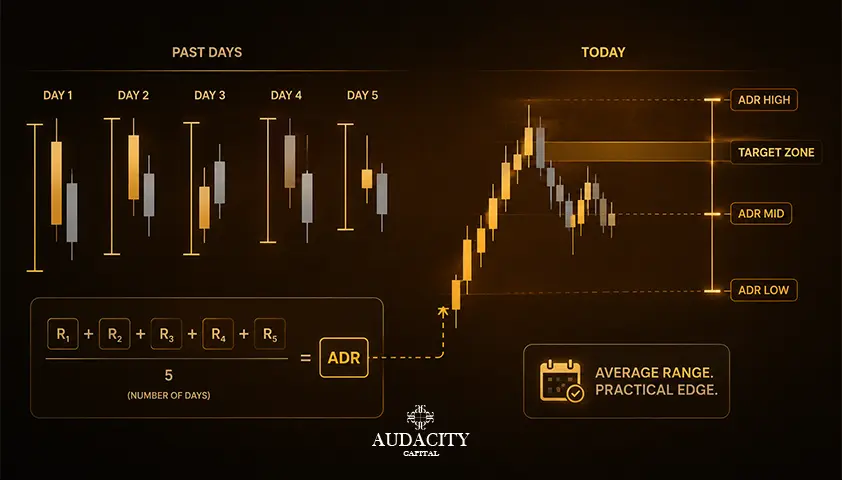
The average daily range is easy to calculate. Take the difference between the daily high and daily low for each completed day and average those numbers over the chosen lookback period.
Here's a neat 5-day example:
Day | Daily Range |
1 | $2.80 |
2 | $3.20 |
3 | $3.00 |
4 | $3.50 |
5 | $2.50 |
Total = $15.00. Divide by 5 sessions: ADR = $3.00.
The choice of lookback period is essential. A 5-day lookback reacts quickly to changes in volatility, but an odd number of sessions will have a large effect on the reading.
A larger lookback period like 20 days will smooth out the result, but it will lag behind during changes in volatility regimes. This may occur when the stock shifts from a quiet consolidation phase to earnings-driven expansion.
Common lookback periods are 5, 10, 14 and 20 days. There is no "right" lookback period. Consider the lookback as something to be tested on the instrument and your holding period. Don't blindly follow a default setting.
Average Daily Range vs ATR: What Is the Difference?
There is frequent confusion between ADR vs ATR, since these two indicators seem to be alike and are usually shown on the same charts. These indicators cannot be used interchangeably.
Feature | ADR | ATR |
Core input | Daily high − daily low | True range, accounting for gaps from the last close |
Question it answers | How far does the market usually travel within a day? | How much price movement has there been, over the selected period of bars? |
Common use | For setting context to intraday range and realistic targets | Stop losses, volatility-based risk management |
Timeframe scope | Daily | Any timeframe |
ADR does not consider overnight gaps as it is calculated using only the daily high-low range. ATR considers gaps through true range. So, if an equity opens sharply above the previous close, the ATR may produce a larger volatility reading than the actual daily range.
The two indicators actually perform different tasks. While ADR gives context to that day's range, ATR is great for sizing stops based on volatility and risk management. In continuous trading markets like forex and crypto, gaps are typically smaller. Even so, ADR and ATR measure different things and cannot replace one another.
How to Read ADR During the Trading Day
Three distinct values need to be distinguished here. Confusing these values is a common source of ADR mistakes.
- Historical ADR. The historical average of daily trading ranges over a selected lookback period. It is your benchmark.
- Current daily range. The current day's high minus the current day's low.
- Consumed ADR. The current daily range divided by historical ADR, expressed as a percentage.
When historical ADR is $4.00 and today’s range is $2.00 so far, the consumed ADR is 50%. When today's range is already $4.40, then the ADR consumed is 110%.
If the ADR consumed is low, it implies that the session has not consumed much of its recent average range and has plenty of room left for continuation of the trade. High ADR consumption indicates that price has moved very far compared to recent sessions.
This is an important point to remember here. The 100% ADR does not necessarily mean that the maximum is reached. There might be trading sessions that will go far beyond their historic average levels because of strong trend, news events and volatility. Therefore, take 100% ADR as a historic average level, and not a ceiling for expansion.
How to Use Average Daily Range for Entries, Targets and Stops
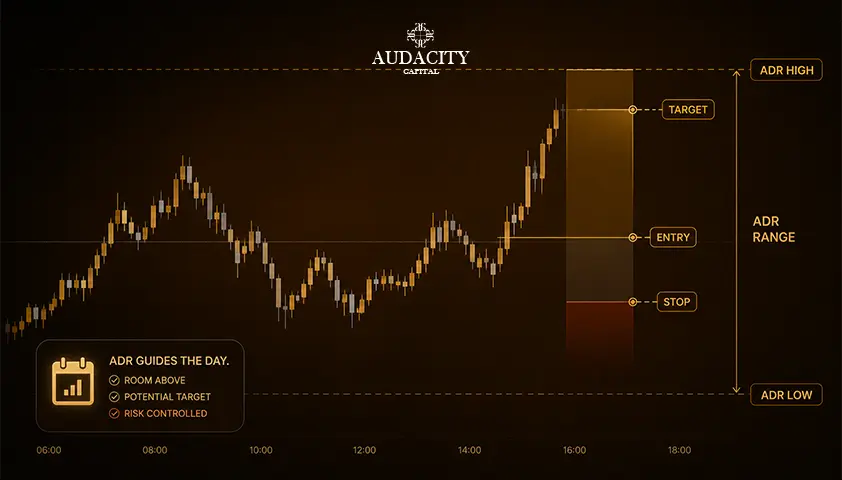
When designing an ADR trading strategy, base your approach on making decisions rather than getting signals. ADR is a context filter and not a trigger.
1. Entries.
Use ADR to prevent yourself from chasing the pattern when a significant part of the day’s typical range has already been consumed. Having a breakout after 90% ADR consumption requires more justification than having one at 30%. At that point, the trade needs the session to expand beyond its usual range.
2. Profit targets.
Make sure that your take-profit objective is consistent with the room left in the current average range. Another range expansion may be possible in a late-session, but it should be justified, with a strong trend or an expected catalyst. A take-profit level that is within normal range of movement is easier to clear by the market.
3. Stops.
ADR can help in providing the context of daily volatility, but the stop loss objective should be set at the level of market structure invalidation. Do not automatically set your stop at the ADR percentage point; set it at a swing low, session highs/lows, and the structural level.
4. Breakouts and range expansion.
Exceeding 100% ADR does not trigger a fade. When a market accepts price action beyond this level with the aid of trend and volume, the appropriate response might be to get out of mean-reversion trades and not fight the range expansion. Range expansion days do occur. Through ADR, you are able to identify them instead of letting them fade.
Average Daily Range Trading Example
Assume a stock has a 10-day ADR of $5.00.
At 1:00 p.m., the session's high-low range is $3.75, meaning 75% of ADR has been exhausted. You get a new long setup, where the target needs an additional $2.50 of upside action.
This is how the calculation looks like mathematically:
Metric | Value |
Historical ADR (10-day) | $5.00 |
Today's current range | $3.75 |
ADR consumed | 75% |
Planned additional move to target | $2.50 |
Implied total daily range if target is reached | $6.25 (125% of ADR) |
Achieving that target would mean today’s entire range being 25% higher than the current average. This can be done on a trend day or with a catalyst. The important thing is to know what range you require before you initiate a trade.
The trade isn't requesting an average action, it's requesting range expansion. If there's no obvious sign for an expansion day, the target might need a bit trimming or the trade may not be worth it this far into the session.
Common Mistakes When Using ADR
ADR is simple and therefore can be easily abused. The following are seven pitfalls to avoid in using ADR.
1. Using 100% ADR as a daily price extreme: It is simply an average from the past. The markets go above it all the time on an expansion day.
2. Thinking ADR boundaries are natural support and resistance zones: Projected ADR high and lows are only planning tools. They don't always have turning points.
3. Using ADR to forecast direction: ADR only measures range magnitude. Trend, structure, and order flow are the sources of direction.
4. Looking for late entries without confirming ADR consumption: It is a common late entry error to enter a breakout without a trigger at 95% ADR consumption.
5. Using the same lookback period on all instruments: A calm large-cap stock and a volatile small-cap stock may require different lookback periods. Test the setting rather than assuming one works for everything.
6. Confusing ATR with ADR or equating to the platform's projected bands as the ADR calculation itself: Historical average and projected bands are two different things. The way they calculate or present these can vary.
7. Not considering the event risks: Earnings, macro data releases, or any unforeseen news headline could render a good ADR reference useless in the short term. Please see your calendar before using the reference.
ADR is helpful as a context filter on top of a real entry and risk management framework.
How to Add ADR to a Trading Plan
Make ADR indicator your regular pre-market trading routine.
Step 1: Observe actual ADR reading and the selected lookback period.
Step 2: Calculate the current session's range and ADR consumption. Be specific with the percentage of the average range that has been used.
Step 3: Compare your target with the distance you have. Then ask: what is the range that is required to get to the target, and will it be reasonable in the current trend, volume and news?
Step 4: Take into account entry/exit with respect to market structure. Use ADR analysis as a filter to test if the trade is suitable for the session.
After each trade use one simple journal question: How many ADR were used when entering the trade and how many ADR beyond or within was the last session range?
As you make this process a habit over time, ADR becomes an input to your process that you can test.
Conclusion
Average Daily Range trading is considered most effective when it is viewed for what it is: an indicator of typical daily range and a standard for how much of it a particular session has already consumed. It neither predicts the future direction of price nor limits its movement.
The proper process is quite straightforward. Compare ADR with the current range and then assess if the target is achievable with respect to what remains of the trading session.
Take into account the market structure and the risk rules to make your final trading decision. Used this way, ADR helps sharpen judgment without becoming a signal generator.
Trading involves risk, and no individual tool can guarantee better performance. ADR is a context and planning tool that pays off if combined with a strict structure-based trading approach.
Frequently Asked Questions
There is no universal number. A useful ADR depends on the instrument's price, spread, liquidity, volatility, and the strategy being used. A $2 ADR can be excellent on a $30 stock and tight on a $500 stock, so evaluate ADR relative to price and cost, not as an absolute figure.
Use a period that reflects how quickly the instrument's volatility changes. Shorter lookbacks such as 5 or 10 days react faster to fresh conditions, while 14 or 20 days smooth the number and reduce noise. Test settings against the instrument and holding horizon rather than defaulting to one value.
It means the session's high-low range has matched the recent average. It is a reference point, not a maximum or a reversal signal. Price can continue moving through and past the level, especially on trend or news days.
Yes, and this happens regularly. Range expansion days, earnings, macro data, and volatility shocks routinely push sessions past 100% ADR. Treat the average as a baseline, not a limit.
Neither is better in absolute terms. ADR is well suited to intraday range context and target realism, while ATR is often more useful for volatility-adjusted stop-loss placement across different timeframes. Many traders use both for different jobs.
Divide today's current daily range by the historical ADR, then multiply by 100. If today's range is $3 and ADR is $4, ADR consumed is 75%. The number updates as the session high or low extends during the day.
Yes. The average daily range indicator works across any instrument with a defined daily session or a rolling 24-hour window. Continuously traded markets like forex and crypto need a consistent session or daily candle definition. Once that range is defined, the calculation stays the same.

هل أنت مستعد لتطبيق مخاطر منضبطة على العملات المشفرة؟ استكشف أدوات التشفير الجديدة من Audacity Capital واجلب استراتيجية التداول الخاصة بك.
اعرف المزيدالنشرة الإخبارية
انضم إلى نشرتنا الإخبارية.
انضم إلى مجتمعنا الاجتماعي

ابدأ رحلتك اليوم مع تجربتنا المجانية
اعرض مهاراتك وإنجازاتك بفخر من خلال الشهادات واحصل على تقدير لعملك الجاد وتفانيك من المستثمرين المحتملين والأقران.
تجربة مجانيةمقالات ذات صلة
Depth of Market (DOM) Explained: How to Read Market Liquidity
Master Depth of Market (DOM) trading. Learn to evaluate order book liquidity, track real-time price response, and refine your execution with practical DOM insights.

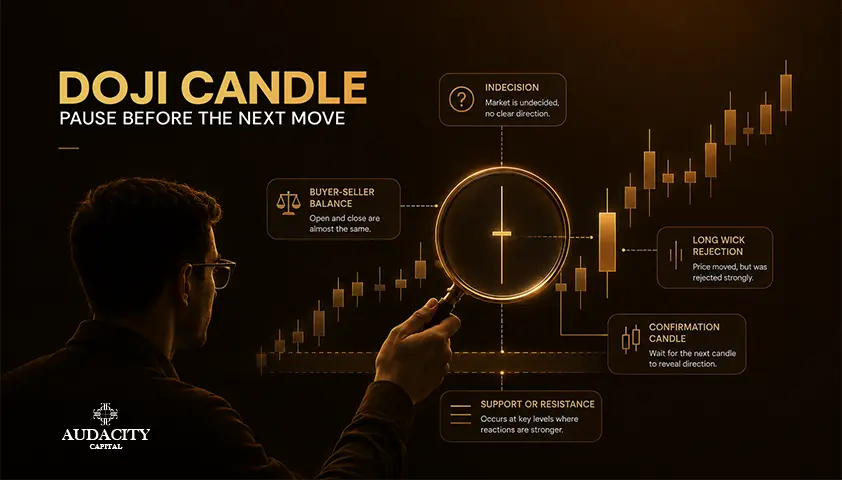
Doji Candlestick Pattern: How to Read, Confirm and Trade It
Spot market indecision and price rejection with the Doji candlestick pattern. Learn how to identify key types and use location and confirmation rules to assess market balance.
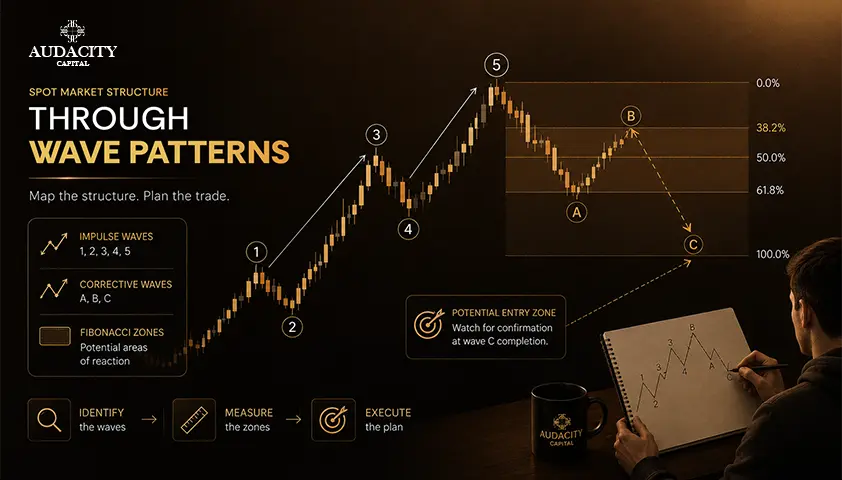
Elliott Wave Theory: How to Identify and Trade Wave Patterns
Learn how Elliott Wave Theory works, the three hard rules that invalidate an impulse count, key corrective patterns, Fibonacci guidelines, and how to build a risk-defined trade plan around a wave count.
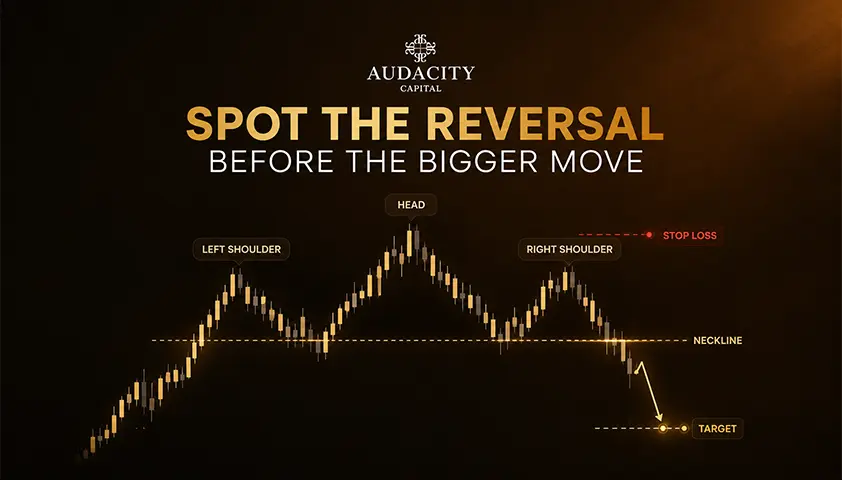
Head and Shoulders Pattern: How to Trade It
Learn the Head and Shoulders Pattern: how to spot it, draw the neckline, and trade the entry, stop, and target, plus how reliable it really is.