


Double Top Pattern: How to Trade It


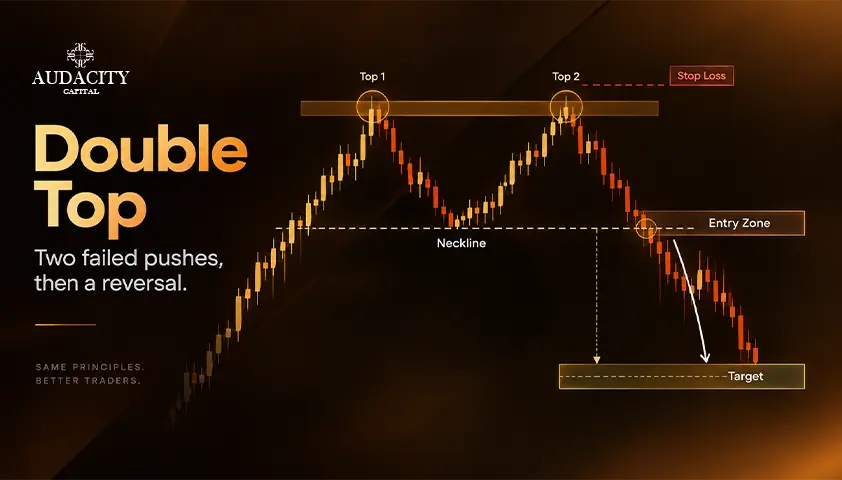
Every single guide about the double top pattern out there says essentially the same thing: find two peaks at roughly the same price level, see the M-shape, and call it a double top.
Identifying this pattern is simple enough. The difficult part is trading, as most of the formations that look like double tops never get confirmed.
This is the stance this article takes, and it is contrary to the majority of what you have read. Most of the formations resembling the double top pattern do not become one.
Today we will be discussing: how to differentiate between double tops and formations that never get confirmed.
What Is the Double Top Pattern?
A double top is a bearish reversal pattern comprising two identical peaks at around the same price level, separated by a trough, after an uptrend.
The structure on the chart resembles the letter M, and this is why traders also call it an M pattern. This is the standard double top pattern that will be mentioned in every broker knowledge centre.
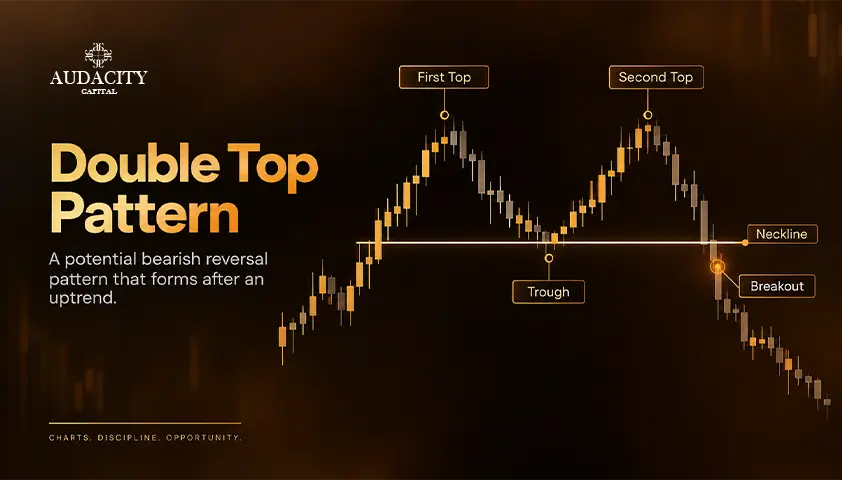
The formation is divided into four parts. There is the first peak, the intervening trough, the second peak, and the neck line which is the horizontal line drawn through the low point of the intervening trough.
Note this distinction as it will be followed throughout this article. Traders analyze the two peaks but it's the neckline which truly confirms the formation.
Traders pay attention to the tops but not the line that determines whether or not they have any trade.
The formation was originally identified by Edwards and Magee in their book Technical Analysis of Stock Trends, while its current performance studies have been carried out by Thomas Bulkowski.
How the Double Top Pattern Forms
It will be easier to remember the formation once the psychology of each part is associated with it, since it is actually a story about which side is in control.
In an established uptrend, price moves up until it reaches a level where supply emerges. Sellers step in, prices turn down and the first peak is set.
Buyers remain confident here, so they see the pullback as a buying opportunity and resume their push on price back to the previous high.
Here comes the critical juncture. An actual good trend moves through the old high and carries on doing so. This one does not. And that inability to hold above the resistance is the first bit of information the formation delivers.
Price turns down a second time. Sellers who missed the first swing now have proof that the level is there, and they take action.
One thing is worth repeating; this is where most traders make their mistake. The second peak doesn't necessarily indicate a signal.
It represents an unsuccessful attempt to make a new high. There are many failures in a trending market without any subsequent reversals. What makes a difference between the two is the breakdown of the neckline discussed further down.
The classical volume profile according to Edwards and Magee works like this: activity is usually heavy at the first peak, decreases when price falls back and is active into the second peak but does not reach the earlier high.
Consider this as a description of the standard case not as a rule. Volume data can be unavailable in some markets. Therefore, use it as additional information and not a criterion.
How to Identify a Valid Double Top
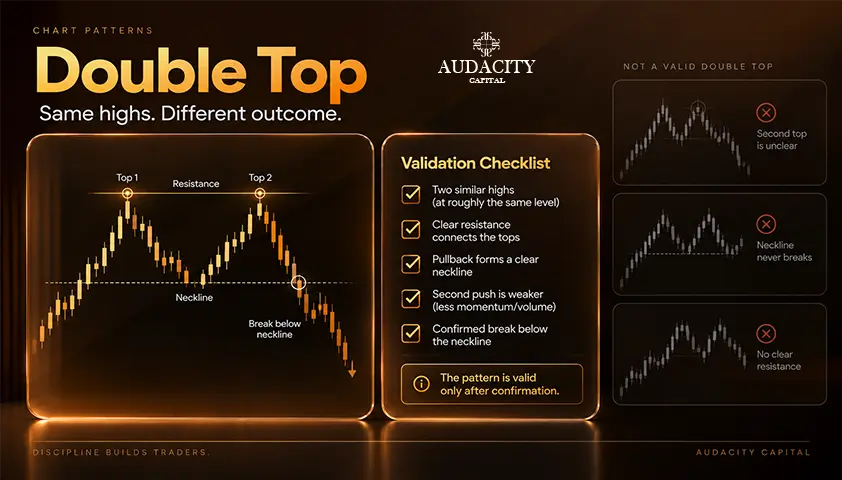
Consider the following criteria as a set of tests for rejecting a pattern, not for recognizing one.
1. A prior uptrend of real substance.
A pattern on top of a three-day bounce within a larger downtrend is not doing any reversal here. If it was a weak trend to be reversed, its failure really doesn't matter.
2. Adequate separation in time between the peaks.
Two highs a couple of bars away indicate a pause, not a change of control. The classical literature calls for a significant interval between the peaks.
Take this exact spacing as an indication from that source but not a rigid guideline, and verify it against the source before trusting it.
3. A margin for a peak’s height.
The two peaks must be sufficiently near each other to indicate that this is the same level measured twice and not a rising or falling series masquerading as a double top.
A significantly higher or lower second peak is a different configuration.
4. A trough of adequate depth.
The correction from the previous peak to the next one must have some substance to it. A trough that doesn’t fall far enough cannot be classified as a trough.
5. A neckline and support level that is obvious.
When you can easily draw the neckline, then you have more confidence in the validity of the pattern.
Choosing between a number of potential lines indicates that the market is not providing you with a distinct level.
This supports a valid double top | This should make you reject it |
A sustained, established uptrend before the first peak | A short bounce within a longer downtrend. |
A clear interval between the two peaks | Two highs only a few bars apart |
Both peaks testing effectively the same level | A clearly higher or clearly lower second peak |
A trough which is deep enough to actually reveal a retreat | A shallow pause with no real pullback |
A neckline that is easy to draw and obvious on the chart | A neckline you had to choose between several candidates |
The Confirmation Rule Most Traders Skip
Here's the rule: the pattern doesn't come into existence until the price closes under the neckline. Until then, you have a range with two touches of resistance.
Now, this is the proof that will completely change everything you've been taught. Bulkowski's research suggests that such formations do not confirm in most cases. In other words, the majority of twin-peaks do not break the neckline.
This is true no matter what the exact figure is. You've learned how to spot a formation that doesn't happen most of the time.
The closing below the neckline is what qualifies as confirmation; a price gap down below the neckline also does the trick.
The point behind closing is easy to understand: intraday breaks of visible levels happen often and tend to reverse on the same day. A wick that touches the neckline but ends up closing above it is a probe, not a breakout.
And now the trade-off, stated in its entirety and not just half of it. In waiting for the close, you are giving up part of the move, and when the break is sharp, you give up a large part.
This is not a choice between a good option and a bad one. This is a choice between early entry at significantly increased failure probability and late entry with proof.
Understand that you are making a choice, not following a free rule.
How to Calculate the Target and Place the Stop
The measured move target works like this.
Measure the vertical distance from the peaks down to the neckline. That is the pattern height.
Project that same distance downward from the point where price broke the neckline. That projection is your conventional double top pattern target.
Now the qualifier that belongs in the same breath as the method. Only around two thirds of confirmed patterns reach the full measured-move target.
That makes the target a reasonable objective, not an expectation. A trader who sizes a position around reaching the full target is planning around the less likely outcome.
For stop loss placement, the conventional level sits above the higher of the two peaks. A move above that level says the resistance did not hold and the premise of the trade is gone.
The practical consequence is that a tall pattern produces a wide stop. That is a position sizing problem to solve, not a reason to place the stop somewhere more convenient.
Finally, the risk reward ratio. Before entering, compare the distance to target against the distance to stop.
If the projected move down is shorter than the distance up to your stop, the setup does not offer enough room. It does not matter how textbook the shape looks. The arithmetic decides, not the appearance.
Step | What to measure | Worked example |
1. Peak level | The higher of the two peaks | 1,200 |
2. Neckline | The low of the trough between them | 1,100 |
3. Pattern height | Peak level minus neckline | 100 points |
4. Entry | Close below the neckline | Around 1,095 |
5. Target | Neckline minus pattern height | 1,000 |
6. Stop | Above the higher peak | Above 1,200 |
The Four Variants: Adam and Eve
Bulkowski classifies double tops by the shape of each peak, and the shapes do not perform identically.
An Adam peak is narrow and pointed, often a single sharp spike. An Eve peak is wide and rounded, taking longer to form. Since a double top has two peaks, there are four Adam and Eve variants: Adam and Adam, Adam and Eve, Eve and Adam, and Eve and Eve.
This matters because the combinations carry different statistics, and Bulkowski publishes separate figures for each.
Several secondary sites quote these figures with the variants mixed up, so do not rely on any page that repeats them second-hand.
The takeaway for the reader is straightforward: not every double top is the same trade. The standard explanation discards this entirely by treating every M as identical, and the shape of the peaks carries information that distinction throws away.

What the Data Says About Reliability
Four figures matter, and each must be verified at thepatternsite.com and stated with its variant and sample size:
- The break-even failure rate for confirmed patterns, which varies by variant and sits in the region of a fifth to a quarter.
- The share of confirmed patterns that reach the full measured-move target, which is around two thirds.
- Where the pattern ranks among bearish reversal patterns in Bulkowski's ordering, which is mid-table rather than elite.
- The confirmation-failure figure from the earlier section, restated here because it is the number that matters most.
Put those together into one honest sentence. A confirmed double top has a defined stop and a measurable target. That does not make it the near-certainty that phrases such as “reliable reversal pattern” can suggest.
A trader who internalises the gap between the pre-confirmation and post-confirmation numbers will trade the pattern better than one who only memorises its shape.
Do not average the variants into a single headline number. That is exactly how the commonly repeated seventy-five percent figure gets misused, and repeating it would waste the only advantage this page has.
The Pullback After the Break
After breaking below the neckline, price frequently returns to retest that level from underneath before continuing lower. The broken support becomes resistance.
This pullback and retest happens often enough to be the normal case rather than an exception. A trader who entered on the break and expected immediate follow-through will often see the position move against them first.
There are two ways to read the retest. For a trader who missed the break, it offers a second entry with a tighter stop, since the resistance is now closer overhead.
For a trader already positioned, it is the point at which a correct trade looks wrong. Both readings are valid, and the distinction between a genuine retest and a failed breakout is only clear afterwards.
If you cite a frequency figure for pullbacks, source it and state the variant it applies to rather than working from memory.
Advantages and Limitations
The genuine advantages are real. The pattern gives a well-defined trade structure. It has a specific entry trigger, a logical stop above the higher peak, and a calculable target from the pattern height.
Few setups hand you all three from the chart alone. It also appears across markets and timeframes and needs no indicator to read.
The limitations are equally real and worth naming without softening. Most candidates never confirm, so the base rate of the shape is misleading.
Identification is subjective, and two competent traders can draw different necklines on the same chart.
The stop on a tall pattern can be uncomfortably wide, which forces smaller size. The measured-move target is reached only about two thirds of the time. And by the time confirmation arrives, part of the move is already behind you.
Both halves of that picture are the pattern. Ignoring the second half is how traders talk themselves into setups the arithmetic does not support.
Conclusion
The double top pattern is not a shape to spot. It is a sequence to wait for, and the waiting is the part that separates traders who make money from it from those who do not.
Most formations that look like one never become one, and the ones that do announce themselves at the neckline, not at the second peak. Let that be the claim that stays with you.
Before you treat any twin-peak formation as a trade, run the rejection checklist. Then wait for a close below the neckline. Then calculate the target and the stop and compare them.
If the arithmetic does not work, the pattern being textbook does not change that. That is the whole method, in order, and none of the steps is optional.
Frequently Asked Questions
A triple top is the same idea with a third test of the same level. The extra test means the formation takes longer to build and the entry comes later, since price has to break the neckline after three touches rather than two.
In Bulkowski's ordering, the double top variants generally rank ahead of the triple top, though you should verify the specific ranking at the primary source before quoting it.
The structure is different. A head and shoulders has three peaks with the middle one highest, while a double top has two peaks at roughly the same level. The distinction is the height of the middle peak.
A double top followed by a pullback can visually resemble a head and shoulders on the same chart, which is why traders sometimes confuse the two mid-formation.
The pattern appears on every timeframe. What changes is reliability and noise. Higher timeframes tend to produce fewer, cleaner formations, while intraday charts throw up many that never confirm.
There is no single best timeframe to name, only a trade-off between frequency and quality that you choose based on how you trade.
The shape can appear inside a downtrend, but it is not a double top in the meaningful sense. A reversal pattern needs something to reverse, and inside a downtrend the price is already falling.
What looks like a double top there is usually a continuation pause, not a reversal, which is exactly why the prior-uptrend criterion matters so much.
That break invalidates the pattern. Bulkowski describes such formations as busted. A failed bearish pattern often precedes a move in the opposite direction, which is precisely why the stop sits above the higher peak.
Once price is above that level, the premise of the trade is gone and holding on hopes for a reversal that the chart has already rejected.
Yes, they are the same thing. The name M pattern simply describes the shape the two peaks and the trough make on a chart.
There is no analytical distinction between the two terms, so anything written about a double top applies to an M pattern and vice versa. This is a naming difference and nothing more."score this"

هل أنت مستعد لتطبيق مخاطر منضبطة على العملات المشفرة؟ استكشف أدوات التشفير الجديدة من Audacity Capital واجلب استراتيجية التداول الخاصة بك.
اعرف المزيدالنشرة الإخبارية
انضم إلى نشرتنا الإخبارية.
انضم إلى مجتمعنا الاجتماعي

ابدأ رحلتك اليوم مع تجربتنا المجانية
اعرض مهاراتك وإنجازاتك بفخر من خلال الشهادات واحصل على تقدير لعملك الجاد وتفانيك من المستثمرين المحتملين والأقران.
تجربة مجانيةمقالات ذات صلة

Averaging Down: Explained
What averaging down does to your breakeven and your exposure, the one question that settles whether to do it, and why leverage changes the answer entirely.


Spread Betting vs CFD Trading
Spread betting vs CFD trading for UK traders: how each is priced, the real tax difference and its conditions, expiry costs, and which suits which trader.

Prop Firms With No Consistency Rule in 2026
Compare prop firms with no consistency rule. Find firms offering flexible profit requirements, trading conditions, and payout policies for traders.

What Is BOS in Trading? A Complete Guide to Break of Structure (2026)
Learn what BOS in trading means, how Break of Structure works, how to identify bullish and bearish BOS, and how traders use it in market analysis.