
Fibonacci Fan: What It Is and How to Use It in Forex Trading ?
Introduction
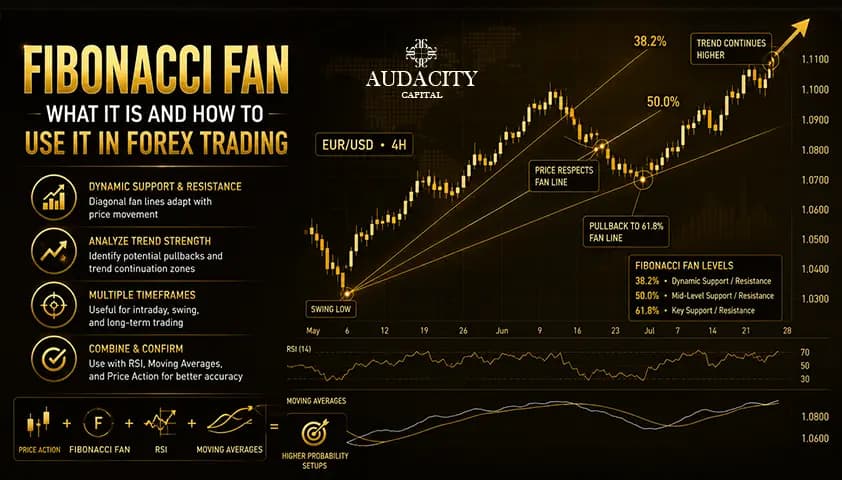
Fibonacci Fan is a technical analysis tool that helps traders identify potential support and resistance levels using diagonal trend lines. Unlike Fibonacci retracement, which uses horizontal levels, Fibonacci Fan projects sloping lines that move with the trend, helping traders analyse both price and time.
Although it is less popular than Fibonacci retracement or Fibonacci extension, some traders use Fibonacci Fan to track trend strength, identify pullback opportunities, and anticipate potential reversal zones.
In this guide, you'll learn what Fibonacci Fan is, how it works, how to draw it correctly, and how traders use it in forex trading.
What Is Fibonacci Fan?
A Fibonacci Fan is a charting tool based on Fibonacci ratios. It consists of diagonal trend lines drawn from a significant swing high or swing low.
These trend lines are based on key Fibonacci levels:
- 38.2%
- 50%
- 61.8%
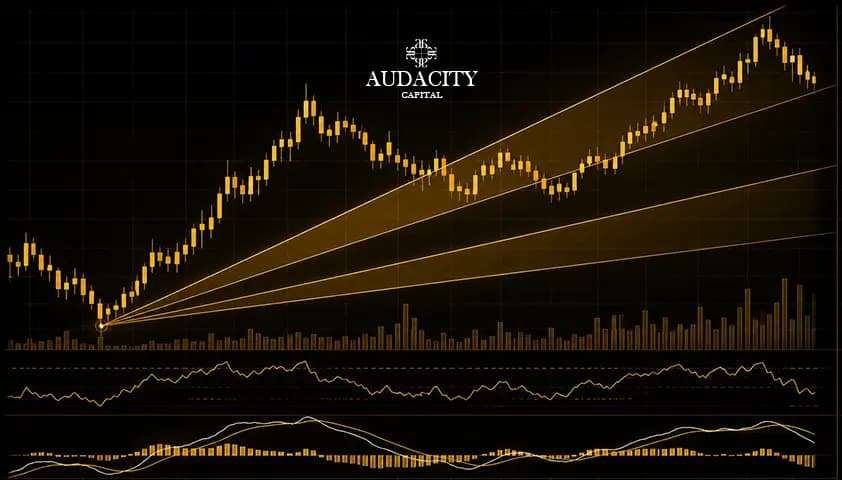
The lines extend outward and create dynamic support and resistance zones that adjust as the market moves.
Unlike static support and resistance levels, Fibonacci Fan helps traders analyse the speed and direction of a trend.
How Does Fibonacci Fan Work?
The idea behind Fibonacci Fan is simple.
When a market trends higher or lower, price rarely moves in a straight line. Instead, it experiences pullbacks and corrections.
Fibonacci Fan attempts to identify areas where these pullbacks may find support or resistance before the trend continues.
As price interacts with each fan line, traders monitor whether:
- The trend is maintaining strength
- The trend is slowing down
- A reversal may be developing
How to Draw Fibonacci Fan
In an Uptrend
- Identify a significant swing low.
- Identify the swing high that follows.
- Select the Fibonacci Fan tool on your charting platform.
- Draw from the swing low to the swing high.
The platform automatically plots the fan lines.
In a Downtrend
- Identify a significant swing high.
- Identify the swing low that follows.
- Draw the Fibonacci Fan from high to low.
The fan lines will act as potential resistance zones during pullbacks.
Understanding Fibonacci Fan Levels
38.2% Fan Line
This is the first support or resistance level.
In strong trends, price often respects this level and quickly resumes its original direction.
50% Fan Line
Although not a true Fibonacci ratio, the 50% level is widely used by traders.
A pullback to this level may indicate a healthy correction within the trend.
61.8% Fan Line
The most important Fibonacci Fan level.
When price reaches this area, traders often look for confirmation signals such as:
- Bullish engulfing candles
- Bearish engulfing candles
- Pin bars
- Trendline support
How to Trade Using a Fibonacci Fan
A Fibonacci Fan trading strategy helps traders identify dynamic support and resistance levels within a trend. Unlike horizontal Fibonacci retracement levels, Fibonacci Fan lines are drawn diagonally, allowing traders to analyze both price and time. The tool is commonly used to find entry and exit opportunities, confirm trend continuation, and manage risk.
Trading Fibonacci Fan in an Uptrend
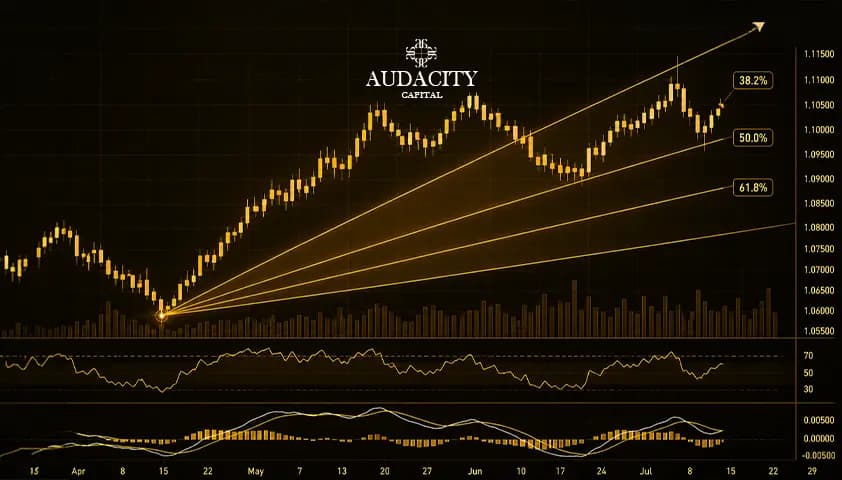
In an uptrend, Fibonacci Fan lines act as dynamic support levels. After a strong move higher, traders wait for price to pull back toward one of the fan lines before looking for a buying opportunity.
Typical long setup:
- Draw the Fibonacci Fan from the swing low to the swing high.
- Wait for price to retrace toward a fan line.
- Look for confirmation, such as a bullish candlestick pattern or increasing buying momentum.
- Enter the trade when price bounces from the fan line and resumes moving higher.
The 38.2% and 50% fan lines often provide support during strong trends, while the 61.8% line can act as support during deeper pullbacks.
Trading Fibonacci Fan in a Downtrend
In a downtrend, Fibonacci Fan lines act as dynamic resistance levels.
Typical short setup:
- Draw the Fibonacci Fan from the swing high to the swing low.
- Wait for price to rally back toward a fan line.
- Look for bearish confirmation signals.
- Enter a short trade when price rejects the resistance level.
This approach allows traders to enter in the direction of the prevailing trend while using the fan lines as potential turning points.
Using Fibonacci Fan for Breakout Confirmation
A break through a major Fibonacci Fan line can signal a shift in market momentum.
For example:
- A break below a fan support line in an uptrend may indicate weakening bullish momentum.
- A break above a fan resistance line in a downtrend may suggest buyers are gaining control.
To avoid false breakouts, many traders wait for a candle close beyond the fan line before taking action.
Stop-Loss and Take-Profit Placement
Proper risk management is essential when trading Fibonacci Fan levels.
Stop-Loss Placement
- For long trades, place the stop-loss below the next fan line.
- For short trades, place the stop-loss above the next fan line.
Take-Profit Targets
Traders commonly use:
- The next Fibonacci Fan level as a target.
- A fixed risk-to-reward ratio such as 1:2 or 1:3.
This helps maintain consistent trade management and avoids emotional decision-making.
Combining Fibonacci Fan with Other Indicators
Fibonacci Fan works best when combined with other technical analysis tools.
RSI Divergence
A bounce from a fan support level combined with bullish RSI divergence can strengthen a buy signal.
Moving Averages
When a Fibonacci Fan level aligns with a key moving average, such as the 50 EMA or 200 EMA, it often becomes a stronger support or resistance zone.
Volume Analysis
Increasing volume near a fan line can confirm the strength of a breakout or reversal.
Example Trading Setup
Bullish Example
- Price retraces to the 50% Fibonacci Fan line.
- RSI shows bullish divergence.
- A bullish engulfing candle forms.
- Long position entered.
- Stop-loss placed below the 61.8% fan line.
- Profit target set at the previous swing high.
Bearish Example
- Price rallies to the 38.2% Fibonacci Fan resistance line.
- A bearish rejection candle appears.
- Short position entered.
- Stop-loss placed above the 50% fan line.
- Profit target set at the previous swing low.
Example of Fibonacci Fan in Forex Trading
Imagine EUR/USD rallies from 1.0800 to 1.1000.
You draw a Fibonacci Fan from the swing low to the swing high.
Price later retraces and touches the 61.8% fan line.
At the same time:
- RSI moves out of oversold territory
- A bullish engulfing candle forms
This combination provides additional confirmation that the trend may continue higher.
To understand how all Fibonacci tools work together, read our complete guide to Fibonacci in Forex Trading
Fibonacci Fan Trading Strategy
Trend Continuation Strategy
Step 1
Identify a strong trend.
Step 2
Draw Fibonacci Fan levels.
Step 3
Wait for price to retrace toward a fan line.
Step 4
Look for confirmation from:
- Price action
- RSI
- Moving averages
- Support and resistance
Step 5
Enter in the direction of the trend.
Step 6
Place a stop loss beyond the next fan level.
Step 7
Set profit targets using market structure or Fibonacci extension levels.
Advantages of Fibonacci Fan
Dynamic Support and Resistance
Unlike horizontal levels, Fibonacci Fan adapts to changing market conditions.
Trend Analysis
Helps traders understand trend strength and momentum.
Works Across Multiple Timeframes
Can be applied to:
- 15-minute charts
- 1-hour charts
- 4-hour charts
- Daily charts
Easy to Combine With Other Indicators
Works well with:
- RSI
- Moving averages
- Fibonacci retracement
- Trendlines
Limitations of Fibonacci Fan
Subjective Swing Selection
Different traders may choose different swing points.
Less Popular Than Retracement
Many traders focus on retracement levels rather than fan lines.
Should Not Be Used Alone
Fibonacci Fan works best when combined with additional confirmation signals.
Fibonacci Fan vs Other Fibonacci Tools
Fibonacci Fan is one of several Fibonacci-based technical analysis tools available to traders. While all Fibonacci tools use the same mathematical ratios, each serves a different purpose depending on market conditions, trading style, and analysis objectives.
Tool | Best Used For | Key Feature | Works Best In |
|---|---|---|---|
Fibonacci Fan | Dynamic support and resistance | Diagonal trend lines | Trending markets |
Fibonacci Retracement | Pullback analysis | Horizontal support and resistance levels | Trending and ranging markets |
Fibonacci Arc | Potential reversal zones | Curved arcs combining price and time | Swing trading |
Fibonacci Channel | Trend channels | Parallel Fibonacci-based trend lines | Strong trends |
Fibonacci Time Zones | Timing potential market turning points | Vertical time-based lines | Trend analysis and cycle forecasting |
Fibonacci Fan vs Fibonacci Retracement
The primary difference is that Fibonacci Retracement uses horizontal levels, while Fibonacci Fan uses angled trend lines.
- Fibonacci Retracement identifies static support and resistance zones.
- Fibonacci Fan identifies dynamic support and resistance that evolve as the trend develops.
If your goal is to measure the depth of a pullback, Fibonacci Retracement is typically the preferred tool. If you're analysing trend direction and momentum, Fibonacci Fan can provide more context.
Fibonacci Fan vs Fibonacci Arc
Although both tools use Fibonacci ratios, they display them differently.
- Fibonacci Fan uses straight diagonal lines extending from a swing point.
- Fibonacci Arc uses curved arcs that account for both price movement and time progression.
Fibonacci Arcs are commonly used to identify potential reversal areas, while Fibonacci Fans are better suited for trend continuation analysis and dynamic support or resistance levels.
Fibonacci Fan vs Fibonacci Channel
A Fibonacci Channel creates a series of parallel trend lines based on Fibonacci ratios.
In contrast, Fibonacci Fan lines radiate outward from a single swing high or swing low.
- Use Fibonacci Channels when price is moving within a clearly defined trend channel.
- Use Fibonacci Fans when analysing pullbacks and trend continuation opportunities.
Fibonacci Fan vs Fibonacci Time Zones
Fibonacci Time Zones differ significantly from other Fibonacci tools because they focus on when a market move may occur rather than where price may move.
- Fibonacci Fan identifies potential support and resistance levels.
- Fibonacci Time Zones identify periods where trend reversals, breakouts, or increased volatility may occur.
Many traders use Fibonacci Fan and Fibonacci Time Zones together to combine price-based and time-based analysis.
When Should You Use Each Tool?
- Use Fibonacci Fan to identify dynamic support and resistance in trending markets.
- Use Fibonacci Retracement to measure pullbacks and find potential entry zones.
- Use Fibonacci Arc to analyse reversal zones influenced by both price and time.
- Use Fibonacci Channel to trade within established trend channels.
- Use Fibonacci Time Zones to anticipate potential turning points and significant market events.
Many professional traders combine multiple Fibonacci tools to gain a broader understanding of market structure, trend direction, and timing opportunities.
Common Fibonacci Fan Mistakes
Drawing From Incorrect Swing Points
Poor swing selection produces unreliable fan levels.
Ignoring Trend Direction
The tool works best when used in trending markets.
Trading Every Touch
Not every fan line interaction creates a trading opportunity.
Ignoring Risk Management
Always use stop losses and proper position sizing.
Is Fibonacci Fan Useful for Forex Traders?
Yes, but it should be viewed as a complementary tool rather than a standalone trading system.
Most traders achieve better results by combining Fibonacci Fan with:
- Fibonacci retracement
- RSI
- Moving averages
- Support and resistance
- Price action analysis
Final Thoughts
Fibonacci Fan is a useful technical analysis tool for traders who want to analyse trend direction and dynamic support and resistance levels. While it is not as widely used as Fibonacci retracement, it can provide additional insight into market structure and trend strength when used correctly.
For best results, combine Fibonacci Fan with other technical analysis tools and always apply proper risk management before entering any trade.
FAQ
A Fibonacci Fan is a technical analysis tool that uses diagonal trend lines based on Fibonacci ratios to identify potential support and resistance levels. Traders use it to analyse trend direction, momentum, and possible pullback zones.
A Fibonacci Fan works by drawing diagonal lines from a significant swing high or swing low. These lines act as dynamic support and resistance levels that move with the trend, helping traders identify potential continuation or reversal areas.
The most commonly used Fibonacci Fan levels are:
- 38.2%
- 50%
- 61.8%
The 61.8% level is generally considered the most significant because it is derived from the Fibonacci golden ratio.
Neither tool is universally better. Fibonacci Retracement is more widely used for identifying horizontal support and resistance levels, while Fibonacci Fan helps traders analyse trend direction and dynamic support and resistance. Many traders use both tools together.
Yes. Forex traders use Fibonacci Fan to identify potential pullback zones, trend continuation opportunities, and areas where price may find support or resistance during a trend.
Fibonacci Fan is often combined with:
- RSI
- Moving Averages
- Fibonacci Retracement
- Trendlines
- Support and Resistance Levels
- Price Action Analysis
Using multiple forms of confirmation can improve trading decisions.
Some limitations include:
- Subjective swing point selection
- Lower popularity compared to Fibonacci Retracement
- Potential for false signals
- Reliance on confirmation from other indicators
For this reason, Fibonacci Fan should not be used as a standalone trading strategy.
Yes. Most charting platforms include a built-in Fibonacci Fan tool, making it relatively easy to apply. However, beginners should first understand trend analysis, support and resistance, and risk management before relying on Fibonacci Fan in live trading.
These FAQs target additional searches such as:
- what is fibonacci fan
- how to use fibonacci fan
- fibonacci fan strategy
- fibonacci fan vs fibonacci retracement
- is fibonacci fan accurate
- best indicators with fibonacci fan
هل أنت مستعد لتطبيق مخاطر منضبطة على العملات المشفرة؟ استكشف أدوات التشفير الجديدة من Audacity Capital واجلب استراتيجية التداول الخاصة بك.
اعرف المزيدالنشرة الإخبارية
انضم إلى نشرتنا الإخبارية.
انضم إلى مجتمعنا الاجتماعي
ابدأ رحلتك اليوم مع تجربتنا المجانية
اعرض مهاراتك وإنجازاتك بفخر من خلال الشهادات واحصل على تقدير لعملك الجاد وتفانيك من المستثمرين المحتملين والأقران.
تجربة مجانيةمقالات ذات صلة

Prop Firm vs Broker: Which One Is Better for Traders in 2026?
Prop firm vs broker explained clearly. Compare costs, risks, rules, capital, payouts, and control to choose the right trading path in 2026.

Range Trading Strategy: The 10 Best Range Trading Strategies in 2026
Discover the 10 best range trading strategies for forex, stocks, and indices. Learn how to identify ranging markets, manage risk, and trade support and resistance successfully.

Best Time to Trade Forex in 2026: The Complete Session-by-Session Guide
Discover the best time to trade forex in 2026. This expert guide covers all four sessions, London-New York overlap, best days, worst days, currency pair timing, and a strategy-based schedule to maximize your trading edge.

Margin Account Requirements in 2026
Learn the margin account requirements for 2026, including minimum equity, initial and maintenance margin, margin calls, and new day-trading rules.