


Inside Bar Pattern: Meaning, Examples and Trading Rules


A small candle appears right after a larger one, and the setup looks simple enough to act on. Then the next break fails, price snaps back inside the range, and the "clean" entry becomes a loss.
That gap between spotting a shape and trading it well is where most confusion around the inside bar pattern lives.
This guide walks through how to identify the formation correctly, the trading-rule choices you can test, and the situations that deserve caution before you commit real capital.
What Is an Inside Bar Pattern?
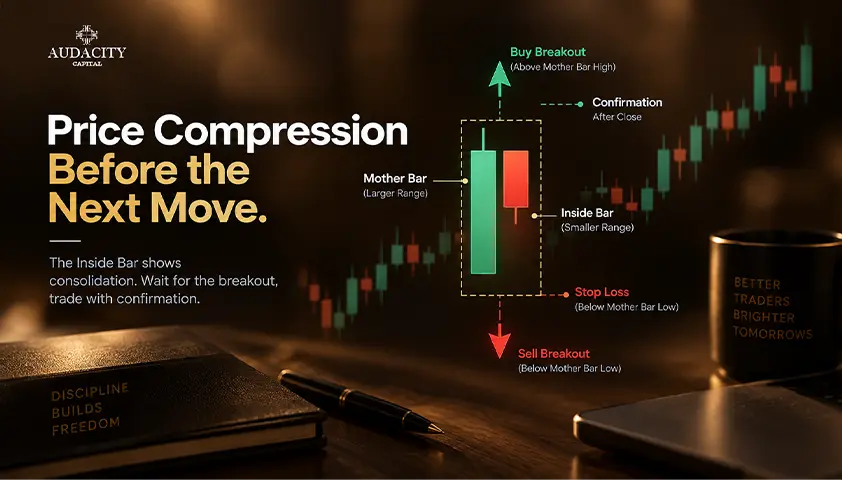
An inside bar pattern is a two-candle formation. The second candle's full high-to-low range sits entirely within the range of the candle before it. That first, larger candle is called the mother bar, because it contains the one that follows.
The containment test uses both wicks, not just the candle body. You compare the complete high and low of each candle. Candle color plays no part in the definition. A green inside bar and a red inside bar are the same formation as long as the range fits inside the mother bar.
Use this quick checklist to confirm the inside bar candlestick pattern:
- Compare two consecutive candles on your chart.
- Check that the second candle's high is lower than the mother bar's high.
- Check that the second candle's low is higher than the mother bar's low.
- Confirm only after that second candle closes.
A candle still forming can break either boundary before completion, so a developing bar is not yet an inside bar. The mother bar does not need to be unusually large compared with the rest of the chart. It only needs to contain the next candle.
This guide uses strict containment throughout. Some traders allow one equal boundary, and that is a valid alternative definition, but a single price beyond either the high or the low fails strict containment.
Pick one rule and apply it consistently rather than switching between strict and inclusive tests without noticing.
Suggested chart: an illustrative candlestick chart showing two completed candles, with the mother-bar high and low marked as boundaries and the inside bar sitting within them. Label it illustrative. No market prediction is required to read it.
Is an Inside Bar Bullish or Bearish?
The formation describes range contraction. Price has paused, and the recent range has tightened. On its own, that pause does not fix the next direction.
Continued consolidation, an upward break, and a downward break are all possible outcomes from the same shape.
Traders read direction from context. When an inside bar forms during an established trend and price breaks in the direction of that trend, some view it as a possible trend continuation.
A break against the prior move at a meaningful level of support or resistance may instead form part of a reversal setup. The words bullish and bearish here describe the directional scenario you are testing, not the color of the inside candle.
A bullish inside bar scenario leans on an upside break with the trend behind it. A bearish inside bar scenario leans on a downside break. In both cases, support, resistance, and trend supply context, not certainty.
The formation is not proof that buyers and sellers hold equal positions, and it does not confirm that institutions are accumulating. That is why you still need a direction-specific trigger before the pattern becomes a plan you can act on.
Inside Bar vs Harami and Outside Bar
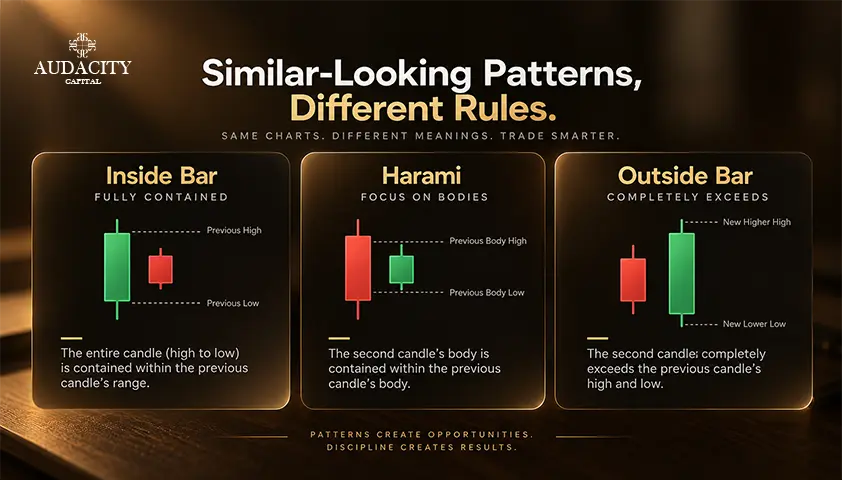
These three formations get grouped together, but they measure different things. The table below separates them. A single chart can satisfy more than one definition at once, so the names are not interchangeable.
Formation | What is compared | Key distinction |
Inside bar | The full high-to-low ranges | The second range is contained within the first. |
Harami | The two real bodies | The second body sits within the first. Traditional bullish and bearish versions also consider trend context. |
Outside bar | The full high-to-low ranges | The second high is higher and its low is lower than the first bar's. |
The inside bar vs harami question comes down to range versus body: one tests wicks and all, the other tests the candle body alone.
The inside bar vs outside bar comparison is simpler still, since the outside bar expands the range instead of contracting it. Not every inside bar is a harami, and not every outside bar is a body-engulfing pattern.
How to Trade an Inside Bar Pattern
The steps below form a framework for testing an inside bar trading strategy, not a recommendation to trade every occurrence. Keep them in order.
Step 1: Check the context before choosing a direction
Run four checks before you think about entries.
- First, decide whether the market is trending or ranging.
- Second, note how close price sits to a meaningful level of support and resistance.
- Third, measure how much room exists before the next opposing level, since that room caps a potential move.
- Fourth, look for scheduled events or thin liquidity that can distort the break.
A moving average or an inside bar indicator can add optional context, but adding several indicators does not prove the setup has an edge. Treat them as background, not confirmation.
Step 2: Define the breakout trigger
Make your reference candle explicit, because a break of the mother bar and a break of the inside bar are two different rules. The worked example later uses the mother-bar approach.
You also choose how to time the entry. An intrabar trigger acts the moment the price crosses your chosen level. Waiting for a candle to close beyond that level avoids some brief probes, but it changes your entry price and can miss part of the move.
Neither choice is universally better.
Compare the choices before you commit to one. For short scenarios, reverse the long-side references.
Decision | One approach | Alternative and trade-off |
Entry boundary | Break beyond the mother bar | Break the inside bar first. This is earlier, but price may still be within the mother range. |
Entry timing | Act when the chosen level breaks | Wait for a close beyond it. This adds a completion check but can give a later entry. |
Stop reference | Use the opposite mother-bar boundary | Use the opposite inside-bar boundary. The tighter invalidation can be reached while the mother range still holds. |
An inside bar breakout above the mother bar is a common long trigger, placed with a buy stop just beyond the high. The mirror short uses a sell stop below the mother-bar low.
Step 3: Define the stop, position risk and exit
Stop distance and cash risk are not the same thing. Your planned loss depends on the distance to the stop, your position size, and the value of the instrument, plus costs and possible slippage.
Widening the stop increases planned risk only if position size and instrument value stay unchanged. A tighter stop is not automatically safer, because the tighter invalidation can be hit while the mother range still holds.
For exits, remember that an opposing level can limit how far price travels. Decide in advance how your test handles three outcomes: taking profit, price returning inside the range, and a setup that never triggers.
An Inside Bar Trading Example
Picture a hypothetical four-hour chart.
The mother bar has a high of 110 and a low of 100. The next candle prints a high of 108 and a low of 103. Because 108 is below 110 and 103 is above 100, the full range sits inside the mother bar, so it meets the strict definition.
*These are generic price units, not a live market call.
An illustrative long-side plan places a buy stop above 110, with invalidation beyond the opposite mother-bar boundary at 100. Contrast that with an early entry above 108, which triggers while price is still within the mother range and can reverse before clearing 110.
Any fill, stop buffer, and cost depends on your rule set and execution conditions. From here, price can extend after the break, or it can return inside the range and invalidate the plan. Neither path is typical, and neither is a promise.
A short-side test simply mirrors these levels.
What Do Multiple Inside Bars Mean?
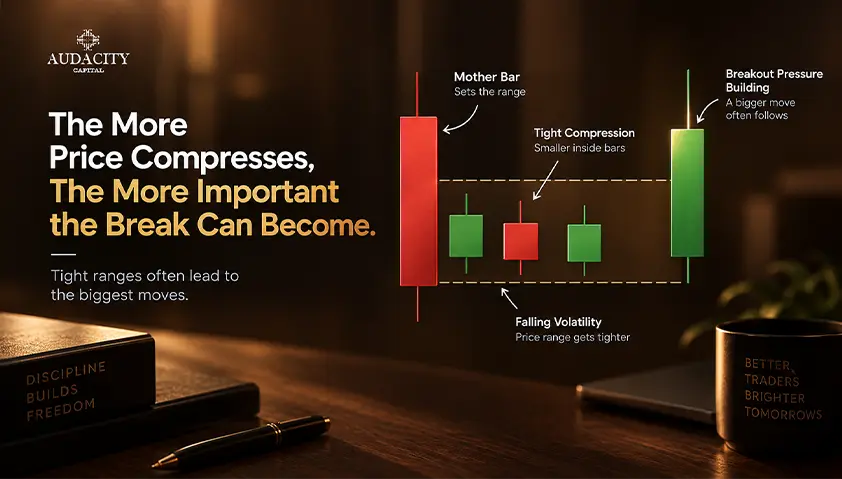
Multiple contained candles come in two forms, and the difference matters. In the first, several bars each fit within the same original mother range.
In the second, a nested sequence forms, where each new bar sits inside the immediately previous bar. Only the nested version necessarily produces progressively smaller ranges through these nested bars.
For a test, state which mother range you continue to use, and do not switch breakout boundaries without saying so. More contained candles show that the range has persisted, not that a larger move is guaranteed once it breaks.
Double inside bar terminology varies between sources, so describe the actual high-low relationship before you apply the label. There is no fixed maximum number of bars, and no rule that each extra candle improves reliability.
Which Markets and Timeframes Can You Use?
The formation can appear on standard price charts across markets, including inside bar forex setups, futures, stocks, indices, and metals. An inside day is simply the daily-chart version, while the broader inside-bar term also applies to intraday and longer periods.
Timeframe choice involves trade-offs. Short intervals produce more observations but also more execution costs to weigh, since spread and slippage recur on every trade. Longer intervals take more time to form and can produce wider absolute stops. Daily and four-hour charts are popular, but neither always works better.
Lower-timeframe structure can help you inspect a setup, though it does not prove the setup will succeed.
When you compare results, keep the instrument, session, and timeframe consistent. If volume enters the discussion, separate exchange-traded volume from provider-specific tick volume.
A pattern showing up across many markets does not establish equal performance or equal access.
Why Inside Bar Breakouts Fail
A false breakout is a move beyond your chosen boundary followed by a return inside it.
The fakey pattern is a related sequence, where an inside bar false-break reverses and runs the other way. It is worth naming, but it is a separate study, not a second strategy tutorial.
Several conditions can undermine a setup that looks valid.
A nearby opposing level leaves little room.
Overlapping, choppy price action muddies the signal.
Thin liquidity, scheduled news, spread, and slippage can all push a break offside.
A completed breakout candle can still fail, and not every failed break was deliberate stop hunting.
Build a simple review log before you judge the pattern.
Record the formation rule, instrument, timeframe, entry trigger, exit rule, costs, and result. Compare like-for-like rules, and include your losing examples rather than only the clean ones. Win rate alone does not establish profitability, and a filter should be tested rather than assumed helpful.
Be careful with statistics. There is no universal failure rate for this formation. Check what any quoted study actually counts, because opening inside yesterday's range is a different event from completing an inside day, and a breakout-touch percentage is not the same as a trade win rate.
Conclusion: Test the Setup Before Trading It
Choose one instrument, one timeframe, and one written rule set. Then review a fixed historical period without cherry-picking the attractive examples.
Record every valid formation, its trigger, its invalidation, and the costs involved. A formation earns a place in your trading plan through evidence, not appearance, and learning this pattern does not by itself lead to profit.
For a structured next step, Audacity Capital Trader University is a free resource for learning market structure and risk discipline, which pairs well with the kind of testing described above.
Frequently Asked Questions
Yes, tools can flag high-low relationships and issue alerts when a candle closes inside the previous one. A chart marker labels a single symbol, while a scanner covers many at once. Verify the script's documented rules and check its sample output. Automated detection flags the shape, not whether a trade suits you.
Data providers, session definitions, and candle boundaries differ between platforms, so the same instrument can show different candles. Compare the feed and the trading session before assuming the pattern changed. On TradingView, changing the displayed time zone alone does not alter the underlying candles or Pine calculations.
No. An inside bar tests containment against one preceding bar. NR4 and NR7 compare the current range against a four-bar or seven-bar window, including the current bar. A single candle can meet both tests, but neither label automatically implies the other, and combining them guarantees nothing.
You can, but treat it as a separate method. Heikin Ashi uses synthetic candle values, so a setup detected there can differ from one on standard candles. Validate your order prices against actual market data, and do not treat synthetic-price backtests as realistic execution.
In The Strat, a "1" marks an inside bar within its three-scenario classification. A "2" takes out one side of the preceding range, and a "3" takes out both. The number describes a relationship between bars, so it is not a complete entry signal on its own.

هل أنت مستعد لتطبيق مخاطر منضبطة على العملات المشفرة؟ استكشف أدوات التشفير الجديدة من Audacity Capital واجلب استراتيجية التداول الخاصة بك.
اعرف المزيدالنشرة الإخبارية
انضم إلى نشرتنا الإخبارية.
انضم إلى مجتمعنا الاجتماعي

ابدأ رحلتك اليوم مع تجربتنا المجانية
اعرض مهاراتك وإنجازاتك بفخر من خلال الشهادات واحصل على تقدير لعملك الجاد وتفانيك من المستثمرين المحتملين والأقران.
تجربة مجانيةمقالات ذات صلة
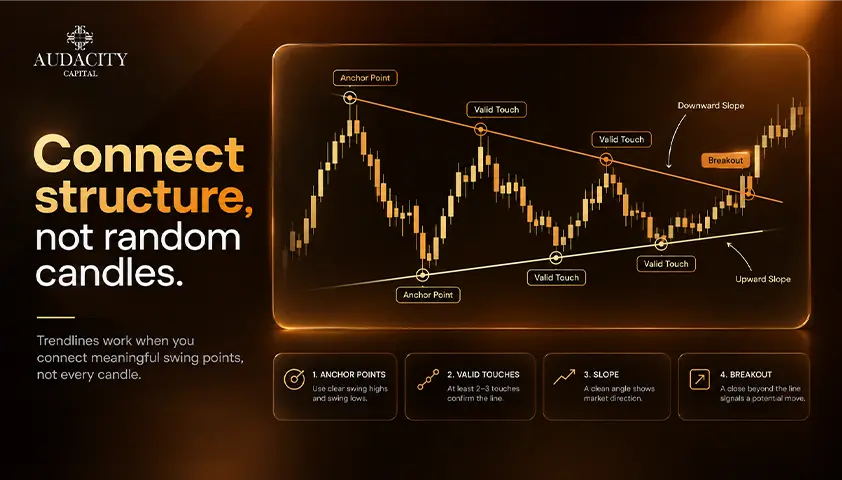
How to Draw Trend Lines
How to draw trend lines step by step, whether to use wicks or bodies, when a line is valid, and when to redraw versus accept a break.

Bull Flag Pattern: A Comprehensive Guide
How the bull flag pattern works, how to set the entry, stop and target, and what the research actually says about its reliability.

Prop Firms That Allow Weekend Holding in 2026 (Compare Firms)
Compare prop firms that allow weekend holding. Explore weekend and overnight rules, news trading, drawdown, markets, profit splits and key restrictions.

Prop Firms With No Minimum Trading Days
Prop firms with no minimum trading days compared, with evaluation rules, payout conditions and who each one suits.