


Mean Reversion Trading Strategy Explained (2026)


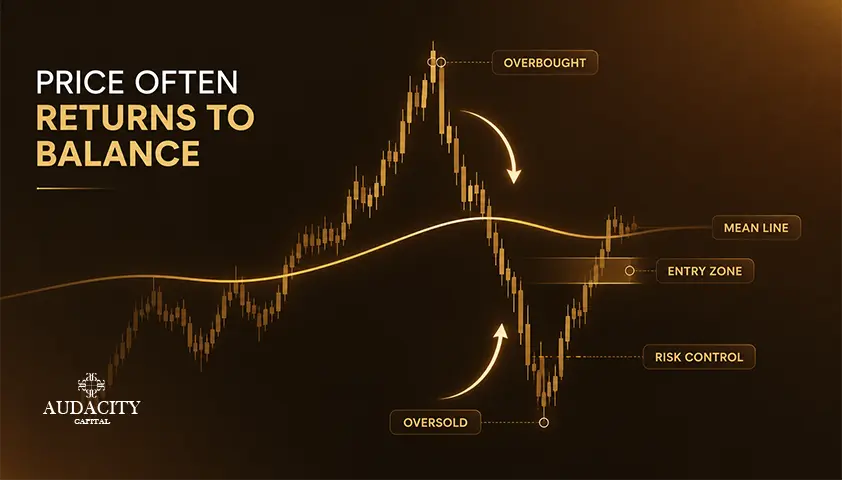
Price rarely follows a perfectly linear path. It stretches, reverts, drifts and then stretches out again. The mean reversion strategy is based on the notion that prices can move beyond their average value.
When this occurs, traders anticipate the price to retrace to the mean. They can sell when the price looks stretched high or buy when the price looks stretched low. The most important condition here is that it only works in range-bound or mean-reverting markets.
In this article we will talk about what mean reversion is, in which cases it works, the indicators that measure it, how to trade using it, and hidden risks that ruin the account.
Remember, this is an educational piece, not trading advice. Mean reversion is a tendency, but not a certainty. Prices don’t always revert to the mean, and most retail traders make losses trading derivatives.
Every time frame, bands and stops below are illustrative and should be tested on your specific market.
What Mean Reversion Is
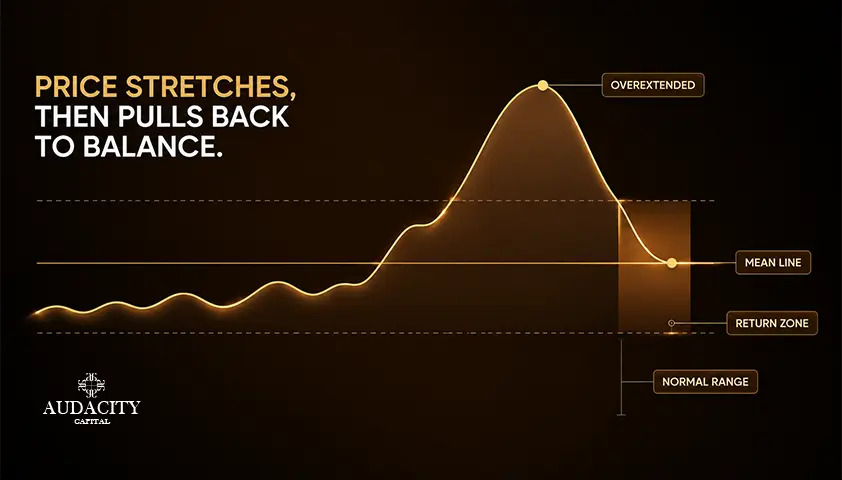
Mean reversion is a theory suggesting that asset prices and returns tend to go back to the historical average level over time.
Extreme deviations from this average might be temporary. If the price goes too far from its usual levels, then traders might expect a reversal.
The mean is just an average against which the strategy trades. In most cases, the mean refers to a moving average, such as a 20-period SMA or EMA. Sometimes traders employ VWAP from a certain trading session or a fair value zone based on previous price action.
The mean is not a fixed line on the chart. It changes depending on the new price input. Today's average is not necessarily yesterday's average; hence the trading strategy must incorporate the changing mean.
The main assumption of this strategy is that there will be bounded moves within the changing average. If prices move too far, there will be some force pulling the price back. When this doesn’t happen, you get a losing trade, and that is the whole story about the risk.
Why It Works, and Why It Is Only a Tendency
The markets tend to overreact. There are news releases, orders begin to accumulate on one side, liquidity becomes scarce, stop levels trigger, and prices move beyond where the information justifies.
When the initial push subsides and the order flow becomes balanced, the price is likely to go back to its average. This is how reversion to the mean works.
The process here describes a systematic bias under specific circumstances. It does not describe a rule, because prices do not always revert to the average.
There are factors like structural shifts, earnings surprises, policy changes, breakouts from consolidation ranges, and new trends that will drive prices away from the average and hold them there. The average itself can shift to a whole different level.
Mean reversion, therefore, is a conditional tendency. It does work frequently enough to make it the basis of a strategy, and it fails frequently enough to make risk management the strategy.
The Regime Question Comes First
The most frequent and the most costly mistake in mean reversion trading is acting on an oversold or overbought signal without first asking if the market is mean-reverting.
This simple check can separate a viable trade from a losing battle against the trend.
Mean reversion is the polar opposite of trend-following. Trend-following is all about riding momentum and expecting the extremes to keep going. Mean reversion smooths out extremes and expects them to return to the mean. All mean reversion signals are traps in a strong trend.
Oversold becomes even more oversold. The low price becomes even lower. The indicator will give the same warning at each step down and the trader who fades each one will bleed out.
Confirm the Regime Before You Trade
Prior to trading an extreme reading, make sure that the market is not trending but is rather ranging. Some useful filters are:
- A moving average that is either flat or gently sloping without any directional bias.
- ADX values that remain low, implying weak trending conditions.
- Visible horizontal support and resistance levels, with price respecting them many times.
- Price bouncing between a midpoint level, without any higher highs and higher lows or lower lows and lower highs.
In case there is a strong trend, the best option would be to stand aside or follow the trend in another way. Trading against a trend is where people blow up their accounts.
Market Selection Matters
While some financial instruments and market conditions are more likely to be mean-reverting, that changes over time. Some currency pairs, range-bound stocks, and even some options can mean-revert. On the other hand, many strong index uptrends do not.
A test such as the Augmented Dickey-Fuller (ADF) test can help determine whether a market series was stationary over a historical sample. But that's what has happened so far. It provides no guarantee of future mean reversion and any market regime can switch at any time without notice.
Thus, the conclusion is quite clear: mean reversion is a market condition which you prove first, rather than detect by your signals.
The Tools: Measuring the Mean and the Deviation
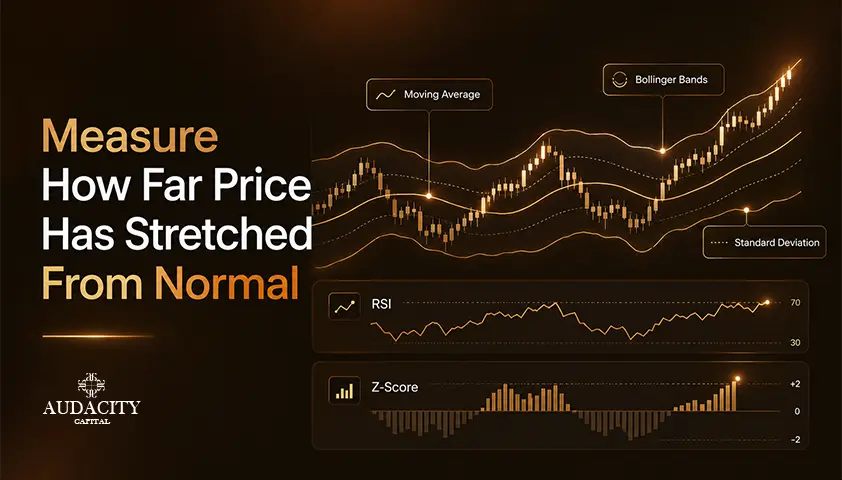
There are two basic tasks of any mean reversion trading strategy: defining the mean and measuring deviation from the mean.
Defining the Mean
The moving average serves as the standard point of reference. A 20-period SMA on a daily chart, a 50-period EMA on an intraday chart, or a session VWAP for shorter time frames are among the typical examples.
Each one generates its own "average," and the result influences each trade signal afterward. Regardless of which line you choose, the strategy anticipates that price will return to that point.
Measuring the Deviation
After calculating the mean, the next step is to determine how far price has moved away from the mean using the following mean reversion indicators:
- Bollinger Bands are placed above and below the moving average with the distance being determined through standard deviation. When price touches the upper band, it may indicate that price is stretched relative to its recent volatility.
- Relative Strength Index (RSI) is a momentum indicator that highlights overbought and oversold positions above 70 and below 30.
- Z-score tells you how many standard deviations away from the mean price it is. It provides a statistical way to determine deviation.
- Percent-from-the-moving-average works similarly.
Combining Signals
Single indicators produce noisy signals. Many traders require two conditions to agree, for example price touching the lower Bollinger Band while the RSI reads below 30. Two agreeing signals filter out weaker setups, though they also reduce the number of trades.
Every threshold above is an example to test on the specific market and timeframe you trade, not a default that works out of the box.
How to Trade Mean Reversion?
With the regime confirmed, the workflow becomes mechanical. The steps below assume you have already established that the market is range-bound.
1. Confirm the range.
Flat moving average, low ADX, respected support and resistance.
2. Identify the mean.
Choose your moving average, VWAP, or fair-value zone. This is your target.
3. Wait for a stretched extreme.
Price at the outer Bollinger Band combined with an RSI extreme, or a high z-score reading, is a common trigger set.
4. Enter on evidence the stretch is fading.
For example, wait for price to close back inside the outer band instead of buying while price is still falling. This confirmation can reduce the risk of entering during a continuing move.
5. Take profit at the mean.
The moving average or VWAP is the logical target. Some traders scale out, taking partial profit at the mean and letting a portion run toward the opposite band.
6. Place a stop beyond the recent swing extreme.
Size the stop with the ATR so a continued move exits the trade quickly rather than letting a loser compound.
Position Sizing and a Time Stop
Keep position size small because losing mean-reversion trades tend to run. The moves that break the range are exactly the moves that never come back to the average. Small size is what allows you to be wrong and still trade tomorrow.
A time stop is worth considering. If the trade has not reverted within a set number of bars, exit even if the stop has not been hit.
Setups that stall often fail, and holding indefinitely ties up capital and mental bandwidth. Stop loss and risk management define the strategy more than the entry signal does.
All numbers above are illustrative. None of them guarantee a winning trade. Backtest and pre-define your risk before any of this touches live capital.
The Risks and Common Mistakes
The account-killer is trading mean reversion against a strong trend or into a breakout. Price never returns to the mean. Every fade adds to the loss. Every "it has to come back" adds size to a position that is already wrong.
This is the single biggest risk in the strategy. It is also why the regime filter and stop loss are essential. They are not optional refinements.
Other frequent mistakes:
- Catching a falling knife. Entering the moment an indicator prints an extreme, before price shows any sign of the stretch fading. Waiting for confirmation costs a few points of entry and saves a lot of losses.
- Skipping the stop. Convincing yourself the trade "has to" revert. It does not have to do anything.
- Oversizing. Taking a larger position because the setup looks obvious. Obvious setups fail too, and larger size turns a normal loss into a serious drawdown.
- Ignoring scheduled events. Earnings, central bank decisions, and major data releases can break a range in seconds. A perfect setup into a known event is a lottery ticket, not a strategy.
- Overtrading. Frequent trades run up spreads and commissions that quietly erode returns, especially on lower timeframes where noise looks like signal.
Mean reversion is a viable approach only inside the right regime, with confirmation, small size, and strict stops, because reversion is a tendency, not a guarantee.
The best way to see whether it fits your trading is to backtest it on your chosen market and timeframe. Then test it on a demo or simulated account before risking real capital.
Most retail traders lose money on leveraged products, and no strategy changes that baseline reality on its own.
Conclusion
Mean reversion is a trading strategy in which stretched prices move back toward their average. The strategy can be used only in range-bound or mean-reverting market regimes, and hence the regime problem precedes the oversold or overbought condition problem. Getting the sequence wrong would entail battling against the trend in every single trade made.
The approach is quite simple when you follow the right sequence. First, confirm the market regime and establish the mean. Then, measure the deviation and enter when the price starts to reverse.
Exit when the price reaches the mean. Keep your position size small and use strict stops. Finally, backtest and demo-test the strategy before risking real capital.
Reversion is a pattern and not an assurance, as sometimes prices drift from the mean completely. Consider the strategy as just one approach, appreciate its necessary requirements and let risk management do the heavy lifting when a trade goes against you.
Frequently Asked Questions
It can work in range-bound or mean-reverting markets, but it fails in strong trends and no reversion is ever guaranteed. Consistent results depend on a strict regime filter, careful market selection, and disciplined risk management. Without those, the strategy becomes a slow way to fund the market makers.
They are opposite approaches to price. Mean reversion fades extremes and expects a return to the average, which works best in ranges. Trend-following rides momentum and expects extremes to continue, which works best in strong directional markets. Neither is universally better. The market conditions decide which one has an edge on any given day.
Common mean reversion indicators include Bollinger Bands, the RSI, moving averages, and standard deviation or a z-score. Most traders combine two of them so that agreement is required before a trade, which filters out weaker signals. Every setting needs testing on the specific market, because thresholds that fit one instrument often fail on another.
Range-bound instruments tend to suit the strategy best. Certain currency pairs and consolidating stocks often show reversion, while strongly trending indices frequently do not. Market selection matters as much as the setup, and a statistical check on historical behavior can help identify candidates, though past behavior does not lock in future behavior.
A common approach is placing the stop beyond the recent swing extreme, sized using the ATR to reflect current volatility. The purpose is to exit quickly when price keeps moving away from the mean rather than toward it. Letting a mean-reversion loser run is how ranges become account drawdowns.
Many traders find the daily timeframe more reliable because signals are cleaner and transaction costs are proportionally smaller. Lower timeframes offer more setups but more noise, more slippage, and more commissions. The right timeframe depends on the trader's schedule, the market's behavior, and how well the strategy backtests on that specific chart.
Not quite. Buying the dip is often trend continuation, an attempt to join an uptrend at a shallow pullback. Mean reversion means fading an extreme move and expecting price to return toward an average. The strategy works best when the market is range-bound or has a demonstrated tendency to revert. The two setups can look similar on the chart but rely on very different assumptions about what the market does next.
Pairs trading is a market-neutral form of mean reversion. It trades the spread between two related instruments, betting that the spread reverts to its historical average when it stretches. The approach depends on the two instruments remaining statistically linked.
If that relationship breaks, the spread may not revert. The trade can then become a bet on continued divergence instead.

Bereit, diszipliniertes Risiko auf Krypto anzuwenden? Entdecken Sie die neuen Krypto-Instrumente von Audacity Capital und bringen Sie Ihre Trading-Strategie mit.
Mehr erfahrenNewsletter
Treten Sie unserem Newsletter bei, um auf dem Laufenden zu bleiben.
Treten Sie unserer sozialen Gemeinschaft bei

Beginnen Sie Ihre Reise heute Mit unserer kostenlosen Testversion
Präsentieren Sie stolz Ihre Fähigkeiten und Leistungen durch Zertifikate und erhalten Sie Anerkennung für Ihre harte Arbeit und Ihr Engagement von potenziellen Investoren und Kollegen.
Kostenlose TestversionVerwandte Artikel
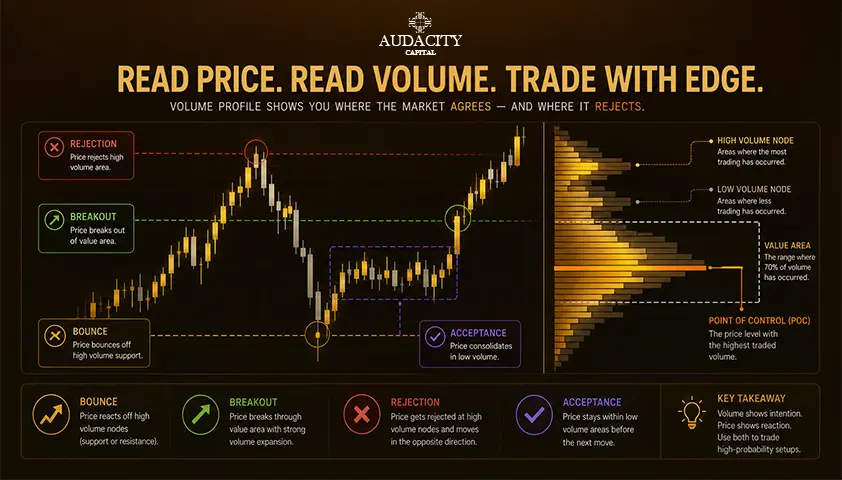
Volume Profile Trading Strategy Guide: Setups & Nodes
A Volume Profile trading strategy shows where the market spent the most volume. Learn POC, value areas, volume nodes, and 4 setups for ES, NQ, and forex.

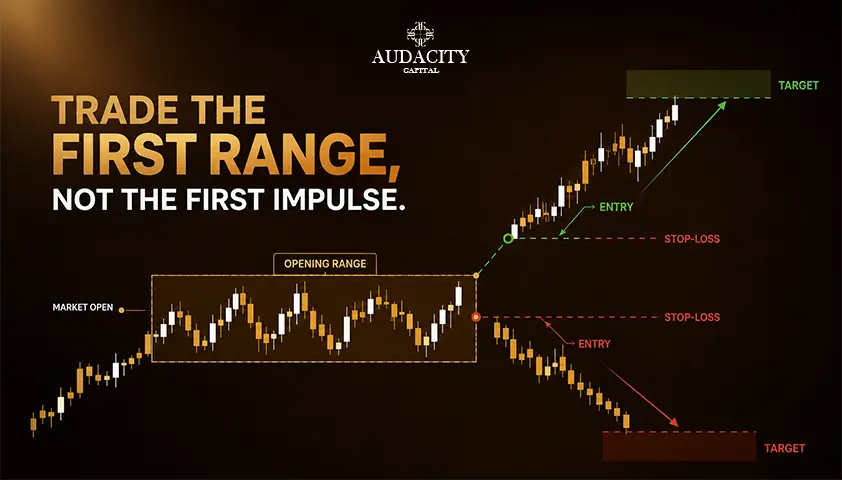
Opening Range Breakout Strategy: Rules, Setups and Examples
Learn how the opening range breakout strategy works, including ORB rules, 5, 15 and 30-minute setups, entry signals, stop losses and risk management.
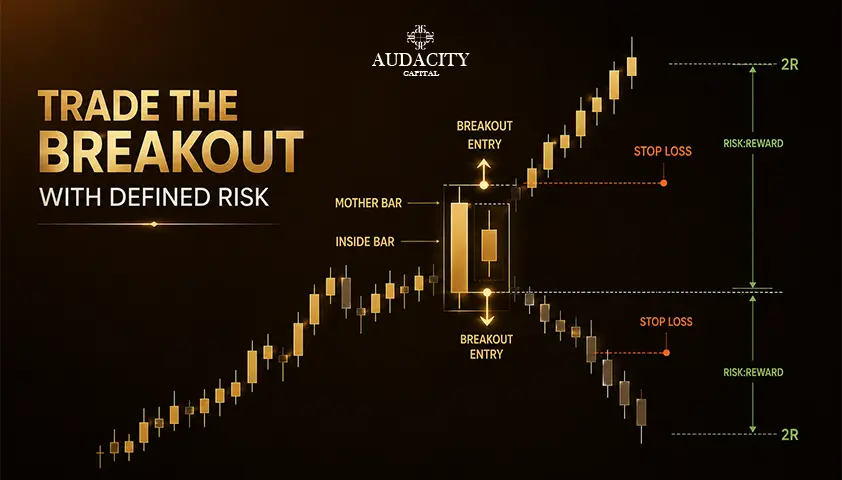
Inside Bar Trading Strategy: Rules, Entries and Risk Guide
Master the inside bar trading strategy with practical rules for pattern identification, entry triggers, stop placement, risk management, and testing.
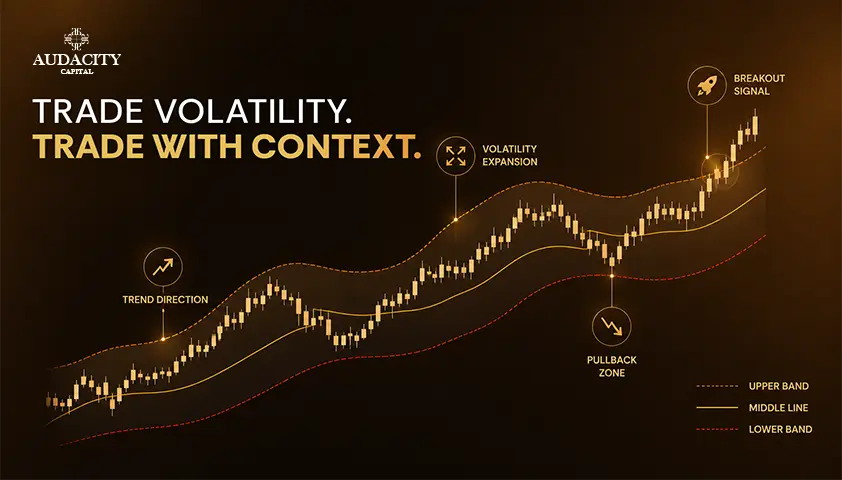
Keltner Channel Trading Strategy: How to Read Volatility With Context
Discover how Keltner Channels measure market volatility, spot trend pullbacks, and confirm breakouts. Includes setup rules, settings, and testing methods.