



US Midterms 2026: How to Trade Gold, the Nasdaq and the US Dollar After the Blue Wave


Key takeaways
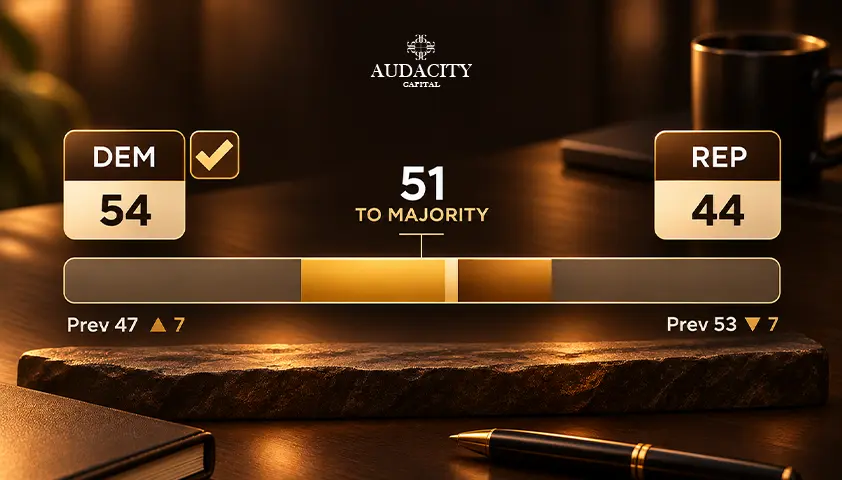
- Democrats won both the House and the Senate, and the wave is still growing. Democrats hold at least 54 Senate seats and have flipped more than 40 House seats, with Alaska and Mississippi still too close to call.
- Gold is the cleanest winner so far. A softer dollar, lower Treasury yields and a sharp drop in oil pushed it to a two-week high near $4,147/oz on 5 November.
- The Nasdaq 100 has gone from a bounce to a rout. After recovering on election day, it plunged more than 6% on 5 November as fears of curbs on data-centre development hit chip and AI stocks.
- The dollar slipped to a one-month low before bouncing, but for the rest of Q4 the Federal Reserve matters more than Congress. December hike odds have eased to roughly 70–80%, depending on the snapshot.
- The big dates to watch are today's jobs report and the 8–9 December FOMC. The setup looks a lot like 2018, when a December hike knocked stocks down nearly 20% from their autumn high.
What happened?
Democrats took control of both chambers of Congress. The House was called first, and the Senate followed shortly after 11:30pm ET. The party flipped seats in Ohio, Iowa, North and South Carolina and Maine, and won Senate races in Texas and Kansas for the first time in decades.
Source: CBS News
For markets, the takeaway is simple. President Trump keeps the White House, but getting new laws passed just got a lot harder. Traders call this "gridlock", and it has the potential to change the outlook for spending, yields and the dollar. As of 5 November, the Senate races in Alaska and Mississippi were still uncalled, with Mississippi decided by only a few thousand votes. Democrats are on track for their biggest House majority since the early 1990s.
Why does gridlock matter for markets?
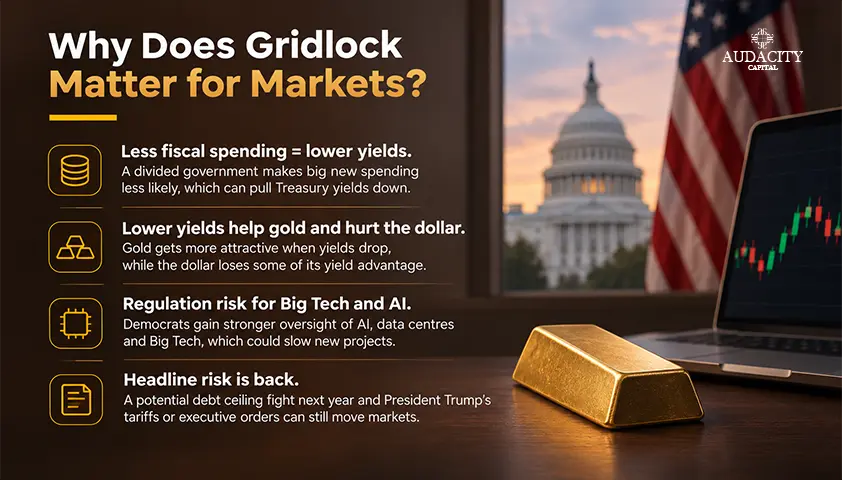
- Less fiscal spending = lower yields. A divided government makes big new spending or tax packages less likely. That lowers expectations for government borrowing, which pulls Treasury yields down. This could in part explain why the US Dollar Index slipped as yields fell.
- Lower yields help gold and hurt the dollar. Gold pays no interest, so it gets more attractive when yields drop. The dollar loses some of its yield advantage.
- Regulation risk for Big Tech and AI. Democrats gain stronger oversight of AI, data centres and Big Tech. They also won the governor's races in Texas and Ohio, two hubs of data-centre building, where new local rules could slow projects. That fear sparked the 5 November tech selloff.
- Headline risk is back. J.P. Morgan's Tai Hui pointed to a debt ceiling fight some time next year. President Trump can also still move markets through tariffs and executive orders, which don't need Congress.
Gold (XAU/USD): Has the year-to-date low been printed?
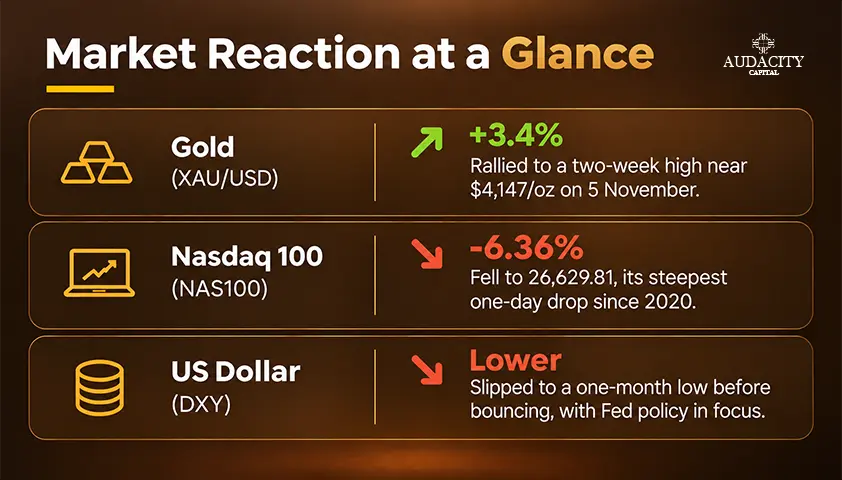
Gold is the most straightforward post-election trade. A weaker dollar, lower yields and fresh political uncertainty all point the same way. Gold jumped nearly 3.4% on election day, its biggest one-day gain since mid-August, and hit a two-week high of $4,146.63 on 5 November. A near 9% slide in Brent crude on hopes of less escalation in the Iran conflict helped too, as it eased inflation fears. Gold is now more than $250 above last Friday's one-year low of $3,869.85.
The catch is the Fed. A hawkish Fed and a December hike could push real yields (yields after inflation) higher, and that has capped gold rallies all year. Gold is still down for 2026 and well below its $5,602 record from January. Today's jobs report is the next test.
Read more about best gold trading strategies
Check about How to Trade Gold (XAUUSD)
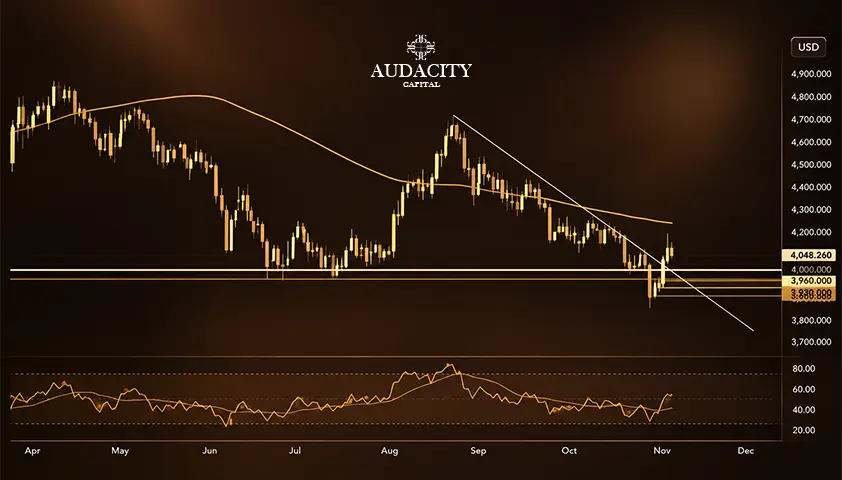
Gold (XAU/USD) Daily Chart, November 6, 2026
Source: TradingView
Levels to watch (daily timeframe):
- Resistance: $4,107 (today's high), then the 5 November high at $4,147. Above that, the 100-day MA sits around $4,200.
- Support: $4,035 (today's low), then $4,000, the key pivot and the level of the broken trendline. Below that sit $3,970 and $3,920.
Potential Setups:
- Bullish retest: Gold has broken above the falling trendline from the August high and is now pulling back to retest it. A hold above $4,000 on a daily close keeps the breakout intact, with targets at $4,147 and then the 100-day MA near $4,200.
- Invalidation: a daily close back below $3,970 would put price back under the trendline and suggest the election bounce has failed. The RSI is also still just below 50, so momentum has not fully turned bullish yet.
Read more about Best RSI Settings for the 1-Minute Nasdaq 100 Chart
Nasdaq 100 (NAS100): From policy noise to AI rout
The Nasdaq bounced on election day, but the selling came back hard on 5 November. The Nasdaq 100 fell 6.36% to 26,629.81, its steepest one-day drop since the 2020 pandemic crash. The Nasdaq Composite slid 5.5% into correction territory, the S&P 500 lost about 4.4% and the Dow shed more than 1,800 points.
The trigger was fear that the Democratic wave, including wins for governors in Texas and Ohio, could slow data-centre development. Chip and AI infrastructure stocks took the brunt: Nvidia fell more than 9%, Micron about 17% and the Philadelphia Semiconductor Index around 12%. The Magnificent 7 lost about $1 trillion in market value in a single day.
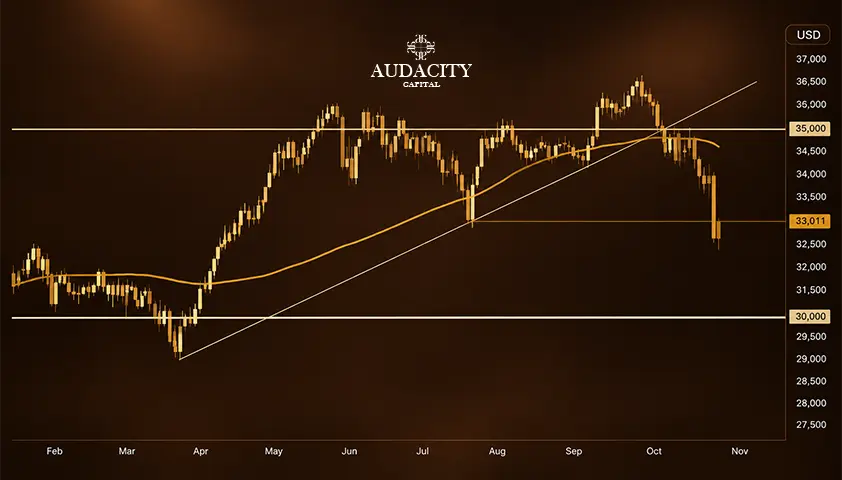
Nasdaq 100 Daily Chart, November 6, 2026
Source: TradingView
Levels to watch:
- Support: 26,273 (today's low), then the psychological 25,000 level, which lines up with the 2026 range lows from February and March.
- Resistance: 27,126, the July low that held as support before Thursday. Old support often turns into resistance. Above that sit the 28,400–28,500 area and then the 100-day MA near 29,500.
Potential Setups:
- Bullish: a daily candle close back above 27,126 would suggest Thursday's break was a washout, opening the way to a recovery towards 28,400–28,500.
- Bearish: rejection below 27,126 keeps sellers in control. The index has already broken the rising trendline from the April low and sits well under its 100-day MA, so a retest of 26,273 and then 25,000 is possible, especially if jobs or CPI data come in hot.
Read more about NQ in Trading – What is NQ in Trading?
US Dollar (DXY): Does the Fed still hold the steering wheel?
The dollar's first reaction was lower, with the index falling to about 101.26 on election day, a five-week low. It has since bounced to around 101.90. The greenback is still likely to respond mainly to the Fed story, not to Congress. In some analyst circles there has even been chatter that the result could be mildly dollar-positive over time, because it strengthens the view that the Fed is independent.
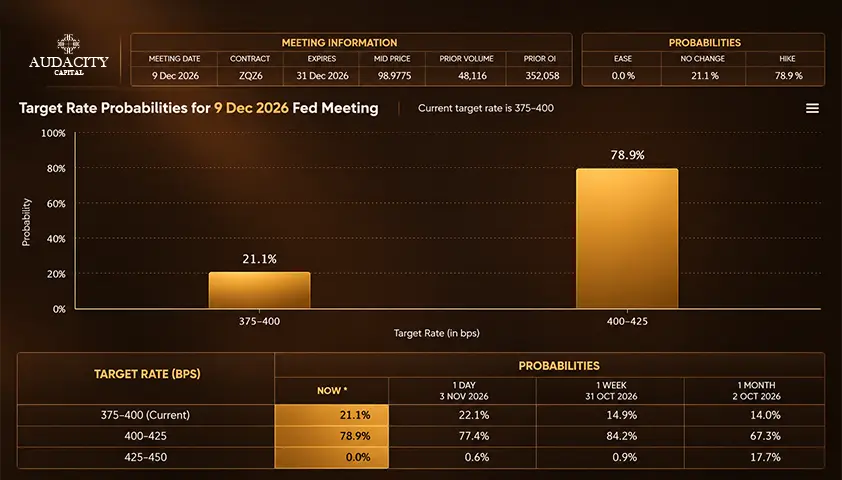
The data backdrop still supports the dollar. Q3 GDP came in at 3.4%, September CPI was 3.7% year on year and weekly jobless claims just matched a 57-year low at 189,000. The Fed held rates at 3.75%–4.00% on 28 October, with two members voting for a hike. December hike odds were around 85% after that meeting. They have since eased to roughly 70–80%, depending on the snapshot, as the 10-year Treasury yield dropped to about 4.84%, its lowest since early September.
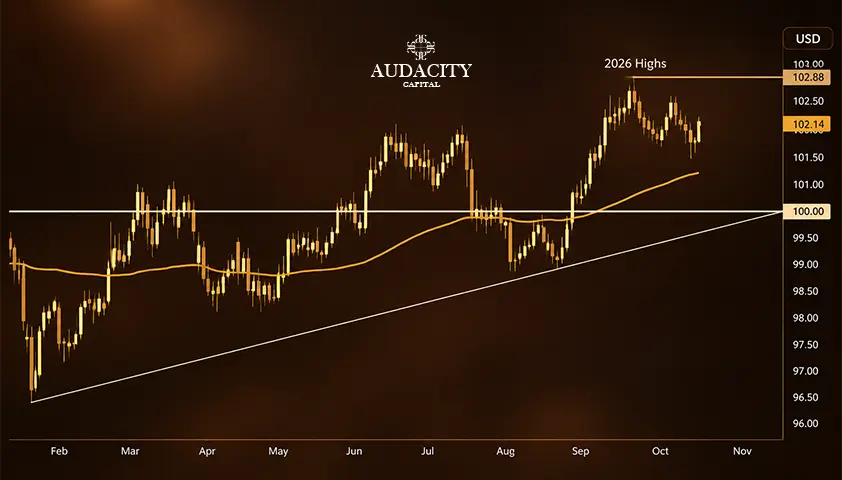
US Dollar Index (DXY) Daily Chart, November 6, 2026
Source: TradingView
Interest Rate Probabilities
Source: CME FedWatch
Levels to watch:
- Support: 101.10 (this week's low), then the rising 100-day MA around 100.75. A daily close below the 100-day MA would be the first real sign of a larger dollar downtrend. Below that sit 100.00 and the rising trendline from the February low.
- Resistance: 102.00, then 102.50, before the 2026 high at 102.96.
Pairs to watch: EUR/USD near 1.1247 is the cleanest way to express dollar weakness. USD/JPY below 158 is worth watching too. A move back towards 160 may bring intervention risk from Japan back into play.
Key dates for the rest of Q4
Date | Event | Why it matters |
|---|---|---|
Fri 6 Nov | US jobs report (October NFP) | Today's big test; a firm print could restore December hike odds |
Tue 10 Nov | US CPI (October) | Inflation at 3.7% keeps December hike odds high |
Nov–Dec | Lame-duck Congress | Headline risk until the new Congress is sworn in on 3 January 2027 |
Thu 26 Nov | US Thanksgiving | Thin liquidity; watch for exaggerated moves |
Early Dec | US jobs report (November NFP) | Last major data before the Fed |
8–9 Dec | FOMC decision plus new projections | The main event of Q4 for all three markets |
Rest of Q4 2026: potential scenario playbook
Scenario | Trigger | Gold | Nasdaq 100 | US Dollar |
|---|---|---|---|---|
1. Hawkish Fed wins (base case) | Strong NFP and CPI; Fed hikes in December | Struggles to hold $4,000; risk of a drop to $3,920 | Capped below 27,126; risk of a move to 25,000 | Rebounds towards 102.50, then 102.96 |
2. Gridlock plus softer data | Weak jobs or cooler CPI cast doubt on a December hike | Breaks $4,147, targets the 100-day MA near $4,200 | Reclaims 27,126; recovers towards 28,400–28,500 | Breaks below the 100-day MA near 100.75 |
3. Political shock | Debt ceiling brinkmanship, impeachment headlines, new tariffs | Safe-haven bid may finally come into play | Volatile, downside risk to 25,000 | Mixed: haven demand vs. political risk |
Q4 2026 outlook summary
- History is on the bulls' side, with one big caveat. The S&P 500 has been higher 12 months after every midterm since 1950, gaining about 15% on average. In 2018 though the index fell nearly 20% from its autumn high into late December, which was tied to a December Fed hike. That is the parallel traders need to keep in mind this year.
- Yields tend to ease after midterms. Data shows that 10-year Treasury yields have fallen by about 20–25 basis points on average in the three months after past midterms. The 10-year has already dropped to around 4.84%, its lowest since early September.
- The big houses are still constructive, but selective. BlackRock's Q4 update is neutral on US stocks but leans into AI, and it is overweight short-term Treasuries. The BEAT Q4 guide expects the bull market to pick up again once the forces pushing yields higher fade. It favours a broadening beyond tech into financials and small and mid-caps. (Both of these outlooks were delivered prior to the US Midterms)
- Energy is the wildcard. Brent fell nearly 9% on 4 November on hopes that the Democratic gains reduce the risk of further escalation with Iran, and it remains below $100. Refined-product markets are still tight, though, and a renewed oil spike would feed inflation and support a hawkish Fed.
How to prepare: a playbook for funded traders
The weeks ahead are likely to bring wider ranges, sharper spikes and more headline risk. Here is how to trade them without putting your account at risk.
- Know your numbers before you trade. Check how much room you have left on your daily loss and maximum drawdown limits before the session starts. If one losing trade, or a gap through your stop, could breach either limit, the position is too big.
- Cut size when volatility rises. Gold covered around $130 from high to low on election day, and the Nasdaq 100 fell more than 6% a day later. If you widen your stop to allow for bigger swings, reduce your position size so the amount you risk stays the same. Many traders halve their usual risk per trade around NFP, CPI and the FOMC.
- Respect the release window. Spreads widen and slippage rises in the minutes around major data. Avoid opening new trades just before a release, and decide in advance whether you will hold open positions through it.
- Watch your correlation. Long gold, short USD/JPY and long EUR/USD are all, at heart, the same weak-dollar trade. Holding all three stacks your risk against a single drawdown limit.
- Let the daily close confirm. Intraday headlines can whipsaw price. The potential setups above are based on daily closes for a reason.
FAQ
Investors fear the Democratic sweep could bring tighter rules on data centres, which would hurt chip and AI stocks. The Nasdaq 100 fell more than 6% on November 5.
Lower Treasury yields, a weaker dollar and cheaper oil have all helped. Gold is back above $4,000 and hit a two-week high near $4,147.
No, the Fed is still the main driver. Markets see a roughly 70–80% chance of a December rate hike.
CPI (Nov 10), the December jobs report and the Fed meeting on December 8-9.
Know your drawdown limits, trade smaller when volatility rises and wait for a daily close to confirm setups.

Bereit, diszipliniertes Risiko auf Krypto anzuwenden? Entdecken Sie die neuen Krypto-Instrumente von Audacity Capital und bringen Sie Ihre Trading-Strategie mit.
Mehr erfahrenNewsletter
Treten Sie unserem Newsletter bei, um auf dem Laufenden zu bleiben.
Treten Sie unserer sozialen Gemeinschaft bei

Beginnen Sie Ihre Reise heute Mit unserer kostenlosen Testversion
Präsentieren Sie stolz Ihre Fähigkeiten und Leistungen durch Zertifikate und erhalten Sie Anerkennung für Ihre harte Arbeit und Ihr Engagement von potenziellen Investoren und Kollegen.
Kostenlose Testversion