


Harmonic Patterns: Gartley, Butterfly, and Bat Explained


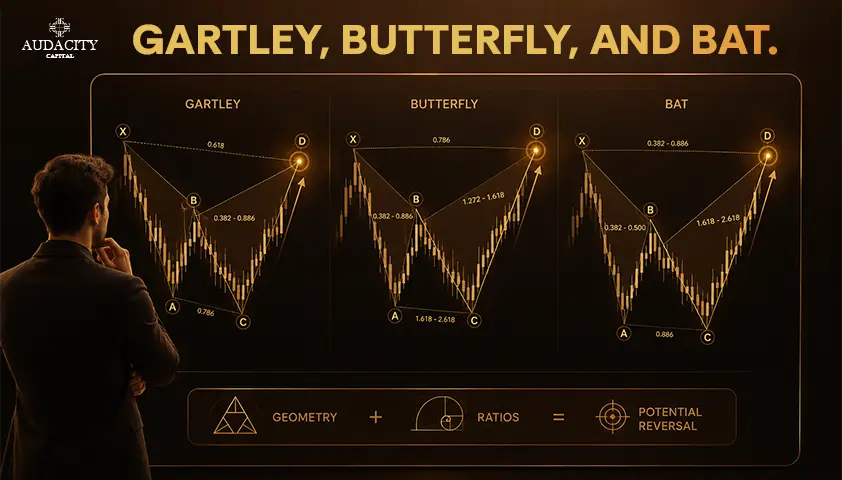
Harmonic patterns are the XABCD price structures that use certain Fibonacci ratios between their legs in order to determine a reversal zone.
The patterns don’t give any guarantees of reversal; however, they provide a measurement framework that can qualify or disqualify a setup before you risk capital.
The Gartley, Butterfly, and Bat patterns have the same five components. The difference is in the retracement at B and the completion at D.
This difference influences the geometry of the pattern, the position of the reversal zone and the management of the trade.
Checking the actual ratios is what makes this method rules-based instead of just drawing certain shapes after the move took place.
What Are Harmonic Patterns?
Start by asking yourself if you can measure the structure. If you don't have a pivot point and a retracement, then there's no pattern to trade.
Harmonic patterns consist of five points and are called X, A, B, C, and D. It is not defined only by its shape.
The ratio of retracements and extensions in XA, AB, BC, and CD should fit into the ratios of the specific pattern you claim. If the ratios don’t meet the criteria, the setup is invalid even if the drawing looks right.
There is only one main idea behind harmonic trading: projection of the Potential Reversal Zone, or PRZ. This is the point where several Fibonacci tools coincide.
When price reaches this area, traders look for rejection or reversal.
This is one of the common mistakes made by beginners in harmonic trading. Point D closes the measurement framework. It does not confirm a trade. The price action around D still needs to show whether the zone is being respected.
How the XABCD Structure and Fibonacci Ratios Work?
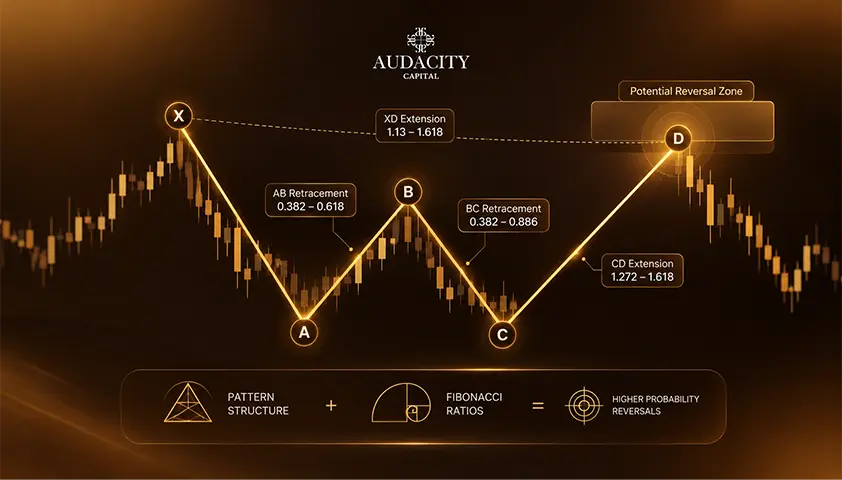
Prior to initiating a trade, you should consider all four legs in sequence. All of them should comply with requirements for this pattern.
The XABCD pattern has four segments.
XA is the first impulse move, AB is the retracement of XA, BC is the retracement of AB, and CD is the last leg which moves into the projected completion zone.
Traders compare B to XA and C to AB. After that they use the required XA retracement or extension, as well as BC and CD projections, to calculate D.
The information we need does not come from just one Fibonacci ratio. It comes from Fibonacci confluence, when several ratios cluster within a tight zone. That cluster forms the PRZ.
In real charts it is very rare that the ideal ratio is reached on the exact tick. Some small tolerance is allowed, but this tolerance must be taken from your methodology. Avoid mixing different ratio tables.
Stick to one convention for Fibonacci retracement and extension.
Gartley Pattern: Structure, Ratios, and Setup
Begin with B. Does it retrace approximately 61.8% of XA?
Next check D. Is it completed within the original XA formation? If any one of these is not fulfilled, it is not a standard Gartley formation.
Gartley is a retracement formation. Point D completes within the XA leg rather than beyond point X. In the commonly cited reference formation, B completes approximately at the 61.8% retracement of XA and D at the 78.6% retracement.
The BC and CD relationships must also be considered. This formation cannot be boiled down to just two ratios. The PRZ should be derived through overlapping calculations and not from one 78.6% line.
Here is an illustrative hypothetical bullish case.
Assume X is at 100 and A is at 120. B retraces to 107.6, very near the 61.8% retracement level of XA. C advances to 116, staying within the AB-XA range.
Price subsequently falls back to the 104 to 105 region. This is near the 78.6% retracement of XA and is the projected region for D.
Before looking at an entry, define the invalidation point. If the price falls significantly below X at 100, the thesis is invalidated.
Then consider entering a trade only after confirmation within the PRZ. The criteria for confirmation may include a clear rejection candle, a momentum divergence, failure to fall further down in the zone, or a change in the lower timeframe structure.
Butterfly Pattern: Structure, Ratios, and Setup
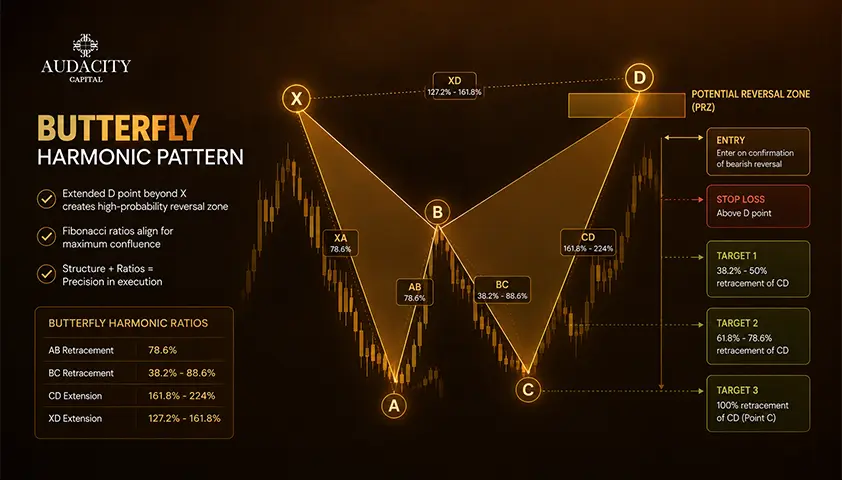
The Butterfly is an extension pattern. The traditional structure of the pattern sets point B close to the 78.6% retracement of XA. Point D is then extended beyond X in an XA extension.
There are different D conventions published by various sources. Use one tested methodology, not multiple ratio tables of different guides.
It is important for the extension in terms of risk as the Butterfly pattern searches for a potential reversal following the formation of a new extreme beyond X. With many other patterns, it would have invalidated the structure. Here it is an integral part of the geometry.
For instance, in a bullish Butterfly setup, point X is at 100 and point A at 130.
Point B retraces to 106.5, near 78.6%. C then rises to 122. Following this, the price breaks below X in an expected range of 92 to 95, driven by the XA extension and CD projection.
A break below X does not necessarily negate the Butterfly. It could be what is expected to happen. What matters is whether price is able to hold the projected zone.
Confirmation of the Butterfly at D means waiting for signs of rejection within the PRZ before considering the low point as a potential reversal candidate.
The invalidation level should come from the definition chosen by you. It would usually be a breakout of the projected D zone making the structure nonviable, instead of a standard stop-loss percentage.
Bat Pattern: Structure, Ratios, and Setup
B should be your first target in the validation process. If the retracement is too deep, the structure is not a Bat no matter how the drawing looks.
The Bat is yet another retracement pattern. However, it has a unique ratio profile. The most common construction has a shallower B retracement compared to the Gartley. D completes deeper around the 88.6% retracement of XA.
Thus, D is near X without moving beyond it. You may end up with a clearly outlined invalidation zone just beyond X.
The tight geometry is a double-edged sword. It gives you a neat area to analyze but punishes you if you rely on sloppy measurement. Estimating the shape of an "M" or "W" on your chart will not help you differentiate a Bat from a Gartley lookalike.
Consider two candidates on the same chart.
For the first pattern, X is at 100, A is at 120, and B retraces to 110. This is nearly a 50% retracement of XA. Too shallow for a Gartley and a good fit for a Bat, so you can continue checking C and D.
For the second possible pattern, B retraces to 107. Nearly a 61.8% retrace. That is too deep for a Bat under the standard definition. It may qualify as a Gartley pattern but it shouldn't be traded as a Bat.
Typically, Bat invalidation is just beyond X. When price moves beyond X the deep 88.6% completion premise becomes irrelevant.
Gartley vs Butterfly vs Bat: What Changes?
The three patterns share a skeleton but differ in the two measurements that matter most: how deep B retraces, and where D completes.
Pattern | B relationship to XA | D relationship to XA | D inside or beyond X | Typical character | Main validation question |
Gartley | Near 0.618 | Near 0.786 | Inside XA | Balanced retracement | Do B and D sit at their reference retracements with BC and CD confluence? |
Bat | Shallower, often near 0.382 to 0.500 | Near 0.886 | Inside XA, close to X | Deep completion, tight invalidation | Is B shallow enough to disqualify a Gartley reading, and does D cluster near 0.886? |
Butterfly | Near 0.786 | Beyond X via XA extension | Beyond X | Extension with new extreme | Does price hold the projected zone beyond X, or continue trending? |
A Gartley uses a moderate B retracement and completes inside XA. A Bat starts with a shallower B and completes deeper, near X. A Butterfly uses a deeper B and completes beyond X.
Treat these ratios as commonly used reference values from the methodology you have chosen. Do not combine conflicting ratio tables from different sources.
How to Trade a Harmonic Pattern at the Potential Reversal Zone
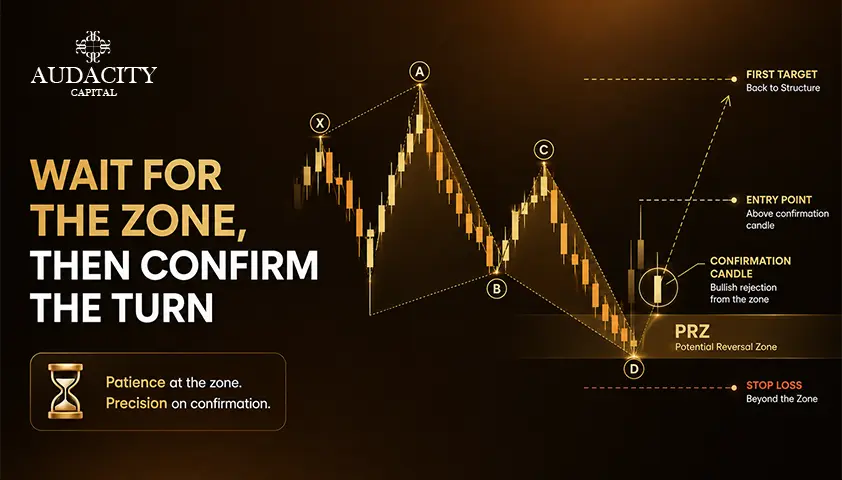
Once a candidate qualifies, the trade decision is a sequence, not a single moment. Follow it in order.
Step 1. Mark clean swing points. Identify X, A, B, and C from pivots that were visible before D formed. Do not redraw pivots after the fact to make the pattern fit.
Step 2. Measure each leg. Check B against XA, C against AB, and the projected D using the retracement or extension your pattern requires. If the numbers do not qualify, reject the setup.
Step 3. Build the PRZ from confluence. Overlap the XA retracement or extension with the CD projection and any BC-based projection your methodology uses. Treat the result as a zone, not one perfect price.
Step 4. Wait for evidence. PRZ trading is not a touch-and-buy method. Watch how price behaves inside the zone: rejection candles, momentum divergence, failure to extend, or a shift on a lower timeframe. The confirmation should answer whether price is actively rejecting the zone rather than simply reaching it.
Step 5. Define invalidation before entry. The stop belongs beyond the level that breaks the pattern thesis. For a Gartley or Bat, that is typically beyond X. For a Butterfly, it is beyond the projected D. Arbitrary fixed-percentage stops do not reflect the geometry.
Step 6. Plan targets before entry. Use nearby structure, prior swing points, or Fibonacci retracements of the AD leg as testable target frameworks.
Calculate the risk-reward ratio from your actual stop and target rather than assuming the pattern automatically offers a favorable payoff.
A useful mental flow is: candidate, measure, PRZ, confirm, invalidate, target.
If one step fails, there is no trade to force.
Common Harmonic Pattern Mistakes and Validation Rules
The most costly mistakes in harmonic trading patterns are not exotic. They are the same errors repeated across markets.
- Eyeballing the shape without measuring the legs. A harmonic setup that has not been measured is not a harmonic setup.
- Forcing swing points after the fact. Pivots you would not have marked in real time do not count.
- Mixing ratio conventions. Different harmonic methodologies use slightly different D projections. Pick one and stay with it.
- Treating D as an automatic entry. Completion is geometry. Confirmation is behavior.
- Ignoring higher-timeframe context. A textbook PRZ against a strong dominant trend is not the same setup as one aligned with structure.
- Placing the stop where the pattern is still valid. A stop inside the invalidation area exits you on normal fluctuation.
- Judging the method from a few charts. Cherry-picking completed patterns is not a test. A real evaluation applies one precise definition to many candidates.
There is also a hindsight problem worth naming directly. Completed harmonic charts are easy to find after a reversal. A bearish harmonic pattern looks obvious once price has already turned down from D.
A valid test must identify the pattern using only the information available before the outcome.
The practical fix is journaling. Record the exact pattern type, measured ratios, PRZ width, confirmation used, invalidation distance, and result in R. This turns a visual method into something you can actually evaluate.
Conclusion
Harmonic patterns give traders a way to turn an XABCD structure into a measurable setup. They do this by requiring defined Fibonacci relationships between the legs.
Gartley, Butterfly, and Bat patterns share the same skeleton. Their B retracements and D completions differ, which changes the reversal zone and invalidation logic.
The sequence is what matters: classify the pattern, verify the measurements, build the PRZ from confluence, wait for confirmation at D, then define invalidation and targets before entering.
If the ratios do not qualify, there is no harmonic trade to force. Used this way, harmonic trading becomes a process of measurement and validation rather than a search for shapes.
Frequently Asked Questions
Reliability depends on the exact definition, market, timeframe, costs, and confirmation rules used. There is no universal reliability figure that applies across all harmonic setups. What can be tested is a specific ruleset applied consistently to a defined dataset, with results measured in R.
Both complete inside the XA range, but the ratios differ. A Gartley typically shows B near 0.618 and D near 0.786 of XA. A Bat typically shows a shallower B and a deeper D near 0.886 of XA, placing completion much closer to X.
The Gartley completes inside XA. The Butterfly completes beyond X using an XA extension. B is also typically deeper on the Butterfly, near 0.786, compared with 0.618 on the Gartley. The two patterns imply different invalidation levels and different trade management.
The Potential Reversal Zone is the area where the pattern's Fibonacci measurements converge around point D. It is a zone, not a single price. Traders watch the PRZ for evidence of rejection before considering entry, since completion of the geometry does not by itself confirm a reversal.
Harmonic patterns can be measured on any market with reliable price data. Whether they produce useful setups depends on liquidity, volatility, session structure, and cost. The same ruleset can behave very differently across markets, which is why testing on the specific instrument you trade matters.
There is no single best timeframe. Higher timeframes tend to produce fewer, cleaner structures. Lower timeframes produce more candidates but with more noise. The right timeframe is the one where your rules produce measurable, repeatable setups that fit your available time and risk tolerance.
Yes. Point D marks completion of the geometry, not confirmation of a reversal. Waiting for price action evidence inside the PRZ, such as a rejection candle, divergence, or a lower-timeframe structure shift, is what turns a completed pattern into a defined-risk trade.

¿Listo para aplicar un riesgo disciplinado a las criptomonedas? Explore los nuevos instrumentos de cripto de Audacity Capital y traiga su estrategia de trading.
Aprender másBoletín
Únase a nuestro boletín para mantenerse al día.
Únete a Nuestra Comunidad Social

Comienza Tu Viaje Hoy Con Nuestra Prueba Gratuita
Muestra con orgullo tus habilidades y logros a través de certificados y obtén reconocimiento por tu arduo trabajo y dedicación de posibles inversores y compañeros.
Prueba GratuitaArtículos Relacionados

Micro Futures Contracts Explained
What micro futures contracts are, why a smaller size does not mean lower risk, the margin trap that catches small accounts, and what they actually cost.


What Is BOS in Trading? A Complete Guide to Break of Structure (2026)
Learn what BOS in trading means, how Break of Structure works, how to identify bullish and bearish BOS, and how traders use it in market analysis.

Liquidity Sweeps Explained: How to Identify and Trade Them
Learn what a liquidity sweep is, how to identify bullish and bearish sweeps, spot sweeps vs breakouts, and use price action and market structure for confirmation.

Best Trading Simulator Apps in 2026: Practice Trading Risk-Free
Compare the best trading simulator apps in 2026 for stocks, forex, futures and crypto. See features, markets, realism, pricing and beginner-friendly options.