


On-Balance Volume (OBV) Indicator: Explained


%20Indicator__webp__orig.webp)
On-Balance Volume (OBV) is a momentum indicator that adds a period's volume to a running total when price closes up and subtracts it when price closes down, plotting a single cumulative line traders use to confirm trends and spot divergences.
Developed by Joe Granville and first published in his 1963 book, which was based on the concept that volume leads price.
This guide explains what OBV is, how to calculate it, how to interpret its direction, how to use it for confirmation and divergence, and its limitations.
The most important idea to hold onto: OBV's absolute number is meaningless. Its slope against price is the only part that is informative.
*This information is for educational purposes only and is not a form of financial advice. OBV is a confirmation and early-warning tool. It does not work well as a standalone signal. There's no guarantee of results, and the majority of retail traders lose money.
What On-Balance Volume (OBV) Is
On-balance volume indicator is a cumulative measure of the buying and selling pressure.
This measure adds the volume of the period to the cumulative total if the price closes higher; subtracts it if the price closes lower.
An upward-trending OBV indicates that buying pressure is dominant.
A downward-trending OBV indicates that selling pressure is dominant.
The OBV was created by Joe Granville and introduced in his 1963 book, "Granville's New Key to Stock Market Profits." This was among the first indicators created to monitor volume flows and not just prices.
The concept of this indicator is very simple: volume precedes prices, so pressure builds up in the tape first and then in the charts. It's not a rule, it's a theory and it should be remembered when you see a divergent calling for a trade.
How OBV Is Calculated?
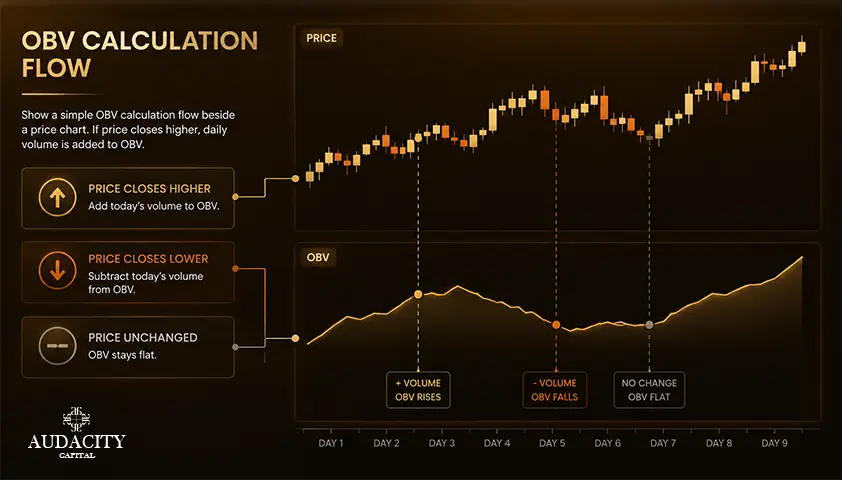
This rule is applied on the close of each period.
- If today's close is higher than yesterday's, today’s volume is added to the running total.
- If today's close is lower than yesterday's, today's volume is subtracted.
- If the close remains the same, OBV remains unchanged.
The output is a single line: an accumulated total which increases when up-days outweigh down-days, and decreases when down-days outweigh up-days.
The following is a simple worked example. Start with an initial OBV of 0.
Day | Close vs. Prior | Volume | OBV Action | Running OBV |
1 | Up | 12,000 | +12,000 | 12,000 |
2 | Up | 8,000 | +8,000 | 20,000 |
3 | Down | 15,000 | -15,000 | 5,000 |
4 | Unchanged | 6,000 | 0 | 5,000 |
5 | Up | 10,000 | +10,000 | 15,000 |
The figure above shows that the cumulative total ends at 15,000. This figure is completely arbitrary; if the calculation were to start from 1,000,000, the cumulative total would end up being 1,015,000, and the shape of the line would be identical.
The actual figure has no real significance. The objective of OBV is to be able to interpret the trend and to confirm the price or oppose it.
Note on platforms: different charting tools use smoothing or different starting points for cumulative totals, therefore it is not possible to compare OBV values among charts. Make sure to check how your platform draws the line before drawing conclusions.
How to Read OBV: Direction, Not the Number?
The most common error that traders make with OBV is interpreting the value itself. This value is arbitrary because the cumulative figure is derived from an arbitrarily selected point on the chart. More important than the value itself is its slope and its correlation with price action.
1. Trend Confirmation
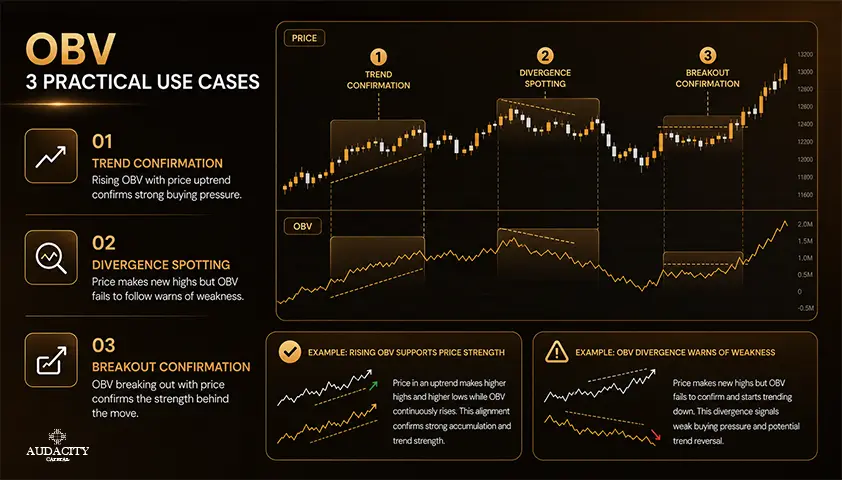
An increasing OBV along with the increasing price is an indication that the uptrend is supported by the volume, and therefore it is strong. A decreasing OBV along with the decreasing price is an indication of selling pressure supporting the trend. Agreement between OBV and price is the trend confirmation read. Its as simple as that.
2. Divergence
The reputation of OBV is largely due to the divergence, which has two types:
- Bearish divergence: While prices make a higher high, OBV makes a lower high. There is buying pressure that is not confirming the new price high, which is a warning sign that the uptrend may be weakening.
- Bullish divergence: While prices make a lower low, OBV makes a higher low. Selling pressure has waned while prices continue to fall. This can warn about a weakening trend.
OBV divergence is a type of early-warning system. Divergences can last for weeks or even months, and they can also fail completely. The final call rests with price.
In conclusion, OBV should be treated as a comparative tool. Compare its slope with the price. Never trade just because OBV shows some figure.
Always wait for confirmation from price when you see a divergence.
How to Use OBV in Your Trading?
If you are curious about using OBV indicator signals in the right way, then take OBV as a supplemental tool and not as a standalone system. A few practical applications:
1. Confirmation of the current trend
When you are already in an active trade or thinking about going into one, a rising OBV along with the price confirms your long position. A declining OBV along with the price confirms your short position.
However, if the OBV shows contradiction against the current trend that you are in, then treat it as a warning sign and not as a reason to reverse blindly.
2. Watching for divergence at key levels
When divergences form on the significant levels of support and resistance, they become even more valuable. A bullish divergence forming near a strong support is more valuable than that forming somewhere in the middle of a range.
Still, wait for price to break structure or produce a confirming pattern before acting.
3. Reading OBV around breakouts
A break of the OBV trendline or reaching a new local high or low in the OBV line prior to the price can be used as the indicator of change in volume flow. The indicator should always be used in conjunction with a price breakout and never on its own.
4. Combining with other tools
OBV is more effective in confluence. Use it in conjunction with price structure, a momentum indicator like the relative strength index (RSI) or moving averages for directional context.
Accumulation and distribution studies can provide some depth where OBV might be too coarse. OBV is not an entry, rather it is a supporting read.
All uses here are illustrative. Always validate with price, test with your own data, and don't expect any guarantees.
Limitations and Common Mistakes
Here is the credibility check. OBV has real weaknesses, and understanding them is the difference between using it well and using it badly.
The core flaw: OBV weights all volume equally
OBV adds the full period's volume whether price closed up by a fraction of a percent or by several percent. A tiny move on a huge volume counts exactly the same as a large move on the same volume.
That makes OBV a blunt measure of pressure.
Indicators like Accumulation/Distribution and the volume price trend (VPT) were built partly to address this, weighting volume by where price closed within the range or by the size of the move.
Other limitations
- The absolute value is arbitrary and cannot be compared with another platform/symbol.
- One spike in the volume can cause a false signal.
- Divergence may last much longer than anticipated and may not happen at all.
- OBV is less useful for the low volume or thinly traded instruments.
- On short intraday timeframes, the line becomes noisy and unreliable.
Common mistakes
- Using the raw OBV number as if it were a level.
- Trading on a divergence without price confirmation.
- Using OBV in markets with low trading volume.
- Taking the concept of "volume precedes price" as a rule, not a theory that sometimes works and sometimes doesn't.
The bottom line: OBV is a confirmation and early-warning indicator of volume flow. It is not a standalone signal, but rather complements price and other indicators.
The best approach to see if it enhances your process is to test it out on a demo account or a simulation account first, and document the outcomes before using real money.
Conclusion
The On-Balance Volume is a cumulative volume indicator and measures buying and selling pressure.
The value lies in its directional and divergence properties; confirming trends when the indicator confirms price action and warns of problems when it fails to do so. The raw number itself does not provide any information.
Look at the slope of the indicator relative to price action. Verify any divergence by price action and other indicators before trading.
Remember that OBV treats each day's volume equally and is thus very blunt by nature. And practice using it on a demo or simulated account first, with a journal, before risking any real money in a process that relies on OBV.
OBV is just another of many trading tools. Used correctly, it will give additional context to your analysis. Used on its own, it will never satisfy your expectations.
Frequently Asked Questions
No, the absolute value is arbitrary because the cumulative total starts from an arbitrary point set by the platform. Only the line's direction and its relationship to price carry information. Two charts of the same symbol on two platforms can show very different OBV numbers and both be correct.
It is when price and OBV move in opposite directions, for example price making a higher high while OBV makes a lower high. This warns that volume is not confirming the price move, which can precede a reversal. Divergences can also persist for a long time and fail, so they are cautions rather than triggers.
It is often described as leading because volume can shift before price does, following Granville's theory that volume precedes price. In practice, it works better as a confirmation and early-warning tool than as a reliable predictor. Treat it as context, not a forecast.
You can, but it is risky. OBV is a blunt cumulative measure prone to false signals from volume spikes and failed divergences. Most traders pair it with price structure and another indicator such as the RSI or MACD to filter noise.
OBV adds or subtracts the full period's volume based only on whether price closed up or down. Accumulation/Distribution weights volume by where price closed within the period's range, making it more nuanced about how strong the buying or selling actually was. Both track volume flow, but A/D reacts to close location rather than just close direction.
It works where volume data is meaningful, such as stocks and crypto on major exchanges. Forex has no centralized volume, so OBV there relies on tick volume or a single broker's volume feed, which makes it less reliable. Interpret forex OBV readings with extra caution.
Often a single large volume spike jumped the line and distorted the slope, or a divergence simply failed to resolve. OBV also breaks down in illiquid markets and on very short timeframes. This is why signals should be confirmed by price action rather than traded in isolation.
It works on any timeframe, but it is cleaner on daily and weekly charts where volume is meaningful and less prone to spikes. Short intraday charts introduce noise that can distort the cumulative line. Match the timeframe to the market you are trading and the type of decision you are making.

¿Listo para aplicar un riesgo disciplinado a las criptomonedas? Explore los nuevos instrumentos de cripto de Audacity Capital y traiga su estrategia de trading.
Aprender másBoletín
Únase a nuestro boletín para mantenerse al día.
Únete a Nuestra Comunidad Social

Comienza Tu Viaje Hoy Con Nuestra Prueba Gratuita
Muestra con orgullo tus habilidades y logros a través de certificados y obtén reconocimiento por tu arduo trabajo y dedicación de posibles inversores y compañeros.
Prueba GratuitaArtículos Relacionados

Cross Trading — What Is Cross Trading?
Learn what cross trading is, how it works, its types, benefits and risks, and why cross-account trading is prohibited by many prop firms.

ICT Kill Zones and Session Timing: A Practical Guide for Intraday Traders
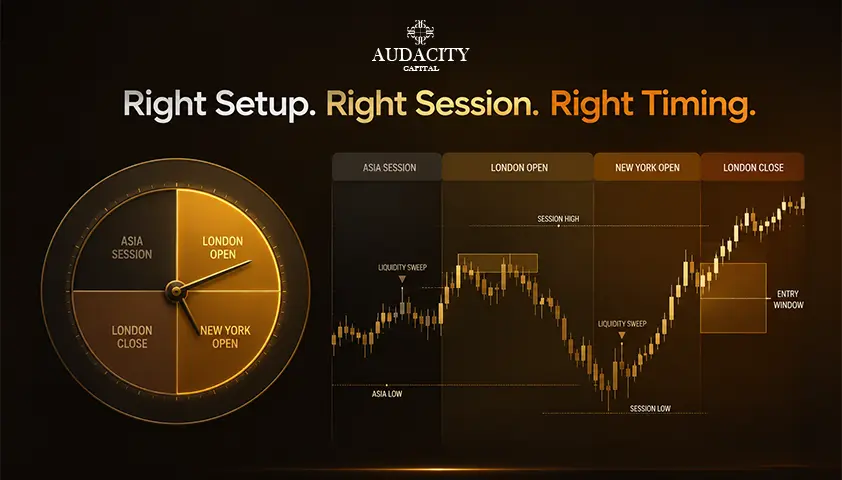
See the main ICT kill zone times for London, New York and Asia, plus DST rules and a simple workflow for using session timing.
Parabolic SAR: A Complete Guide
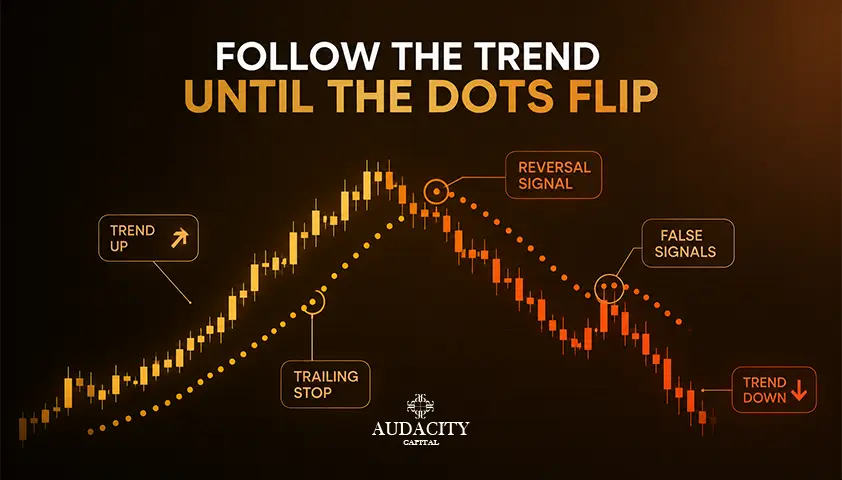
The stop-and-reverse dots show trend direction and trailing-stop levels, but they whipsaw in ranges. See how to calculate, read, and use them well.

10 Best Prop Firms in Australia for 2026
Compare 10 prop firms available to Australian traders in 2026, including their challenges, drawdown rules, payouts, platforms and key differences.