


Bollinger Bands Strategy: A Practical Guide to Setups, Rules, and Risk


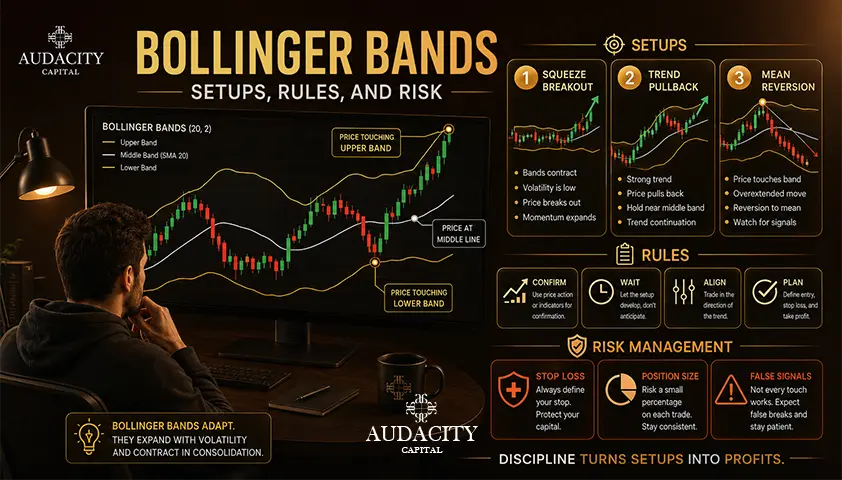
A Bollinger Bands Strategy uses a moving average and two volatility-adjusted outer bands to build rules for breakouts, mean reversion, or trend continuation.
It is not a single buy-and-sell system, and it does not predict where price will go next. The bands describe where price sits relative to its recent average and how much that average has been moving.
That distinction matters because of a common shortcut: traders assume a touch of the upper band is a sell and a touch of the lower band is a buy. The same event can mean an extreme inside a range or genuine strength inside a trend.
To use a Bollinger Bands Strategy with any consistency, you first understand what the bands measure, then identify whether the market is ranging, trending, or compressing, and only then choose the setup that fits.
What Bollinger Bands Are and How They Work?
Bollinger Bands are a three-line volatility indicator built on a moving average and a measure of price dispersion.
The middle band is commonly a 20-period SMA. The upper band and lower band sit a chosen number of standard deviations above and below that average, with two deviations as the usual starting point.
Because the calculation uses recent price data, the outer bands widen when variation expands and contract when variation falls.
Treat the default 20-period, two-deviation values as a testing baseline rather than a universal best.
The period counts chart bars, not clock time, so 20 bars means something very different on a 5-minute chart than on a daily chart. The same instrument can look calm on one timeframe and volatile on another using identical Bollinger Bands settings.
Two related readings help you compare band behavior over time:
- BandWidth measures the distance between the outer bands relative to the middle band. It highlights contraction and expansion.
- %B shows where price sits within or beyond the bands as a single number, which is useful for coding rules and scanning.
The bands describe relative price location and changing volatility. They do not tell you the next direction.
Read the Market Condition Before Trading the Bands
Before choosing an entry, decide which market regime you are in.
An outer-band touch on its own only tells you that price is high or low relative to its recent average and current volatility. It does not force a reversal.
To turn that observation into a trade, classify the market first using information available before you enter.
Three practical conditions cover most cases:
- Range: The middle band is relatively flat, and price rotates repeatedly through the average.
- Trend: The middle band is clearly sloped, and price interacts more often with one side of the envelope.
- Compression: The outer bands are unusually narrow compared with recent history, which can precede a volatility expansion.
Match each condition to the setup that fits it:
Market condition | Band behavior | Suitable setup | Main confirmation | Main failure risk |
Range | Flat middle band, price rotates around it | Mean reversion | Close back inside the band, structural rejection | Range breaks and turns into a trend |
Trend | Sloped middle band, band walk on one side | Trend continuation | Pullback to middle band followed by resumption | Countertrend fade against strong momentum |
Compression | Narrow BandWidth, tight range | Volatility breakout | Confirmed close beyond structure, expanding bands | Intrabar spike followed by close back inside |
Band walk deserves a short note:
Repeated closes near the upper band during an uptrend, or the lower band during a downtrend, often reflect persistent momentum rather than exhaustion. Fading a band walk without a regime filter is one of the most common ways this indicator loses money.
Bollinger Band Squeeze Breakout Strategy
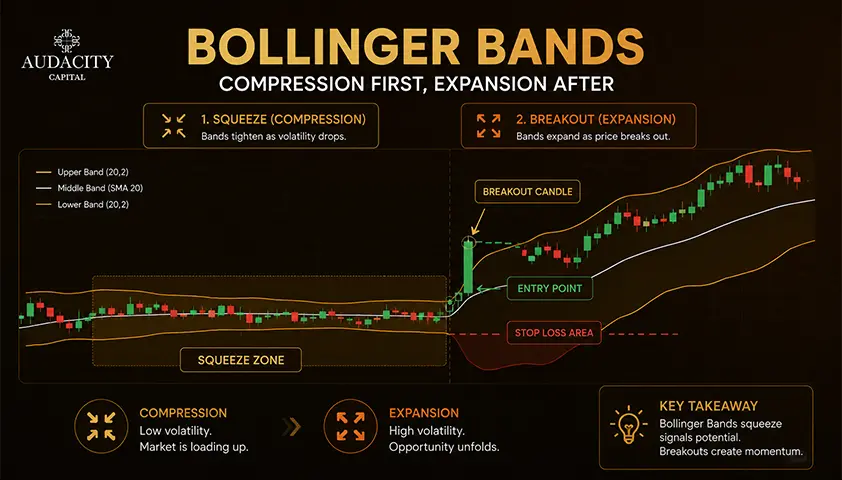
The Bollinger Band squeeze strategy starts with compression, not with a directional prediction.
A squeeze is unusually low BandWidth relative to the instrument's own recent history.
There is no fixed BandWidth number that works across every market, so define "unusual" for the chart you are trading.
Once the Bollinger squeeze is in place, wait for price to build a recognizable range or structure inside the compression, then look for a completed close beyond that boundary while the bands begin to expand.
Two common entry choices:
- Enter on the confirmed breakout close.
- Wait for a retest of the broken level that holds, then enter.
The first participates earlier and takes on more false-break risk.
The second waits for stronger confirmation and accepts that some moves will run without you.
Place the stop loss where the breakout thesis fails, for example back inside the pre-breakout range or beyond the opposite side of the structure.
Exits can use structure, a tested reward-to-risk multiple, or a volatility breakout trail based on the expanding bands.
The dominant failure mode is a false breakout: an intrabar spike outside the band followed by a close back inside. News releases, thin liquidity, spread expansion, and slippage all make these worse. If you trade squeezes on lower timeframes, factor those costs in from the start.
Bollinger Band Mean-Reversion Strategy
This setup only belongs in a range or in a market with a stable mean. Applying it to a trending chart is where most traders get hurt.
Do not treat a band touch on its own as a signal. Stronger triggers include:
- A close outside the band followed by a close back inside.
- Rejection at established support or resistance that lines up with an outer band.
- A failed break of the range, where price probes beyond the boundary and returns.
The middle band can serve as a first objective, since price often rotates back through it inside a range.
The opposite side of the range can be a later target, but only while the range is still valid. The middle band moves as new bars form, so it is a reference, not a guaranteed exit.
Place stops beyond the structural point that invalidates the range, and cap the number of attempts you take before stepping aside.
Repeatedly averaging into losers is how a mean reversion trader ends up short of a trending market.
The main failure mode is simple: the range breaks and price begins walking the outer band. The regime filter is what separates a valid setup from a countertrend mistake.
Do not describe lower-band price as inherently cheap or upper-band price as inherently expensive. It is only extreme relative to recent volatility.
Bollinger Band Trend-Continuation Strategy
The same indicator can be used the opposite way inside a trend.
Repeated interaction with the upper band during an uptrend often reflects strength, and repeated interaction with the lower band during a downtrend often reflects weakness.
Instead of fading those touches, use them as confirmation of the prevailing direction.
One workable trend continuation setup:
- Confirm a sloped middle band and clear market structure.
- Wait for a pullback toward the middle band or the inner half of the envelope.
- Enter on an entry signal that shows price resuming in the trend direction, such as a rejection candle or a break of a minor counter-swing.
A decisive close outside the band with expanding BandWidth can also be treated as a momentum event rather than something to fade automatically. You need a rule for confirmation and a separate rule for failed continuation, so you exit when the thesis is wrong.
Possible exit rules include a close through the middle band, a break of the most recent swing, a volatility-based trail, or a fixed rule you have tested. One countertrend candle at the outer band is not an exhaustion signal on its own.
Best Bollinger Bands Settings to Test
There is no universal best when it comes to Bollinger Bands settings.
The standard 20-period, two-deviation setup is a sensible baseline because it is widely used and well documented, not because it is optimal for every instrument.
Each adjustment has a predictable effect:
- Shorter periods react faster and create more signals, with more noise.
- Longer periods smooth the middle band and produce fewer, later signals.
- Smaller deviation multipliers create more band interactions.
- Larger deviation multipliers produce fewer and more extreme interactions.
Timeframe matters because periods count bars. Twenty bars on a 5-minute chart covers roughly 100 minutes. On a 1-hour chart, it covers about 20 hours. On a daily chart, it covers roughly four trading weeks. None of those is inherently better. They answer different questions.
Your parameters should follow your strategy hypothesis.
A squeeze breakout, a range fade, and a continuation setup do not have to share identical parameters. When you test alternatives, change one variable at a time and validate the result on data your development did not touch.
Parameter change | Likely effect | Main trade-off | Overfitting risk |
Shorter period | Faster reaction, more signals | More noise and whipsaws | High if tuned to a small sample |
Longer period | Smoother middle band | Later entries and exits | Moderate |
Smaller deviation | More band tags | Weaker extremes, more false signals | High |
Larger deviation | Rarer, stronger tags | Fewer trades, longer waits | Moderate |
Risk Management and Backtesting
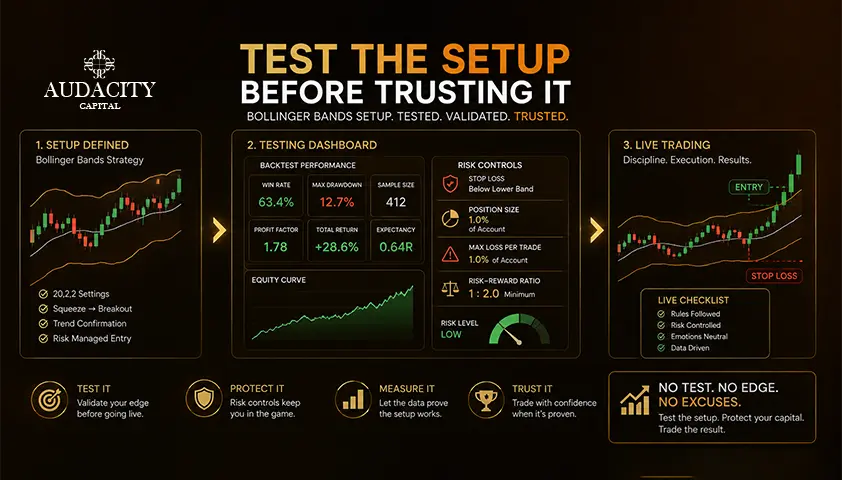
A setup identifies a condition. It does not size the trade for you.
Every rule set still needs an exact entry trigger, a written invalidation point, a target or trailing exit, and a position size that reflects the distance between entry and stop.
Place stops where the trade idea is wrong, not automatically just beyond a moving band. Calculate position sizing from your entry-to-stop distance, then include point value, spread, commission, and expected slippage in the risk figure.
Watch out for correlated exposure.
Several trades on related currency pairs, indices, or sector stocks can turn into one concentrated volatility position even when each ticket looks small on its own.
For backtesting, define the following in observable terms:
- Instrument and timeframe.
- Market condition filter that qualifies a chart for the setup.
- Entry, stop, exit, and re-entry rules.
- Realistic transaction costs, including spread and slippage.
Test the rules across favorable and unfavorable regimes, not only the periods where the setup felt easy.
Reserve an out-of-sample window or a forward test before you rely on the results. Report trade count, average win and loss, expectancy, and maximum drawdown rather than curating screenshots.
If you trade a funded account, drawdown limits are part of your risk framework too. Review your program's daily and maximum drawdown rules before you size any strategy against them.
Common Bollinger Bands Mistakes
The most expensive mistakes with this indicator are almost always about context, not calculation.
Mistake 1: Selling every upper-band touch and buying every lower-band touch without checking the market condition.
Mistake 2: Applying mean-reversion rules during a strong trend and adding to losers as price keeps walking the band.
Mistake 3: Assuming a squeeze predicts a bullish or bearish break before price confirms the move.
Mistake 4: Over-optimizing periods and deviation multipliers, ignoring trading costs, or treating several price-based indicators as independent confirmation when they draw from the same information.
One more note: acting on an unfinished candle can change the apparent signal before the bar closes.
Completed historical bands do not repaint in the ordinary sense, but live values continue to update until the bar is done.
Myth | Reality |
Upper band = sell, lower band = buy | Band tags mean different things in ranges, trends, and squeezes |
A squeeze predicts a bullish or bearish break | A squeeze signals compression only. Direction must be confirmed by price |
Default 20,2 settings are always best | They are a baseline. Test alternatives against your instrument and timeframe |
More indicators = more confirmation | Correlated indicators repeat the same signal, they do not validate it |
Conclusion
A Bollinger Bands trading strategy is a decision sequence, not a single signal.
Understand what the bands measure, identify whether the market is ranging, trending, or compressing, choose the setup that matches, then define entry, invalidation, size, and exit before you place the trade.
Learning how to use Bollinger Bands in this order is what separates a repeatable process from guessing at outer-band touches.
Ranges, trends, and squeezes all require different responses. Start with the default settings as a baseline, include trading costs, validate your rules outside the development sample, and never risk more than the account can absorb.
Frequently Asked Questions
No. The bands describe where price sits relative to its recent average and how much that average has been moving. They summarize past behavior and current volatility, not future direction. Any directional decision has to come from a rule set built around structure, trend, and confirmation, not from the bands alone.
Completed historical bands do not repaint in the usual sense. Live values do continue to update as long as the current bar is unfinished, so a reading you see mid-candle can shift by the close. If your rules depend on a specific band value, wait for the bar to complete before acting.
BandWidth measures how wide the outer bands are relative to the middle band. Falling BandWidth indicates contraction and often precedes an expansion, while rising BandWidth indicates that volatility is already expanding. It is a context tool, not a directional signal.
Bollinger Bands for day trading work only when your rules account for intraday noise and cost. Lower timeframes carry more false signals, wider relative spreads, and more slippage, which all reduce the edge of a raw band-touch approach. If you want to use Bollinger Bands for day trading, test your rules with realistic costs before you scale size.
They can be combined, but be careful about what the combination adds. Both react to recent price, so overlap is common. Use RSI to describe a different aspect of price behavior, such as momentum divergence at an extreme, rather than as a second copy of the same signal.
Bollinger Bands use standard deviation of price around the middle band, so they widen and contract with volatility. Keltner Channels use average true range around the middle band, which reacts differently to the same price action. Some traders use both together to define squeeze conditions when one sits inside the other.

Prêt à appliquer un risque discipliné aux cryptos ? Explorez les nouveaux instruments crypto d'Audacity Capital et apportez votre stratégie de trading.
En savoir plusNewsletter
Rejoignez notre newsletter pour rester informé.
Rejoignez Notre Communauté Sociale

Commencez Votre Voyage Aujourd'hui Avec Notre Essai Gratuit
Affichez fièrement vos compétences et réalisations grâce à des certificats et obtenez la reconnaissance de votre travail acharné et de votre dévouement auprès d'investisseurs potentiels et de pairs.
Essai GratuitArticles Connexes
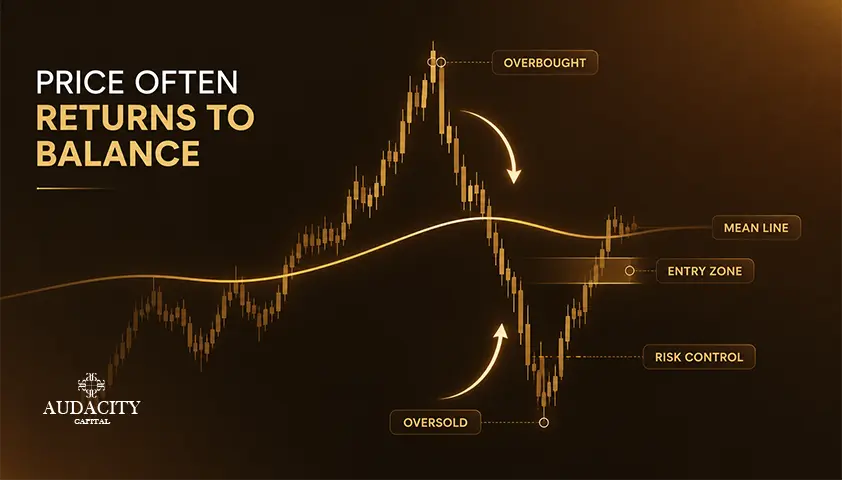
Mean Reversion Trading Strategy Explained (2026)
Prices that stretch too far tend to snap back to an average, but only in the right market. Learn the tools, the setup, and the trend risk.

Inside Bar Trading Strategy: Rules, Entries and Risk Guide
Master the inside bar trading strategy with practical rules for pattern identification, entry triggers, stop placement, risk management, and testing.
Momentum Trading Strategy: A Comprehensive Guide
Master the core principles of a momentum trading strategy. Learn how to use key indicators, manage sharp-reversal risks, and master exit timing.

Martingale Strategy in Trading
How the martingale trading strategy works, what the doubling arithmetic actually costs, why position sizing cannot create an edge, and where it is banned.