


Cup and Handle Pattern: Criteria, Entry and Real Data


Read three different guides on this pattern and you'll find three different stories. One page says it works 65 % of the time, another claims 70, and another says 95.
On cup depth, one source calls a shallow dip ideal while the next says the cup can retrace two-thirds of the prior advance. You cannot follow them all, and if you follow the wrong one, you are rejecting setups that another trader would take.
This article provides you with the criteria for identification, the mechanics of the trade and actual research. Every chart is marked with the correct measure it shows and not with the marketing jargon.
This is educational material and not investment advice, and trading involves significant risk of loss.
What the Cup and Handle Pattern Is
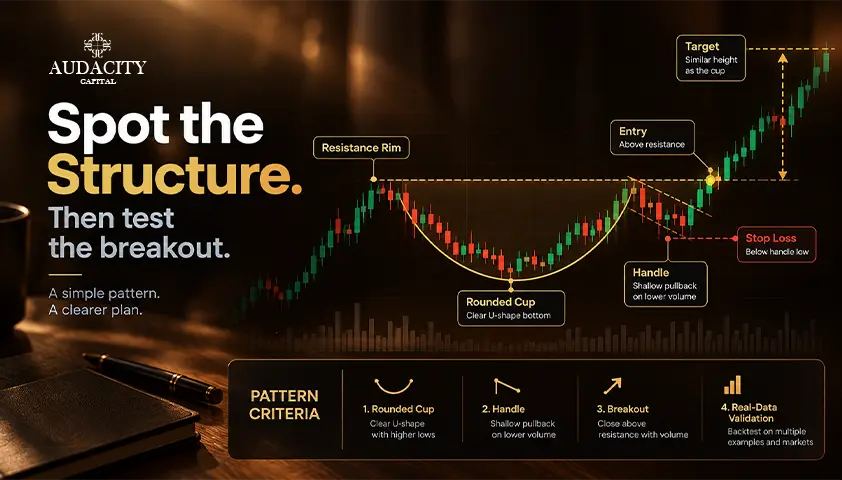
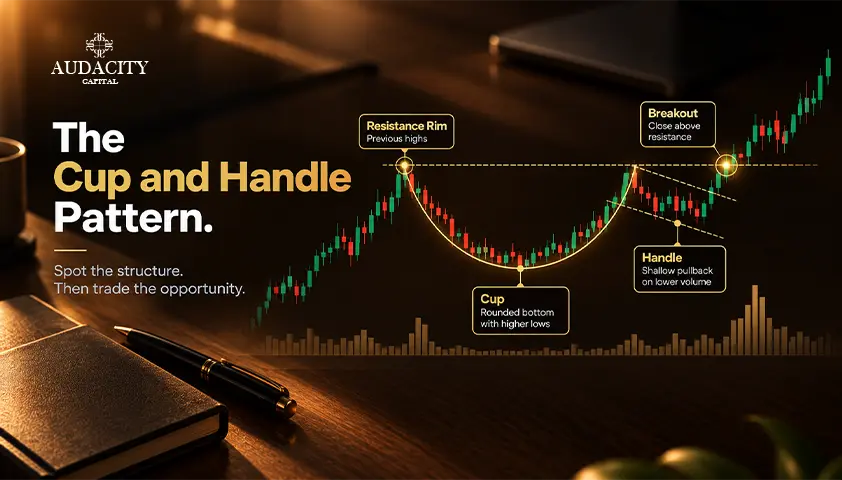
A bullish continuation chart pattern in which an ongoing uptrend slows down. Price declines and recovers in a rounded base that resembles a cup. Thereafter it consolidates within a retracement that creates the handle before breaking above the cup's rim.
This pattern was defined by William O’Neil in How to Make Money in Stocks, first published in 1988. His criteria were devised for stocks on daily and weekly charts, as part of a larger stock selection strategy.
That origin matters. The depth rules and performance research are based on daily and weekly equity charts and not all instruments and timeframes.
The psychology can be encapsulated in one sentence. The cup is sellers slowly giving up and buyers coming back in, and the handle is the last shakeout near the old high before the uptrend resumes. .
The Criteria, and Where the Sources Disagree
This is where different sets of guidelines can change your trading decisions. The form that passes as a textbook in one ranking fails to qualify on another.
The difference here is legitimate enough to deserve attention, rather than glossing over it. The biggest source of argument lies in cup depth. O'Neil's original standard is a relatively shallow cup, as part of his broader base criteria.
A number of ranking pages today use much deeper cups, specifying one-third to two-thirds of the previous advance, or a 38.2% to 61.8% retracement.
Under O'Neil's criteria, such a cup should be disqualified. Rather than average the figures out to one range, it makes sense to keep them separated by their respective sources.
There's also the "U vs V" debate. The general agreement, and O'Neil's own instructions, is that this pattern refers to a rounded U base. A sharp V is another event.
At least one widely read page says that the cup might be U-shaped or V-shaped. It then dedicates an entire section to the reasons for the differences between the two. To a trader wanting to trade that contradiction is worth solving: treat the U base as a pattern and the V as something else.
The rest of the criteria are less controversial. You need a prior uptrend, since this is a continuation setup. Duration of the cup varies from several weeks to several months.
The handle should be located in the top part of the cup, be shallower than the cup and form more quickly. The volume should decrease from the base and increase on the breakout.
Criterion | O'Neil's original standard | What commonly appears online |
Cup depth | Shallow, per his base criteria | One-third to two-thirds of previous advance |
Cup shape | Rounded U base | U, with some sources allowing V |
Cup duration | Weeks to months on daily and weekly charts | Weeks to months, sometimes more than a year |
Handle depth | Shallow, in the upper portion of the cup | Above the 50 percent level of the cup |
Handle duration | Short relative to the cup | One to four weeks |
Entry, Stop and Target
Two entries, two stop conventions, one target method. Each alternative comes at a cost, so accompany each choice with its trade off.
Entry
The traditional rule for a cup and handle breakout is to see a break above the handle's top level, preferably with increasing volume. The aggressive version puts a stop order just above that level and it fills on the break. This allows exposure to a false breakout.
The conservative version waits for a confirmed close above the level before entering, or waits until it has pulled back as described in the next section. Speed against confirmation, and you pay one to get the other.
Stop
Two conventions are used in the guidance.
The tighter placement is below the handle's low and that's the norm for a breakout entry. The wider placement is below the cup's low, typically only used to enter early in the base, not on the breakout.
In a breakout entry trade, placing the stop below the cup low will usually place the stop too far away that the measured move will rarely justify such a large stop.
Target
Measure the depth of the cup formation from the top to the bottom, and then extend that distance upward from the breakout point.
There is a significant caveat. In the source research, approximately 61% of these patterns make the full measured-move target. Make it a realistic goal, not an expectation.
This is educational information so there is no recommended risk level, required risk-reward ratio or fixed stop distance here. If a source does give one, use that convention instead.
What the Data Actually Shows
This is the part that validates the article, and it's where most trading content goes silent. Pay attention carefully because the figures you have read about are definitely measuring something other than what you thought they were.
Thomas Bulkowski's published research on this pattern comes from a sample of perfect bull-market trades. It includes a break-even failure rate, an average increase, the percentage of targets hit, and throwbacks.
In addition, the pattern itself has earned quite a high rank in Thomas’s list of bullish chart patterns (3 out of 39).
Such rank deserves respect, and there is no intention of diminishing the value of the pattern. The trouble is not with the pattern. The trouble is with numbers people attach to it.
The 95 % misread.
The often-cited figure of 95% "success" rate is actually the break-even failure rate turned around. If the break-even failure rate is 5%, then 95% of patterns moved at least 5 % past the breakout. This is not a "win rate".
A 5% move past the breakout is not a definition of a profitable trade. Nor does it indicate anything about whether or not the position survived the journey to get there.
The attributed figure.
At least one ranking website publishes a "success" rate in the range of 65% to 70%, attributing it to the research done by Bulkowski. There is no such figure cited in his works about this particular pattern.
Think of this as a more general warning. Even if a number comes with a respected name attached, it still must be in the original publication first.
The update that complicates the headline.
Bulkowski's more recent study found that a substantial share of examples retrace significantly after an upward breakout. A meaningful minority rise only modestly before dropping.
That does not erase the headline numbers. It sits alongside them, and it makes the honest picture more demanding than the marketing version.
The figure as usually quoted | What it actually measures |
A 95 percent success rate | The share of patterns moving 5 percent past the breakout |
A 65 to 70 percent success rate | Not a figure published in the research it is credited to |
A 54 percent average gain | The mean rise to the ultimate high, not a typical trade |
Ranked 3 of 39 bullish patterns | A genuine strength, ranked on average rise |
*Verify every Bulkowski figure directly at thepatternsite.com, with the sample size and market condition stated beside each, before relying on any of them.
Most Winners Come Back First
Here is the most actionable point in this guide, and one almost nobody on the topic draws out. It falls straight out of the throwback rate above.
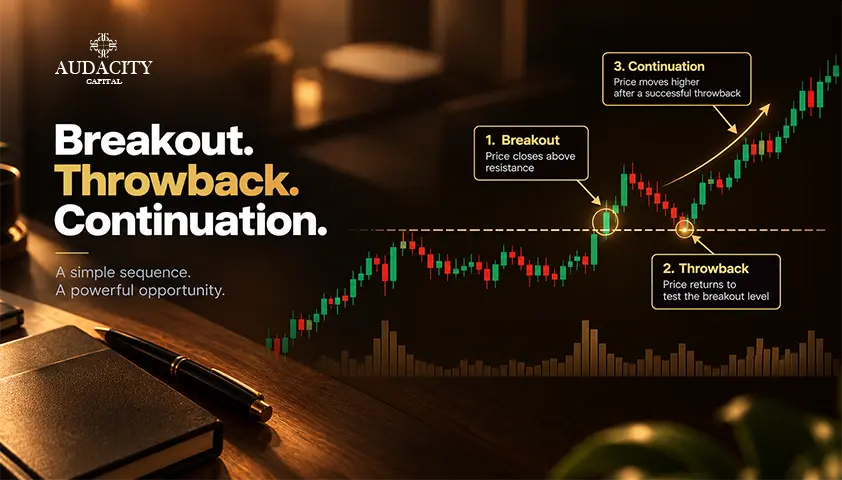
In the source research, around 62 % of these patterns throw back. Price breaks out, returns to the breakout level, and then continues. That is the majority case, not the exception.
The consequence for stops is direct. A stop placed just beneath the breakout level will be taken out by the single most common behavior of a successful pattern.
This is part of why the standard convention stops below the handle low. It sits far enough back to survive an ordinary throwback and stay in the trade that works.
The same statistic reframes the pullback entry. If the retest is more likely than not, waiting for it is a supported approach rather than a timid one.
The cost is real, though: a substantial minority never come back, and a trader who only takes pullback entries will miss those moves entirely. The data explains the stop problem and supports the pullback entry with the same number.
It does not make one entry superior to the other.
Where the Pattern Fails
Built from the criteria, not from a generic warning list. Four failure modes worth watching.
1. A cup too deep.
When the base retraces most of the prior advance, buyers spend nearly all their strength simply climbing back to the old high. Little is left for the breakout, and the move stalls at the rim.
2. A handle too deep.
It is the same problem on a smaller scale and can be an even clearer warning signal than a deep cup. A handle that goes well into the cup means that sellers are still in charge around the highs.
3. A breakout on weak volume.
The pattern is based on the presence of buyers who come in large numbers to the rim of the formation.
A price that breaks out through the resistance level but does not show increased breakout volume is more likely to have a false breakout rather than confirm a continuation.
4. A pattern read too early.
The most typical mistake in recognizing the pattern is its recognition prior to the formation of a handle. A cup that does not have a completed handle is actually a rounding bottom pattern.
There is one thing that beats them all in terms of markets. A bullish continuation pattern that breaks out during a market correction is more vulnerable to failure than those forming in a supportive market environment.
The Inverted Cup and Handle
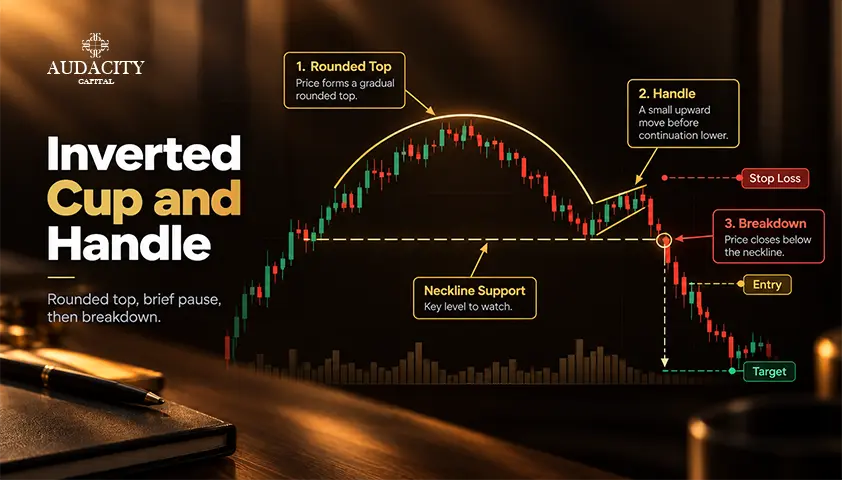
The inverted cup and handle is the bearish counterpart.
An inverted cup is formed by a round top; the handle by an upward consolidation that is smaller in size, and the whole chart pattern is confirmed on a break below the support level of the handle.
It is used for shorting entries with the expected price move downwards measured from the breakdown point.
There is one factor that must be considered. Bulkowski gives separate statistics for the inverted version, and they are weaker to those of the bullish formation.
Do not assume the bullish numbers apply in reverse, which is the mistake most pages make by presenting the two as symmetrical. If you trade the inverted form, verify its own figures at source rather than borrowing the upside stats.
Conclusion
The cup and handle chart pattern performs well in the research that actually studies it. Almost every number quoted about it in trading content describes something other than what the reader assumes.
A 5% break-even failure rate is not a win rate. Most winners also revisit the breakout level before they continue higher. Understanding those two points can matter more to trade management than tweaking the shape itself.
One concrete step before your next setup.
Write down three numbers: the cup depth as a percentage of the prior advance, the handle depth as a percentage of the cup, and the distance from your entry to your stop against the distance to the measured move.
If that third pair does not work, the first two do not matter.
You can observe how a breakout behaves on the retest before committing capital. Audacity Capital's simulated evaluation accounts on MT5 and DXTrade provide a place to practice reading that behavior.
The accounts are simulated, and no pattern improves the odds of passing an evaluation.
Frequently Asked Questions
The shape can appear on any timeframe, but the criteria and the research behind them were built on daily and weekly stock charts. An intraday version is a visual resemblance rather than the studied pattern. The published statistics do not transfer to it and should not be applied there.
A slight downward drift is the classic description, because it represents a final shakeout near the highs. A flat or slightly upward handle is common and not disqualifying on its own. Depth matters considerably more than slope, so judge the handle by how far it cuts into the cup.
The 200-day moving average is used as a trend filter, not as part of the pattern itself. A bullish continuation setup forming above it is consistent with an intact long-term uptrend. Treat this as common practice among traders rather than one of O'Neil's original criteria.
The shape appears in both markets. The depth percentages can behave differently because volatility varies across instruments.
A retracement that looks shallow in one market may look deep in another. The performance research is drawn from stocks, so do not assume it holds elsewhere.
A formation without a completed handle is generally described as a rounding bottom. It can be traded on its own terms, but it is a separate pattern with its own statistics, not an incomplete version of this one. Read it as what it is rather than forcing the label.

Prêt à appliquer un risque discipliné aux cryptos ? Explorez les nouveaux instruments crypto d'Audacity Capital et apportez votre stratégie de trading.
En savoir plusNewsletter
Rejoignez notre newsletter pour rester informé.
Rejoignez Notre Communauté Sociale

Commencez Votre Voyage Aujourd'hui Avec Notre Essai Gratuit
Affichez fièrement vos compétences et réalisations grâce à des certificats et obtenez la reconnaissance de votre travail acharné et de votre dévouement auprès d'investisseurs potentiels et de pairs.
Essai GratuitArticles Connexes
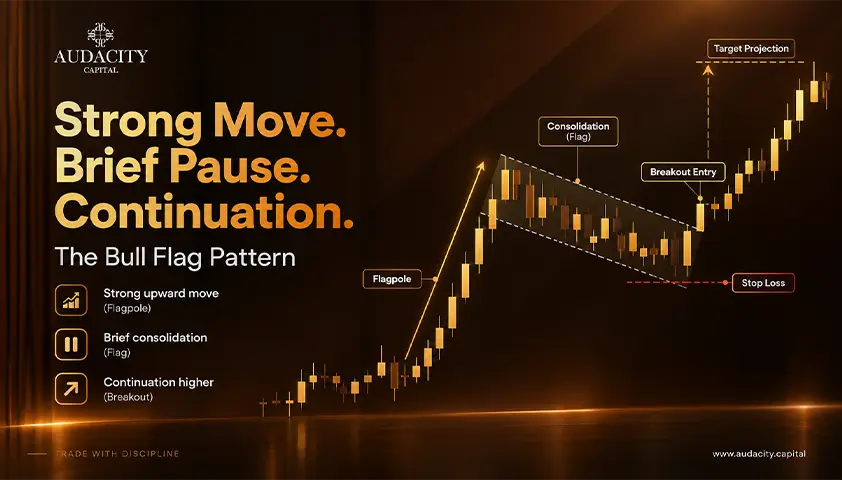
Bull Flag Pattern: A Comprehensive Guide
How the bull flag pattern works, how to set the entry, stop and target, and what the research actually says about its reliability.

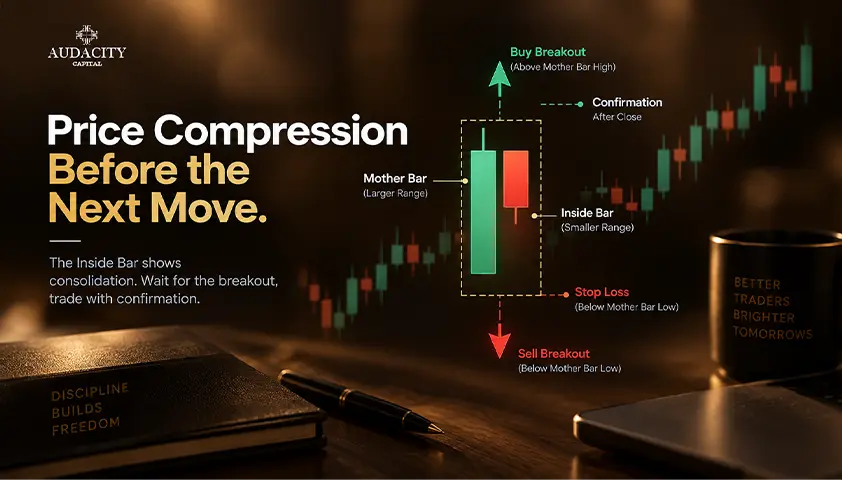
Inside Bar Pattern: Meaning, Examples and Trading Rules
Learn how to identify the inside bar pattern, compare entry and stop rules, and assess false breakouts before testing a trading strategy.

Best Trading Simulator Apps in 2026: Practice Trading Risk-Free
Compare the best trading simulator apps in 2026 for stocks, forex, futures and crypto. See features, markets, realism, pricing and beginner-friendly options.

Trade Deficit Explained: Causes, Effects and Markets
What a trade deficit is, what actually causes it, why it can widen in a strong economy, and why the textbook currency rule often fails.