


RSI Indicator: A Complete Guide



The RSI indicator measures the magnitude of recent price changes on a scale from 0 to 100. Most traders learn RSI as a simple rule: readings above 70 mean sell, while readings below 30 mean buy. That shortcut can be costly.
Readings over 70 or below 30 indicate that momentum has been strong in one direction compared to the lookback period. They don't tell you that the market has to turn around.
This guide takes you through the calculation, the basic thresholds, when RSI acts in ranges versus trends, divergence, failure swing, settings, and three practical setups.
What Is the RSI Indicator?
The relative strength index (RSI) is a momentum indicator developed by J. Welles Wilder in the late 1970s. RSI compares average recent gains with average recent losses over a selected lookback period. It then scales the result from 0 to 100.
RSI is not "relative strength" against another stock or index. It has nothing to do with comparing Apple to the Nasdaq. It is also not a valuation, volume or fundamentals measure.
Best RSI Settings for the 1-Minute Nasdaq 100 Chart
It's a true momentum-based indicator derived from price.
The 50 level is the best starting reference point. Readings over 50 typically suggest that the markets are gaining more upward momentum. Readings lower than 50 typically represent more downward momentum.
Before worrying about levels 70 and 30, pay attention to where the oscillator resides in relation to 50.
How Is RSI Calculated?
The RSI formula is:
RSI = 100 - [100 / (1 + RS)]
Whereby RS is the ratio of average gain to average loss over the selected lookback period.
Wilder's default was a 14-period RSI, which became the standard baseline in most charting programs. The term “period” refers to bars and not some specific time unit. A 14-period RSI chart on a daily time frame uses 14 daily bars. On a 1-hour chart, it will use 14 hourly bars.
Wilder uses a smoothing process after calculating the first average. The method is similar to an exponential moving average. It differs from simply averaging the last 14 gains and losses.
You do not have to calculate the RSI yourself; just knowing the elements needed for its computation is enough.
How to Read RSI: 70, 50 and 30
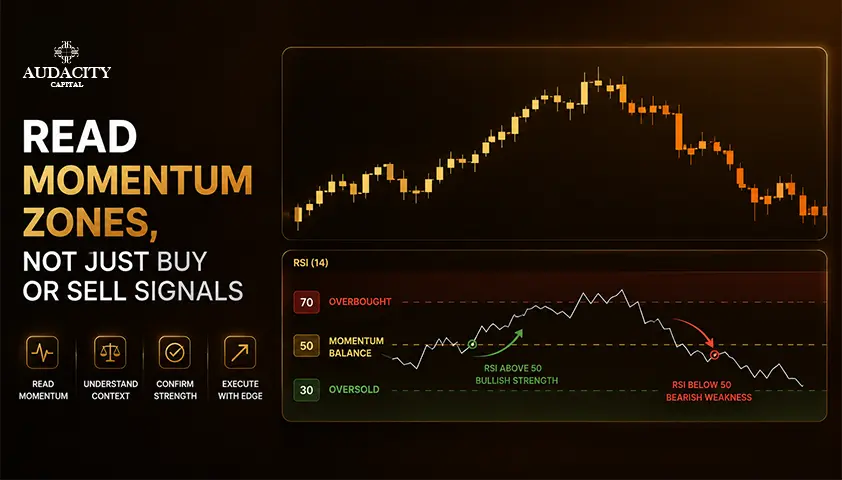
The classical model of the indicator, RSI 70 30, states that any reading above 70 is overbought while below 30 is oversold. Values in the range between 30 and 70 are considered neutral.
The language used is a little bit misleading. Overbought does not mean that the asset is too expensive or that it is about to fall. It is just a description of what has occurred: there has been strong upside momentum relative to recent history.
Most beginners don't realize that the 50 centerline is more informative. A move from below 50 to above 50 can indicate a change in momentum. But a single cross during choppy, range-bound price action has low information value. Focus on sustained behavior around 50 rather than a single flip.
Some traders employ even higher levels, such as 80/20, in case of a strong or volatile market. There is nothing inherently wrong with this approach. It is simply a different filter for a different market environment.
Why Overbought Does Not Always Mean Sell
This is where almost all RSI trading strategies fail. During a strong uptrend, RSI can maintain levels above 70 for quite a few bars while price rises. During a strong downtrend, it can remain below 30 levels while price falls.
Trying to fade these conditions automatically will be one of the quickest ways to fail in a trend.
This is where the idea of an RSI trend range comes in handy. During an intense uptrend, the RSI indicator normally resides between 40 and 90 levels. The 40 to 50 range will form support when there is a correction phase.
During an intense downtrend, the RSI normally remains between 10 and 60 levels. The 50 to 60 range will form resistance when there is an up move.
They are observed facts rather than rules set in stone.
Think of two charts. In a sideways range, RSI might hit 70 at resistance and 30 at support. Mean reversion will work well in this situation.
However, in a strong trend, the same value of 70 can recur over and over during an uptrend. A short for each of the readings would be early.
Context first. Signal second.
Bullish and Bearish RSI Divergence
RSI Divergence is one of the most popular indicators used in technical analysis. There are two types of RSI divergence.
Bullish RSI Divergence: price makes a lower low while RSI makes a higher low. Bearish RSI Divergence: price makes a higher high while RSI makes a lower high.
Many guides give divergence more predictive power than it actually has. Divergence means momentum failed to confirm the new price extreme. This suggests weaker momentum but does not signal a reversal.
Strong trends sometimes show two to three divergences before they reverse. Some divergences can be resolved by the price action making a sideways move rather than a reversal.
Steps that make divergence actionable:
- Identify divergence on an important spot, such as prior support, resistance, or a failed breakout.
- Confirm price action by piercing through the local swing highs/lows, or breaking/reclaiming a structural level.
- Define risk based on price action, not the RSI level.
Divergence is a filter that raises your interest. It's the price that triggers the trade.
RSI Failure Swings and Trend Signals
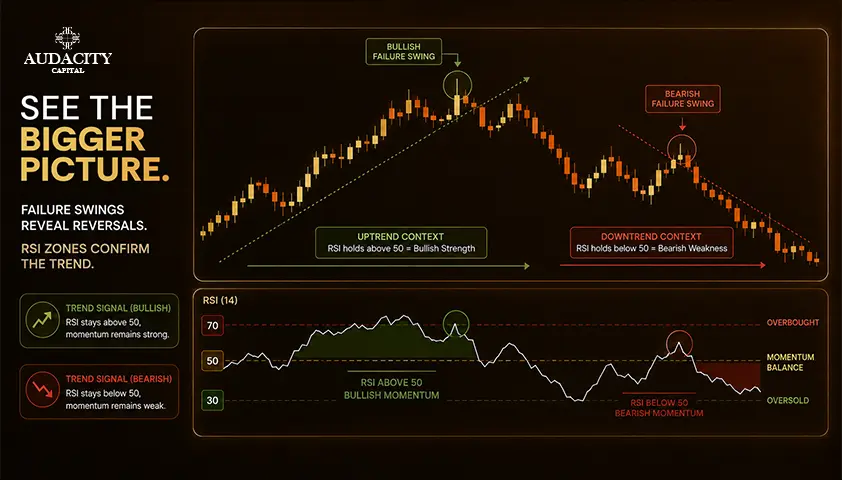
Failure swings are taken from the RSI line alone, not from price and RSI.
A bullish failure swing starts with RSI moving down below 30 levels and then reversing. RSI retraces but does not fall below 30 levels. The reversal signal forms when RSI breaches the previous RSI swing high.
A bearish failure swing works oppositely. It begins with RSI rising above 70 levels and then retracing without forming a new high. The reversal signal takes place when RSI breaks the previous RSI swing low.
Positive and negative reversals are another advanced RSI concept associated with Cardwell's work. A positive reversal occurs when RSI makes a lower low while price makes a higher low during an uptrend. A negative reversal is the opposite during a downtrend.
3 Practical RSI Trading Setups
This is how you can trade RSI in a repeatable framework. This setup involves the exact same four-line block.
1. Range mean reversion
- Market context: Oscillations of price within defined support and resistance, lack of clear trends.
- RSI condition: RSI near 30 at support or near 70 at resistance.
- Price action: A reversal candle or breakout of a small counter-swing in the price range.
- Invalidation: A break of the range against the trade.
2. Trend pullbacks
- Market context: An uptrend where there are higher highs and higher lows, or vice versa for a downtrend.
- RSI condition: Resetting of RSI levels from higher values to 40-50 levels while price holds higher-low structure in the case of an uptrend. Reverse in case of downtrend.
- Price action: Price turns back in the trend direction and breaks the pullback's counter-swing.
- Invalidation: Price loses the last higher low in an uptrend, or the last lower high in a downtrend.
3. Divergence at structure
- Market context: Price hits an important swing level, previous support/resistance, or failure to breakout zone.
- RSI condition: Bullish RSI divergence at support or bearish RSI divergence at resistance.
- Price action: Price breaks the local swing in the direction of the divergence.
- Invalidation: Price makes a new extreme higher/lower than the divergence high/low.
None of these guarantee success. It is a systematic way of combining momentum context with price confirmation and risk.
What Are the Best RSI Settings?
There is no single "best" answer when it comes to RSI settings. The 14-period RSI is simply the standard baseline from Wilder and not a proven optimum for every market.
The trade-off is simple. Shorter lookbacks of 7 or 9 are responsive but noisy. Longer lookbacks of 21 and 25, on the other hand, remove noise but add lag.
Lookback periods must be tested with respect to the actual asset and timeframe being traded and the particular strategy employed. Change one variable at a time because when two variables are changed simultaneously, it will be impossible to determine what has influenced the outcome.
RSI vs MACD and Stochastic Oscillator
Tool | What it measures | Best question it helps answer |
RSI | Magnitude of recent gains vs losses, bounded 0 to 100 | Is momentum stretched or resetting? |
Relationship between two moving averages, unbounded | Is trend momentum accelerating or fading? | |
Stochastic | Where the close sits within the recent high-low range | Where is price closing relative to its recent extremes? |
Stacking oscillators doesn’t give you automatic confirmation. RSI and Stochastic have similar responses to short-term momentum and thus tend to give similar signals. This is not confirmation, but rather redundancy.
When you pair up tools that measure different things, it usually gives you more information. For instance, you might combine a momentum oscillator with a volume or structure tool. That can be more useful than using two oscillators that often produce the same signal.
Common RSI Trading Mistakes
- Shorting every reading above 70. Correction: identify whether the market is trending or ranging before treating RSI overbought oversold levels as reversal signals.
- Buying every reading below 30. Correction: oversold momentum can persist for many bars in a downtrend.
- Treating divergence as an entry trigger. Correction: wait for price to confirm by breaking structure.
- Optimizing the period until historical signals look perfect. Correction: test out of sample and be honest about overfitting.
- Using the same thresholds in every market regime. Correction: observe how RSI behaves in the current range and volatility before applying fixed levels.
- Placing stops based on an RSI value. Correction: risk is executed in price. Invalidation belongs at a price level, not at "RSI 65."
Conclusion
RSI is a momentum oscillator. Its readings become useful when you interpret them in the context of the market regime and surrounding price structure.
Overbought describes recent momentum. It is not a sell button. Oversold is not a buy button.
Establish the workflow. First, understand the market environment. Next, determine what RSI value should be used in this regime. Find the setup and wait for confirmation in price. Define your risk in price level.
Adding more RSI conditions cannot fix a workflow that misses all those steps. Good traders, who understand how to use this indicator, take it as an additional filter to sharpen the price interpretation.
Frequently Asked Questions
RSI 70 means upside momentum over the lookback period has been strong relative to recent history. It does not mean the price must fall. In a strong uptrend, RSI can stay above 70 for many bars while price continues higher.
Yes. In sustained uptrends, RSI can hold above 70 for extended periods, and in sustained downtrends it can hold below 30. Persistence of an extreme reading is often a sign of trend strength, not exhaustion.
There is no universal best setting for any timeframe. The 14-period RSI is a standard baseline, not a proven optimum. Some day traders use shorter lookbacks for faster signals and more noise, others stay with 14. Test against your specific market and setup.
The 50 line separates positive and negative average momentum. Sustained readings above 50 generally reflect stronger upside momentum. Readings below 50 generally reflect stronger downside momentum. It is a useful trend filter before you look at 70 or 30.
Divergence signals that momentum failed to confirm a new price extreme, nothing more. It can precede reversals, but it can also persist and fail, especially in strong trends. Confirmation from price action and a defined invalidation are essential.
Yes, but not with the 70/30 mean-reversion logic. In trends, RSI is more useful for pullback setups. The oscillator may reset toward 40 to 50 in an uptrend or 50 to 60 in a downtrend. Traders then look for price to resume in the trend direction.
The RSI compares an asset to its own recent price history. Relative strength, as used in market analysis, compares one asset's performance to another asset or benchmark. Same word, different concepts.

क्या आप क्रिप्टो पर अनुशासित जोखिम लागू करने के लिए तैयार हैं? Audacity Capital के नए क्रिप्टो उपकरणों का पता लगाएं और अपनी ट्रेडिंग रणनीति लाएं।
और जानेंन्यूज़लेटर
हमारे न्यूज़लेटर से जुड़ें।
हमारे सामाजिक समुदाय में शामिल हों

आज ही अपनी यात्रा शुरू करें हमारे नि:शुल्क परीक्षण के साथ
प्रमाणपत्रों के माध्यम से अपने कौशल और उपलब्धियों को गर्व से प्रदर्शित करें और संभावित निवेशकों और साथियों से अपनी कड़ी मेहनत और समर्पण के लिए पहचान प्राप्त करें।
नि:शुल्क परीक्षणसंबंधित लेख

Bullish RSI Divergence: How to Spot, Confirm and Trade It
Learn how to identify bullish RSI divergence, confirm reversal signals, choose entries, set stop losses, and manage risk effectively.

Risk of Ruin in Trading: Formula, Examples and How to Reduce It
Learn what risk of ruin in trading means, how the formula works, what affects it, and how position sizing can reduce the chance of account failure.

RSI Divergence: A Complete Guide to Spotting and Trading Momentum Shifts
Learn what RSI divergence is, explore bullish, bearish and hidden divergence, and discover how to identify, confirm and trade RSI divergence.
How to Use Anchored VWAP in Trading
Learn how Anchored VWAP works, choose meaningful anchor points, read price reactions, compare it with VWAP, and avoid common mistakes.