


Smart Money Concepts (SMC) Trading Explained


%20Trading__webp__orig.webp)
Smart money concepts, commonly shortened to SMC, is a discretionary price-action framework that organizes market structure, liquidity, order blocks, and price imbalances into one repeatable decision process.
It is not a single indicator, a fixed entry pattern, or a live feed of institutional orders.
The framework attempts to infer where orders may cluster and where price may react. A candlestick chart, however, does not reveal the identity or intention of the trader behind any given move.
Every SMC label is an interpretation of observable price behavior, nothing more.
The workflow in this guide runs in a strict order: establish higher-timeframe structure, map possible liquidity, wait for displacement and a structural shift, then look for a retracement into a validated area with defined invalidation and pre-calculated risk.
SMC does not predict price or guarantee an edge. Every setup requires testing on the intended instrument, timeframe, session, and cost structure before it deserves live capital.
What Smart Money Concepts Actually Mean?
Smart money concepts trading is best understood as a vocabulary and a decision framework built around observable price action.
It reframes familiar ideas, such as trend, support and resistance, failed breakouts, and price gaps, through the language of liquidity, imbalance, and institutional participation.
Most of the terminology commonly grouped under SMC was popularized through the Inner Circle Trader (ICT) methodology.
SMC is the broader community label, and traders often use ICT and SMC interchangeably even though definitions vary from source to source. That inconsistency matters: before applying any concept, a trader needs to fix a specific definition for their own charts.
The central misconception worth correcting early is this: an order block is not a confirmed record of a bank order, and a liquidity sweep is not automatic proof of a deliberate stop hunt.
These are interpretations of price behavior. Actual order-flow data, where available, shows bids, offers, quantities, spreads, and executions on a specific venue.
A standard candlestick chart shows only summarized open, high, low, and close information. The framework treats price action as a proxy for participant behavior, and that proxy is imperfect.
Market Structure, BOS, CHoCH, and MSS
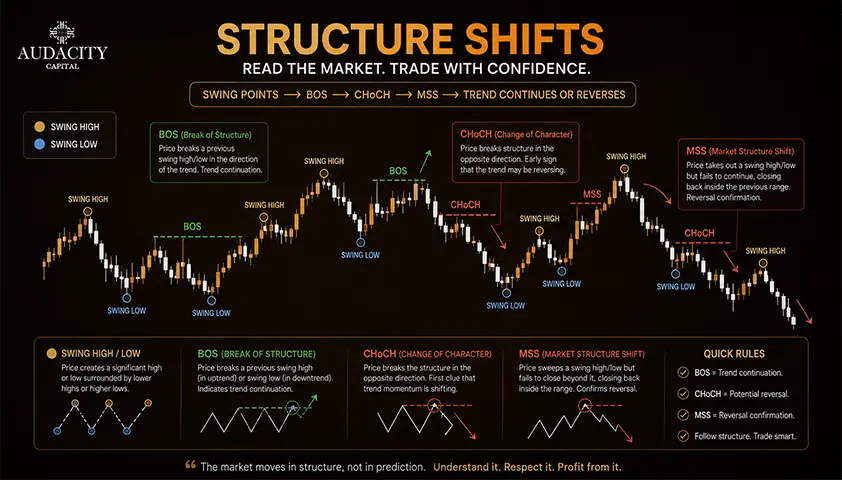
Every SMC label depends on how market structure is defined, so structure comes first.
1. A swing high and swing low are the pivot points that give the chart its skeleton.
An uptrend generally prints higher highs and higher lows. A downtrend prints lower highs and lower lows.
Before marking anything else, a trader must fix a rule for what counts as a valid swing: for example, a candle with a lower high on each side, or a fractal calculated over a specific bar count.
2. Break of structure (BOS) is a break in the direction of the prevailing structure.
If price is making higher highs and higher lows, a new higher high confirmed by a candle close, or by whatever rule the trader has defined in advance, is a BOS. State the confirmation rule before the setup appears: does a wick through the level count, or must the candle close beyond it?
3. Change of character (CHoCH) is the first structural break against the current trend.
In an uptrend, that means the first confirmed lower low. It signals that the previous swing rhythm has failed, not that a reversal is guaranteed.
4. Market structure shift (MSS) is used by some SMC traders as a stronger version of CHoCH.
This often requires displacement or a specific candle close beyond a chosen swing. These labels are not standardized across the industry, so a trader needs their own written definition.
One caution: small lower-timeframe breaks can occur inside a larger trend without changing anything meaningful. The swing-selection rule and timeframe hierarchy must be locked in before the signal appears, using only information available at that moment.
Liquidity Pools and Liquidity Sweeps
Stop orders and breakout orders often cluster around visible highs, lows, equal highs or lows, previous session extremes, and round numbers. SMC traders call the areas above highs buy-side liquidity and the areas below lows sell-side liquidity.
A liquidity pool is simply an area where these resting orders are assumed to accumulate.
A liquidity sweep is when price trades beyond an obvious level and then returns back inside the prior range.
What matters is not the wick itself but the structural response after the break. If price sweeps a high, closes back inside, and then prints a CHoCH on a lower timeframe, that combination is more meaningful than the wick in isolation.
A sweep is not the same as a breakout. A sweep fails to accept beyond the level and rotates back. A breakout accepts beyond the level, builds new structure, and continues. Neither can be classified with certainty before the confirming behavior occurs.
Handle the phrase "stop hunting" carefully.
Stops do cluster at predictable levels and become executable liquidity when price arrives. That is observable.
What is not observable from a chart is whether any specific institution deliberately engineered a particular candle to reach that liquidity.
Behavior | Liquidity Sweep | Breakout with Acceptance |
Price beyond level | Brief, often a single candle | Sustained trading beyond the level |
Candle close | Closes back inside prior range | Closes and holds beyond the level |
Follow-through | Reversal, often with a structural break | Continuation, higher highs or lower lows |
Interpretation | Level treated as executed liquidity | Level treated as accepted price |
Order Blocks, Fair Value Gaps, and Displacement
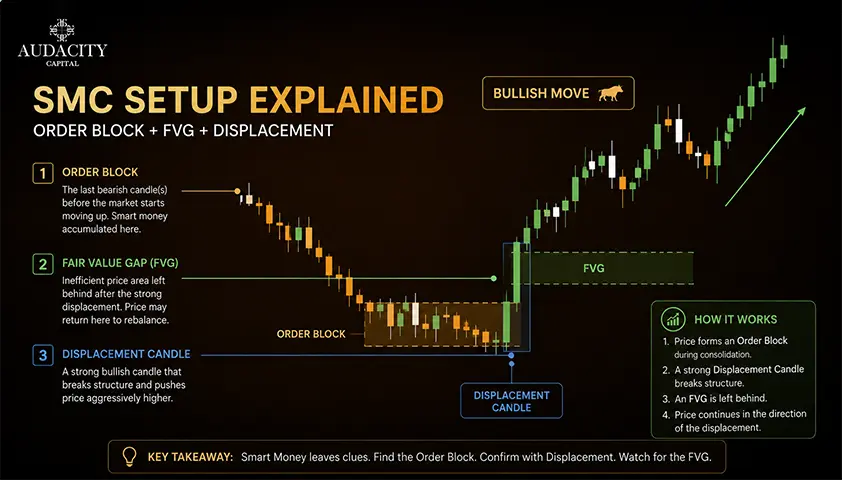
These three ideas belong in one section because they work together, not separately. Marking every candle or gap on a chart is the fastest way to lose the plot.
An order block is commonly defined as the last opposing candle or small consolidation before a strong directional move.
In a bullish sequence, the last down candle before the impulse is often flagged as a bullish order block.
The exact candle boundaries, wick inclusion, and validity rules vary by trader, so pick one definition and apply it consistently.
Displacement is the decisive move that follows: large candles, limited overlap, and a meaningful structural break.
Displacement is what gives an order block its supposed weight. The move away matters more than the color of the alleged origin candle.
A fair value gap (FVG), sometimes called an imbalance, is a three-candle price pattern where the first and third candles do not overlap across part of the middle candle's range.
It marks fast, one-sided movement where price skipped rather than traded through. An FVG does not have to be filled. Some fill quickly, some partially, and some never return.
The useful confluence logic in SMC trading looks like this: a point of interest becomes more relevant when it forms after a liquidity event, causes displacement, breaks structure, and aligns with a higher-timeframe bias.
A random untouched order block or FVG floating in the middle of nowhere is not a setup.
Premium and discount is a location filter applied around the midpoint of a chosen dealing range. In a bullish bias, longs are typically sought in the discount half, below the 50% line.
Treat this as a location filter, not a valuation model. It refines where a setup is considered, but the 50% level itself has no intrinsic meaning.
Also worth a mention: inducement describes a minor liquidity pool that price often takes before reaching a deeper point of interest. It is used to explain why price sometimes runs a small nearby high or low before turning from the level a trader actually cares about.
How to Build an SMC Trading Setup Step by Step
Here is one repeatable smart money concept strategy, presented as a sequence of filters. Each step reduces the number of valid setups. None of them guarantees anything.
Step 1: Set the higher-timeframe bias
Choose a timeframe hierarchy in advance, for example daily for bias, 4-hour for structure, 15-minute for entry. Mark the active swing structure and the level whose break would invalidate the bias. If price is making higher highs and higher lows on the daily, the bias is bullish until a confirmed lower low invalidates it.
Step 2: Mark a possible draw on liquidity
Identify the visible high, low, equal level, or session extreme that price could realistically test. Treat it as a hypothesis, not a forecast. A draw on liquidity is where the setup is watched, not where it is entered.
Step 3: Wait for the liquidity event and displacement
Do not enter simply because price touches a level or reaches a zone. Wait for the sweep or the reaction, followed by displacement in the intended direction.
Step 4: Confirm the structural response
Define the trigger in advance: BOS, CHoCH, MSS, or another objective candle close beyond a chosen swing. The same rule must apply to every setup, not a looser version when the chart looks promising.
Step 5: Select the entry area
Look for a retracement into a validated order block, a fair value gap, or an overlap between them. A limit order gets a better price but assumes the zone holds.
Waiting for a lower-timeframe confirmation gets a worse price but filters weaker setups. Both are valid; pick one and test it.
This is the entry model step, and it should be documented, not improvised.
Step 6: Set invalidation and target
The stop loss belongs beyond the structure that disproves the setup, not at a comfortable distance. If the low of the order block breaks, the setup is wrong.
The target might be the opposing liquidity pool, a prior structural high or low, or a fixed multiple of the risk distance. Whichever it is, the rule is defined before entry.
Step 7: Calculate size before entry
Position sizing converts stop distance into cash risk. Use the instrument's point value, contract size, spread, commission, and a realistic slippage estimate.
Prop-firm traders working within a drawdown budget need to be especially strict here: one oversized position taken during a fast news move can end an account regardless of how clean the SMC read was.
Does SMC Trading Work? Evidence and Limitations
The direct answer: SMC trading can help a trader organize price-action observations into a consistent process, but the framework itself is not a proven or universally validated edge.
Whether a specific rule set is profitable depends entirely on the definitions used, the market, the timeframe, execution quality, transaction costs, and risk rules.
Some pieces of the story are supported by observable market behavior. Order flow does move prices. Liquidity does vary by session. Stops do cluster at obvious levels. Fast moves do leave thinly traded areas behind.
None of that proves that any specific chart pattern was planned by institutions, and none of it validates a named SMC setup on its own.
Subjectivity is the biggest practical problem. Two traders looking at the same chart can select different swings, different order blocks, different fair value gaps, and different structural shifts.
Until those choices are converted into exact rules, the method cannot be tested.
Hindsight bias is the second problem. Historical charts make the "correct" order block and the "correct" sweep look obvious after the move completed.
A real test must record every valid setup visible in real time, including every failure that looked identical at the moment of entry.
Backtesting an SMC method requires locking down: the swing algorithm, the timeframe hierarchy, the session, the confirmation close rule, the entry method, the stop rule, the target rule, the zone expiry (how long a fair value gap or order block remains valid), transaction costs, and maximum simultaneous exposure.
Once the rules are fixed, use out-of-sample data or forward testing before drawing conclusions. Backtests do not guarantee future results, and a curve-fitted rule set will look excellent in-sample and disappoint everywhere else.
Common Smart Money Concepts Mistakes
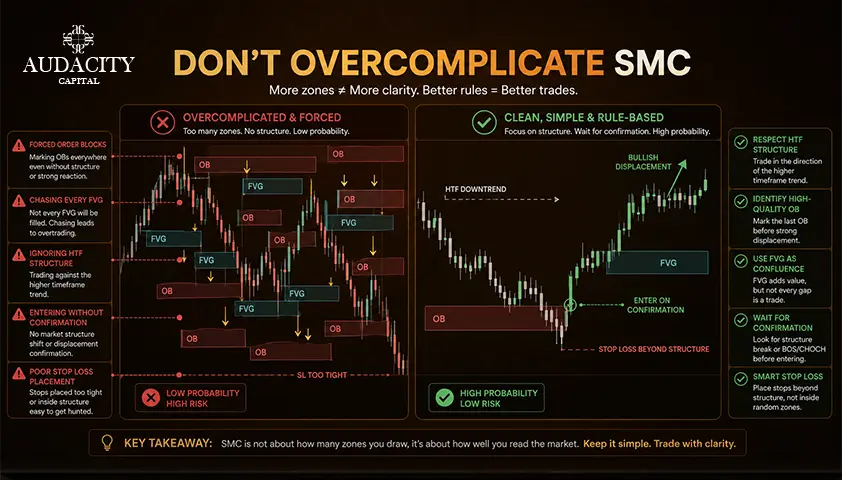
Mistake 1: Marking everything.
Every opposite candle becomes an order block, every three-candle move becomes a tradable FVG. The chart turns into a heat map and every move looks like a setup.
Mistake 2: Skipping the higher-timeframe context.
Jumping directly to a 1-minute entry without knowing the daily or 4-hour bias, structure, or invalidation.
Mistake 3: Calling every wick a sweep.
A wick through a high is not automatically a liquidity sweep. Without acceptance and continuation classified afterwards, the label is premature.
Mistake 4: Redefining after the fact.
Changing the swing rule, the BOS rule, or the valid order-block definition once the outcome is known. This is the fastest way to build a strategy that only works in hindsight.
Mistake 5: Stacking correlated confirmations.
Using order block, FVG, displacement, and CHoCH as if they were four independent signals when they all describe the same price move. That is one signal counted four times.
Mistake 6: Obsessing over entry, ignoring risk.
A perfect entry with the wrong position size, doubled-up correlated exposure, or entry seconds before a scheduled news release will still blow up an account. Spread and slippage during volatile sessions can widen the effective stop distance meaningfully.
Conclusion
SMC organizes price action into a workable sequence: structure provides context, liquidity defines a hypothesis, displacement and a structural break provide confirmation, and an order block or fair value gap may define the entry area.
That sequence, applied consistently, is where the practical value of the framework lives.The central limitation stays with the framework at every step. SMC labels describe price behavior, but they do not reveal who placed each order and they do not guarantee that a zone will hold.
Use fixed definitions, log every valid setup including losers, include realistic costs, test outside the development sample, and size each position from the invalidation point rather than from confidence in the story.
Frequently Asked Questions
Not exactly, but they overlap heavily. ICT refers to the specific methodology and terminology developed by the Inner Circle Trader, while smart money concepts is the broader community label that includes ICT ideas alongside variations from other educators. Traders often use the terms interchangeably, so definitions vary depending on the source.
There is no single best timeframe. The framework has been applied from monthly charts down to the 1-minute, and the appropriate choice depends on the market, session, transaction costs, and how much time the trader can dedicate to screen watching. Lower timeframes generate more setups but suffer more from spread and slippage; higher timeframes are cleaner but slower.
They are similar but not identical. Both concepts identify areas where a strong move originated, so the practical zones often overlap on a chart. SMC order blocks typically require additional context, such as displacement and a subsequent structural break, whereas classical supply and demand zones focus mainly on the base of the move.
No. A fair value gap represents a three-candle imbalance, and while many do get revisited, plenty are never filled or are only partially closed. Treating an unfilled FVG as a magnet that price must return to is a common error; the gap is a point of interest, not a prediction.
Yes, but only after the subjective labels are converted into exact rules. Swing selection, valid order blocks, FVG boundaries, structural breaks, and zone expiry all need programmatic definitions. Once codified, the rules can be tested, though results depend heavily on the specific definitions chosen and will not match a discretionary trader's reading of the same charts.
The vocabulary can be applied to any liquid market, but whether a specific SMC rule set is profitable varies by instrument. Liquidity depth, session behavior, spread, commission, and volatility differ significantly across forex, index futures, individual stocks, and crypto, so a smart money trading strategy validated on EURUSD will not automatically transfer to Bitcoin or a small-cap stock without retesting.

क्या आप क्रिप्टो पर अनुशासित जोखिम लागू करने के लिए तैयार हैं? Audacity Capital के नए क्रिप्टो उपकरणों का पता लगाएं और अपनी ट्रेडिंग रणनीति लाएं।
और जानेंन्यूज़लेटर
हमारे न्यूज़लेटर से जुड़ें।
हमारे सामाजिक समुदाय में शामिल हों

आज ही अपनी यात्रा शुरू करें हमारे नि:शुल्क परीक्षण के साथ
प्रमाणपत्रों के माध्यम से अपने कौशल और उपलब्धियों को गर्व से प्रदर्शित करें और संभावित निवेशकों और साथियों से अपनी कड़ी मेहनत और समर्पण के लिए पहचान प्राप्त करें।
नि:शुल्क परीक्षणसंबंधित लेख
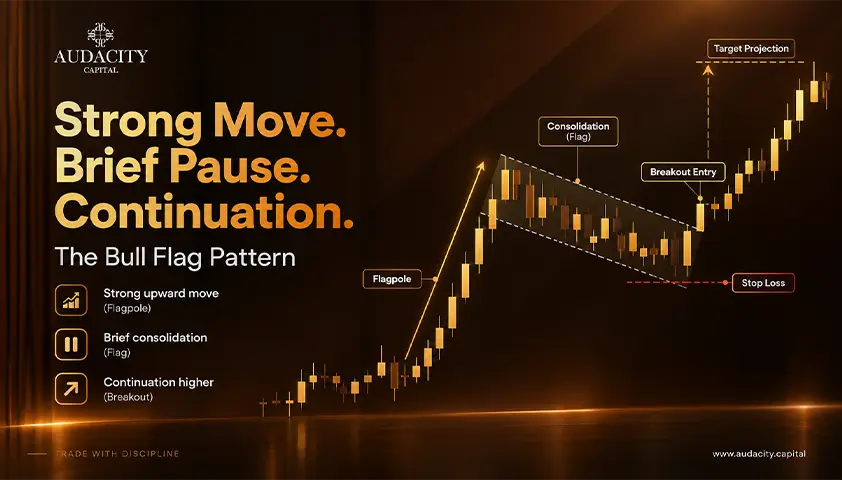
Bull Flag Pattern: A Comprehensive Guide
How the bull flag pattern works, how to set the entry, stop and target, and what the research actually says about its reliability.


Prop Firms That Allow Weekend Holding in 2026 (Compare Firms)
Compare prop firms that allow weekend holding. Explore weekend and overnight rules, news trading, drawdown, markets, profit splits and key restrictions.
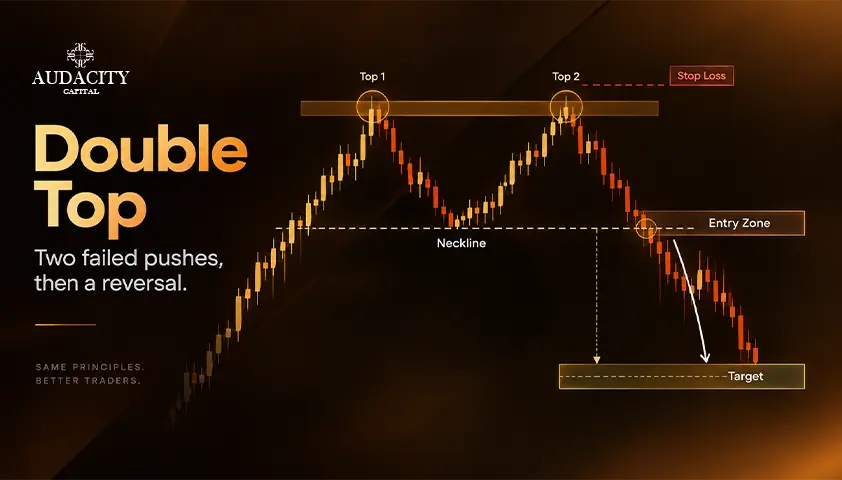
Double Top Pattern: How to Trade It
Learn how to identify, confirm, and trade a valid double top pattern with precise targets and stops.

Prop Firms With No Minimum Trading Days
Prop firms with no minimum trading days compared, with evaluation rules, payout conditions and who each one suits.