



ICT Trading Strategy: A Complete Beginner's Guide to Trading Like the Smart Money



The ICT trading strategy is a price action methodology developed by Michael J. Huddleston, better known as the Inner Circle Trader (ICT). Instead of relying primarily on indicators or breakout signals, it focuses on understanding how institutional traders interact with market liquidity to identify high-probability trading opportunities.
While ICT terminology can seem complex at first, the underlying concepts are straightforward once you understand how price moves. This guide explains the strategy step by step, covering its core principles, the most important ICT concepts, and how beginners can start applying them in a structured way.
In this guide, you'll learn:
- What the ICT trading strategy is
- How institutional trading influences price movement
- The core ICT concepts every beginner should know
- How to identify high-probability trade setups
- Common mistakes to avoid
- A practical framework for learning ICT
Whether you're trading forex, indices, futures, or cryptocurrencies, this guide will help you understand the ICT trading strategy without unnecessary jargon or unrealistic promises.
What Is ICT Trading?
ICT stands for Inner Circle Trader, which is the online name of a trader and educator called Michael J. Huddleston. Over more than two decades of studying the futures and forex markets, he built a full trading methodology around one central belief: retail traders lose money because they do not understand how banks, hedge funds, and algorithmic trading firms actually move price.
Most beginners are taught a version of trading that the market simply does not run on. Draw a trendline, buy the breakout, follow a moving average crossover, react to an indicator turning green. ICT argues that this style makes you predictable, and predictable retail traders are exactly the fuel that large institutions feed on. If everyone puts their stop loss in the same obvious spot, that spot becomes a target.
ICT flips the whole thing around. Instead of asking "what pattern do I see," it asks "where is the money resting, and what would a large institution need to do to get filled?" Once you start looking at charts through that lens, a lot of confusing price action suddenly has a reason behind it.
One thing worth clearing up early, because it trips people up: the "ICT" here has nothing to do with information technology or computing. In the trading world it only ever means Inner Circle Trader.
Why Traders Use the ICT Trading Strategy
The ICT trading strategy has become one of the most widely followed price action methodologies because it focuses on understanding why markets move, rather than simply reacting to price patterns or technical indicators. Instead of chasing every breakout or relying on lagging signals, traders learn to identify areas where institutional participants are likely to buy or sell.
Some of the reasons traders choose the ICT trading strategy include:
- Focuses on institutional order flow rather than traditional indicator signals.
- Helps identify high-probability trade setups using market structure and liquidity.
- Works across multiple markets, including forex, indices, futures, and cryptocurrencies.
- Encourages disciplined, rule-based decision-making instead of emotional trading.
- Provides a structured framework for analysing price action before entering a trade.
- Suitable for traders who prefer price action over indicator-heavy trading systems.
While the learning curve is steeper than many traditional strategies, many traders value ICT because it provides a logical framework for understanding institutional market behaviour rather than simply following signals.
The Logic Behind ICT: Why Price Really Moves
Before touching a single concept, you need to understand the engine underneath all of them. Get this part and everything else falls into place. Skip it and the boxes on the chart will feel random forever.
Imagine a hedge fund wants to buy a very large position. If they simply market-bought all of it at once, they would push price up against themselves and get a terrible average entry. The market does not have enough sellers sitting at the current price to fill an order that size cleanly. They need a large pool of people willing to sell to them, and they need it at a good price.
So where do those sellers come from? They come from other traders' orders. Specifically, from stop losses and pending orders clustered in predictable places. When price is driven down into a zone where thousands of buyers have their stops, those stops trigger as sell orders. That flood of selling is exactly what the institution needs to buy into. They absorb it, and then price often reverses hard in the direction they wanted all along.
This is why price so often spikes past an obvious level, triggers a wave of stops, and then snaps back the other way. To a retail trader it feels like the market is personally hunting them. In a sense, it is, just not personally. The market is engineering liquidity so big orders can be filled.
ICT is the practice of reading those footprints and getting on the same side as the big money instead of being the liquidity it feeds on. That is the entire philosophy in one paragraph. Every concept below is just a tool for spotting it in real time.
Why ICT Appeals to Serious Traders
ICT has earned a big following, especially among prop firm and funded traders, and it is worth understanding why before you commit time to it.
First, it is logical rather than mechanical. You are not blindly obeying an indicator. You understand why you are entering, which builds real conviction and makes it far easier to hold a trade or cut it when the reason disappears.
Second, it is selective by nature. ICT is built around specific times of day and specific price levels, not around trading all day long. That naturally pushes you toward fewer, higher-quality setups, which is the opposite of the overtrading that wrecks most beginners.
Third, it is universal. The same concepts of liquidity and structure show up in forex, indices, futures, and crypto, because any market with real institutional participation behaves the same way. Learn it once and you can apply it broadly.
There is an honest caveat here. ICT has a steep learning curve and a lot of moving parts, and the analysis can be subjective, meaning two traders can look at the same chart and mark it differently. It rewards screen time and patience, not shortcuts. Anyone promising instant mastery is selling you something. Treat it as a craft you build over months, not a hack you install over a weekend.
The Core ICT Concepts You Need First
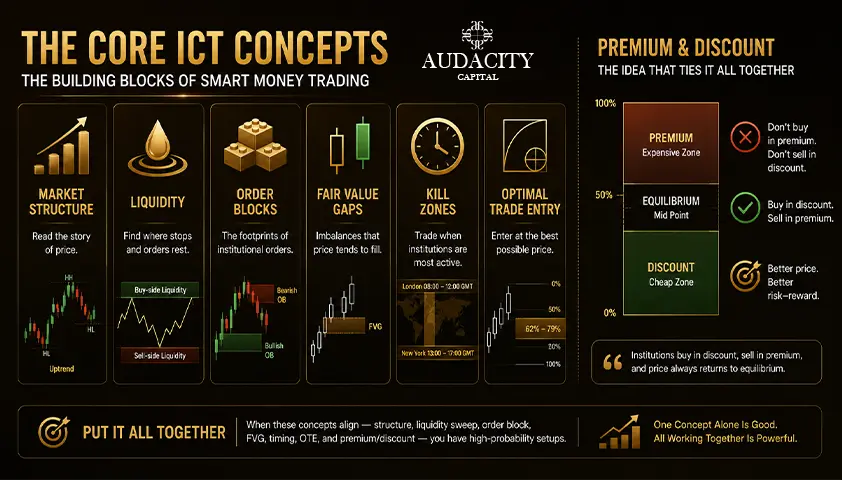
ICT has an enormous vocabulary, and that is what scares most beginners off. You do not need all of it to start. When you are new, focus on the six ideas below. Almost every ICT setup you will ever see is just these building blocks stacked on top of each other.
Market Structure
Market structure is simply the shape of price, the story the chart is telling about who is in control. Before you think about entries, you read structure to decide which direction you should even be looking.
An uptrend makes higher highs and higher lows. A downtrend makes lower highs and lower lows. When price stops respecting that rhythm, something is changing.
Two terms you will hear constantly:
- Break of Structure (BOS): price continues the trend by breaking the most recent high in an uptrend, or the most recent low in a downtrend. It confirms momentum in the current direction is still alive. A BOS is your green light that the trend has more to give.
- Change of Character (CHoCH): the first clue the trend might be flipping. In a healthy uptrend, price keeps making higher lows. The moment price breaks below the most recent higher low, that is a change of character, a warning that buyers may be losing grip and sellers are stepping in.
Here is the practical habit to build. Before anything else, zoom out and ask: is this market trending up, trending down, or stuck in a range? You want to trade in the direction of the higher timeframe structure and use the smaller timeframes only to time your entry. Fighting the higher timeframe is the single most common way beginners hand their money to the market.
Liquidity
This is the beating heart of ICT. If you only truly understand one concept, make it this one.
Liquidity means clusters of orders resting on the chart, and the biggest clusters are stop losses. Stops matter because when they trigger, they become market orders that move price, and institutions love feeding on that fuel.
Think about where people naturally place their stops. A trader who buys near an obvious low puts their stop just below that low. A trader who sells near an obvious high puts their stop just above it. Multiply that across thousands of traders and you get two predictable pools:
- Buy-side liquidity sits above swing highs. It is made of the stop losses of short sellers plus the buy orders of breakout traders. When price runs up into it, those orders trigger as buying.
- Sell-side liquidity sits below swing lows. It is made of the stop losses of buyers plus the sell orders of breakout traders. When price runs down into it, those orders trigger as selling.
Now watch how this plays out. Price spikes above an old high, triggers all that buy-side liquidity, and then reverses sharply lower. That is a liquidity sweep, also called a stop hunt or liquidity grab. The obvious high was not resistance in the classic sense. It was bait. The institutions needed the orders sitting above it, took them, and moved on.
The ICT skill is to stop being the trader who gets swept and start being the trader who waits for the sweep and then trades the reversal. Instead of buying the breakout above the high, you wait to see price grab that liquidity and fail, then look to sell. It feels backwards at first. It is also where a huge amount of the edge lives.
Order Blocks
An order block is the specific candle where institutions are believed to have placed a large batch of orders, right before a strong move. In practice it is the last candle in one direction immediately before a sharp move in the opposite direction.
A bullish order block is the last down candle before a strong push up. A bearish order block is the last up candle before a strong push down.
The reasoning is that this candle marks the price zone where big money loaded up. If price later returns to that zone, there may be unfilled institutional interest waiting there, which can turn the area into support or resistance. So when price retraces back into a bullish order block, ICT traders watch closely for signs of buyers stepping in again and look for long entries there.
An order block is stronger and more worth your attention when the move that followed it was sharp and decisive, and especially when that move also swept liquidity or broke structure on the way out. A limp move away from a candle makes for a weak order block. A violent, structure-breaking move makes for a strong one.
Fair Value Gaps
A fair value gap, or FVG, is an imbalance left behind when price moves so fast in one direction that it skips over a range of prices without trading through them properly. It shows up on the chart as a gap between the wicks of three consecutive candles: the high of the first candle and the low of the third candle do not overlap, leaving a clean empty space in the middle candle's range.
The idea is that markets dislike these inefficiencies. Because one side dominated so heavily that the other side barely got a chance to trade, price often comes back later to "rebalance" or fill part of that gap before continuing on its way. That fill area becomes a high-quality entry zone, because it lets you join the move at a better price, right where the original imbalance was created.
FVGs are especially powerful when they line up with other concepts. An FVG sitting inside an order block, formed right after a liquidity sweep, in the direction of the higher timeframe trend, is the kind of confluence that makes a setup worth taking seriously.
Kill Zones
ICT places huge importance on timing, and this is where a lot of the method's precision comes from. Kill zones are specific windows of the trading day when the market tends to make its cleanest, most decisive moves. These windows line up with when the major financial sessions are active or overlapping, so volume and volatility are at their highest and institutional activity is most likely.
The ones beginners should focus on are the London session in the morning and the New York session that follows, along with the overlap between them, which is often the most active and tradable window of the day. There are Asian session windows too, but the London and New York kill zones are where most beginners will find the cleanest opportunities.
The purpose of kill zones is discipline as much as opportunity. You do not need to stare at a chart for twelve hours. You show up for the window, look for your setup, take it if it appears, and if nothing clean shows up, you close the laptop. A beautiful-looking setup at 3pm on a dead afternoon often falls apart, because the volume that makes ICT moves work simply is not there. Trading the right times keeps you out of a lot of low-quality noise.
Optimal Trade Entry
Optimal Trade Entry, or OTE, answers the question every beginner eventually asks: "okay, but where exactly do I click buy?"
OTE uses Fibonacci retracement levels to pinpoint a precise entry within a move rather than jumping in wherever you happen to notice it. You draw the Fibonacci tool across the leg of the move, and the OTE zone is typically the area between the 62 percent and 79 percent retracement, often with the 70.5 percent level treated as the sweet spot in the middle.
The thinking is that a strong institutional move will usually pull back into this deeper retracement zone before continuing, offering you an entry with a tight stop and a large reward relative to risk. You do not need to master Fibonacci theory on day one. Just know that OTE is the tool that turns a general "price should bounce around here" into a specific price level with a defined stop and a clear target.
Premium and Discount: The Idea That Ties It Together
There is one more concept that quietly sits underneath everything above, and understanding it will sharpen every decision you make: premium and discount.
Take any price range or leg of a move and split it in half. The upper half is the premium, the expensive zone. The lower half is the discount, the cheap zone. The exact midpoint is called equilibrium.
The principle is simple and it mirrors common sense. You want to buy in the discount zone and sell in the premium zone, just like institutions do. If price is trading in the upper premium half of a range and you are looking to go long, you are trying to buy expensive, which is a poor deal. If you wait for price to retrace into the discount half before buying, you are getting the same trade at a better price with less risk.
Layer this over the other concepts and your setups improve immediately. A bullish order block in the discount zone is far more attractive than one in the premium zone. A long entry that fills a fair value gap while price sits in discount has the odds stacked more in its favour. Premium and discount is the filter that keeps you from taking good-looking setups at bad prices.
A Simple ICT Setup, Step by Step
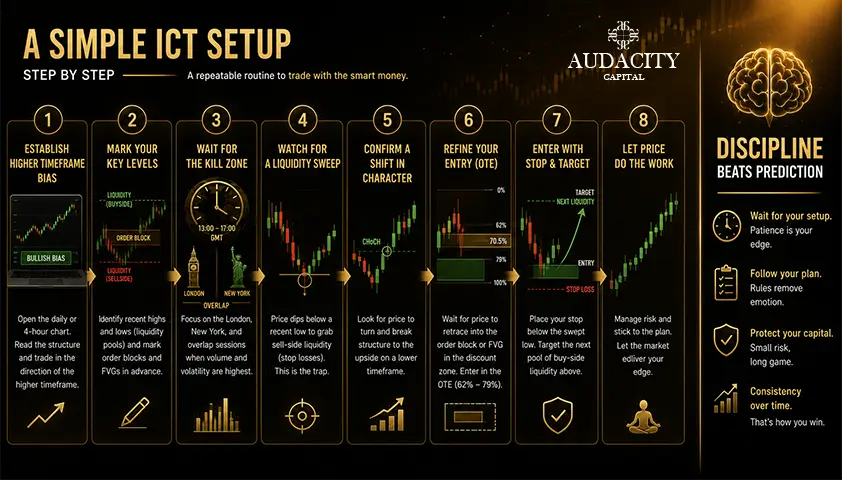
Let us put the pieces together into one clean beginner routine. This is a bullish example, but you flip everything for a short.
- Establish higher timeframe bias. Open the daily or 4-hour chart. Read the structure. Is it making higher highs and higher lows? If yes, you are only hunting longs today. This single filter, trading with the higher timeframe rather than against it, will do more for your results than any fancy entry technique. Write your bias down so you do not talk yourself out of it later.
- Mark your key levels in advance. Before the session, note the obvious recent highs and lows where liquidity is resting, and mark any clean order blocks or fair value gaps left behind by recent moves. You want your map drawn before the market opens, not scrambled together mid-trade.
- Wait for the kill zone. Do not force trades at random hours. Let price come to life during the London or New York window, when the volume that powers these moves is actually present.
- Watch for a liquidity sweep. Look for price to dip below an obvious recent low and grab the sell-side liquidity sitting there. This is the trap being set for everyone else. It is your signal to get ready, not to panic.
- Confirm a shift in character. After the sweep, you want to see price turn and break structure back to the upside on a lower timeframe. This change of character tells you the reversal is real buying stepping in, not just a random wick. Without this confirmation, you are guessing.
- Refine your entry. Now bring in your entry tools. Look for price to retrace into the bullish order block or fair value gap left behind by that move up, ideally while price sits in the discount half of the range. Use the OTE zone to tighten the entry to a precise level.
- Enter with a defined stop and target. Your stop goes below the low that was swept, because if price trades back below there, your idea is wrong and you want out cheaply. Your target is the next pool of buy-side liquidity above, an old high where stops are resting and price is likely to be drawn.
The beauty of this routine is that every step has a reason behind it. You know your direction, your timing, your entry, your stop, and your target before you ever risk a cent. That is the difference between trading a plan and gambling on a hunch.
How to Actually Learn ICT Without Burning Out
The concepts are only half the battle. How you learn them determines whether you make it. Here is a path that works.
Start with just three concepts: market structure, liquidity, and order blocks. Do not touch anything else until those three are second nature. Trying to use every tool at once is the fastest way to freeze up in front of a live chart.
Backtest before you go live. Open a chart, scroll back in time, and hunt for the setup manually across dozens of examples. This trains your eyes to spot patterns quickly and shows you honestly how often the setup actually works, which builds the patience to wait for good ones.
Then move to demo trading in real time. Trading a setup as it forms is a completely different skill from spotting it in hindsight. Expect to be clumsy at first. That is the point of demo.
Keep a trading journal from day one. Screenshot every trade, mark why you took it, and note what happened. Reviewing your own trades is where the real learning compounds. Most traders skip this, which is exactly why most traders stay stuck.
Only move to live capital once your demo results are consistent over a meaningful sample, not after a lucky week. Rushing this step is the single most expensive mistake in trading.
Common Beginner Mistakes to Avoid
A few traps catch almost everyone new to ICT. Sidestep these and you will climb the learning curve far faster.
- Overcomplicating the chart. Beginners try to apply every concept at once, freeze, and take nothing. Pick two or three, master them, then add more slowly.
- Ignoring the higher timeframe. Taking a long on the 1-minute chart while the daily is pointing firmly down is a quick way to lose. Bias first, always, without exception.
- Trading outside the kill zones. Setups that look perfect during dead hours often fall apart because the volume that makes them work is missing. Respect the windows.
- Chasing every wiggle as a liquidity sweep. Not every dip below a low is a meaningful sweep. Wait for the sweep plus a confirmed change of character before acting.
- Forcing setups that are not there. ICT is a waiting game. Some days offer no clean trade at all, and doing nothing is the correct, professional move on those days.
- Skipping the boring work. Backtesting and journaling feel slow and unglamorous, so most people skip them. That is precisely why most people never get consistent.
- Rushing to live capital. ICT needs real screen time on demo before it belongs anywhere near real money. Practise it, prove it, then fund it.
Key Takeaways
- ICT, or Inner Circle Trader, is a methodology built on trading alongside institutional "smart money" rather than against it, developed by Michael J. Huddleston.
- Its core logic is that large institutions engineer price into pools of liquidity, the resting stop losses of retail traders, so they can fill their huge orders, and then price reverses.
- The six concepts to master first are market structure, liquidity, order blocks, fair value gaps, kill zones, and optimal trade entry.
- Premium and discount is the filter that ties everything together: buy in the cheap discount zone, sell in the expensive premium zone.
- A clean beginner setup follows a repeatable routine: higher timeframe bias, marked levels, kill zone timing, liquidity sweep, change of character, refined entry at an order block or FVG, and a defined stop and target.
- Learning ICT is a months-long craft. Start with a few concepts, backtest, demo trade, journal everything, and only go live once you are consistent.
- Discipline beats prediction. The traders who win are the ones who wait for their setup and do nothing the rest of the time.
Put Your ICT Knowledge Into Practice
Understanding the ICT trading strategy is only the first step. The real progress comes from applying its concepts consistently, refining your decision-making, and managing risk with discipline. Start by practising on a demo account, reviewing your trades, and building confidence before trading live.
Ready to test your strategy? Explore Audacity Capital's Free Trial and experience a realistic trading environment without risking your own capital.
Frequently Asked Questions
The philosophy is beginner-friendly, but the execution takes real practice. Start with a small number of concepts, trade them on a demo for a few months, journal your results, and only scale up once your routine is consistent. Do not expect to master everything in a weekend, and be wary of anyone who tells you that you can.
Start with market structure, liquidity, and order blocks. Once those feel natural, add fair value gaps, kill zones, and optimal trade entry, and layer premium and discount over the top. Almost every advanced ICT setup is just these basics stacked together.
Yes. ICT was developed mainly on forex and futures, but the concepts apply to any liquid market where institutions drive price, including major indices and crypto. Liquidity and structure behave the same way wherever there is real institutional participation.
Not really. ICT is a price-action method designed for a clean chart. The main tool you might add is the Fibonacci retracement for optimal trade entry. Beyond that, most of your analysis is reading raw candles, structure, and levels.
It is when price deliberately spikes past an obvious high or low to trigger the stop losses resting there, then reverses. Institutions do this to grab the orders they need to fill their positions. Instead of getting caught by it, ICT traders wait for the sweep and trade the reversal that follows.
A Break of Structure confirms the current trend is continuing, when price breaks the last high in an uptrend or the last low in a downtrend. A Change of Character is the first sign the trend may be reversing, when price breaks the opposite way against the recent structure. BOS says "keep going," CHoCH says "watch out, this might be turning."
There is no fixed answer, and anyone promising overnight results is selling something. Most traders need several months of focused screen time, backtesting, and journaling before their execution is consistent. Treat it as a skill you build steadily, not a shortcut you unlock.

Pronto ad applicare un rischio disciplinato alle criptovalute? Esplora i nuovi strumenti crypto di Audacity Capital e porta la tua strategia di trading.
Scopri di PiùNewsletter
Iscriviti alla newsletter per restare aggiornato.
Unisciti Alla Nostra Community Social

Inizia Il Tuo Viaggio Oggi Con La Nostra Prova Gratuita
Mostra con orgoglio le tue abilità e i tuoi risultati attraverso certificati e ottieni riconoscimenti per il tuo duro lavoro e dedizione da potenziali investitori e colleghi.
Prova GratuitaArticoli Correlati
Opening Range Breakout Strategy: Rules, Setups and Examples
Learn how the opening range breakout strategy works, including ORB rules, 5, 15 and 30-minute setups, entry signals, stop losses and risk management.


ICT Silver Bullet Strategy: Windows, Setup and Execution Rules
The ICT Silver Bullet windows, the setup step most guides skip, entry and stop rules, and what the published win rates rest on.

Martingale Strategy in Trading
How the martingale trading strategy works, what the doubling arithmetic actually costs, why position sizing cannot create an edge, and where it is banned.

Momentum Trading Strategy: A Comprehensive Guide
Master the core principles of a momentum trading strategy. Learn how to use key indicators, manage sharp-reversal risks, and master exit timing.