
Best Technical Indicators for Forex Trading (Beginner’s Guide 2026)
Quick Answer
The best technical indicators for forex trading include RSI, MACD, moving averages, Bollinger Bands, and Fibonacci retracement. Traders use them to identify trends, momentum, volatility, and entry or exit points.
Introduction
Have you ever wondered how experienced traders predict price movements? In this guide, we explain how forex traders use technical indicators to improve their trading decisions and better understand market psychology.
When used together, these indicators form part of a trader’s toolkit. In technical analysis, metrics such as trading volume help determine whether price movements are likely to continue. These indicators can assist traders in generating buy and sell signals.
Some of the best indicators beginners often start with include:
- Moving Average Convergence Divergence (MACD)
- On-Balance Volume (OBV)
- Relative Strength Index (RSI)
What Are Technical Indicators?
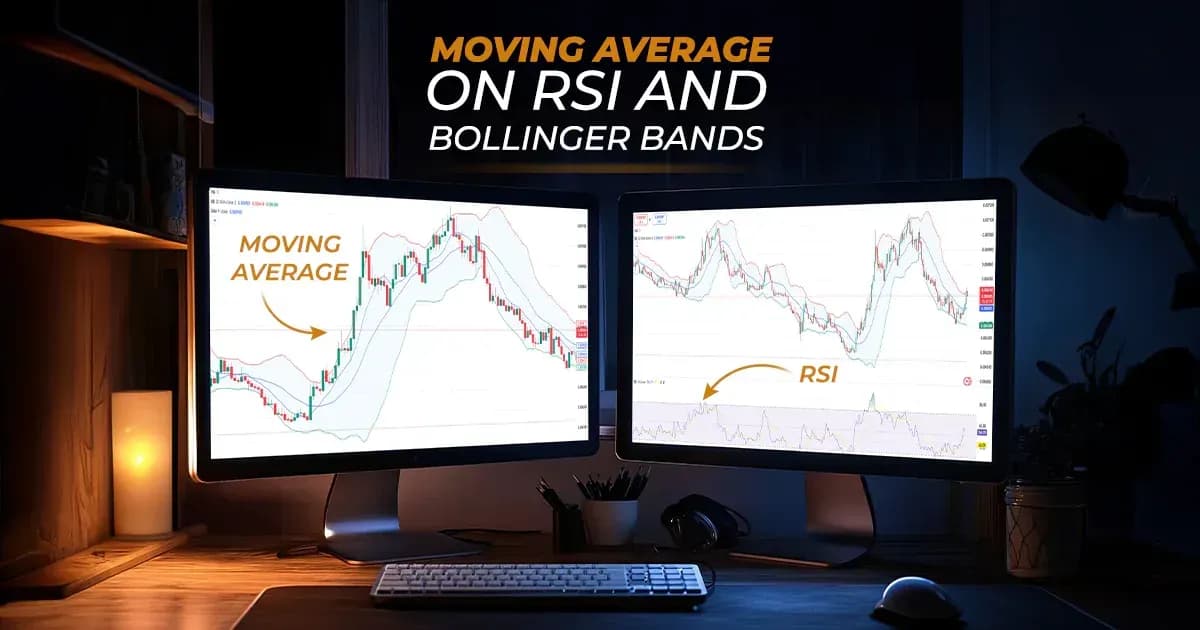
Chart Showing Two Types of Indicators: RSI and EMA. Source: Real Trading
Technical indicators are mathematical calculations based on price, volume, or other market data. They help traders gain objective insights and reduce emotional decision-making.
Read more detailed explanation about Technical Indicators (Complete Guide)
Understanding Technical Indicators
A technical indicator is derived from trading data such as price, volume, and open interest. Some indicators generate signals on their own, while others are used together to provide better analysis.
Traders use these tools to evaluate trends, strengths, and weaknesses in the market.
Why Technical Indicators Matter for Trading Success
Technical indicators help traders identify patterns in price movements. By analysing historical data such as momentum and volume, traders can make more informed decisions.
These tools are especially useful for short-term traders like day traders and swing traders, but they can also support long-term strategies.
Best Technical Indicators for Forex Trading
The best technical indicators for forex trading include:
- Moving Averages
- RSI (Relative Strength Index)
- MACD (Moving Average Convergence Divergence)
- Bollinger Bands
- Fibonacci Retracement
Each of these indicators helps traders analyse trends, momentum, and volatility.
Why These Are the Best Indicators
These indicators are widely used because they provide different types of market insights:
- Moving Averages → Identify trend direction
- RSI → Detect overbought and oversold conditions
- MACD → Confirm momentum and trend changes
- Bollinger Bands → Measure volatility and breakout potential
- Fibonacci Retracement → Identify key entry and exit levels
When to Use Each Indicator
Indicator | Best Use Case |
|---|---|
Moving Average | Trend identification |
RSI | Overbought/oversold signals |
MACD | Momentum confirmation |
Bollinger Bands | Volatility & breakouts |
Entry levels |
Types of Technical Indicators
Technical indicators are generally divided into four main categories:
Trend Indicators
Trend indicators help identify the direction of the market.
- Simple Moving Average (SMA): Calculates the average price over a period
- Exponential Moving Average (EMA): Gives more weight to recent price data
Momentum Indicators
Momentum indicators measure the speed of price movement.
- RSI: Identifies overbought and oversold conditions
- MACD: Shows momentum and trend strength
Volatility Indicators
Volatility indicators measure how much price moves.
- ATR (Average True Range): Measures volatility
- Bollinger Bands: Identify breakouts and market conditions
Volume Indicators
Volume indicators measure the strength of a trend.
- OBV (On-Balance Volume): Tracks buying and selling pressure
- Chaikin Oscillator: Measures market momentum
When to Use Each Technical Indicator
Indicator | Best Use Case |
|---|---|
Moving Average | Identify trends |
RSI | Overbought/oversold |
MACD | Momentum confirmation |
Bollinger Bands | Volatility & breakouts |
Fibonacci | Entry levels |
Best Indicators for Beginners vs Advanced Traders
- Beginners: Moving averages, RSI
- Intermediate: MACD, Bollinger Bands
- Advanced: Fibonacci, indicator combinations
Comparison of Technical Indicators
Indicator | Type | Difficulty |
|---|---|---|
RSI | Momentum | Easy |
MACD | Momentum/Trend | Medium |
Moving Average | Trend | Easy |
Bollinger Bands | Volatility | Medium |
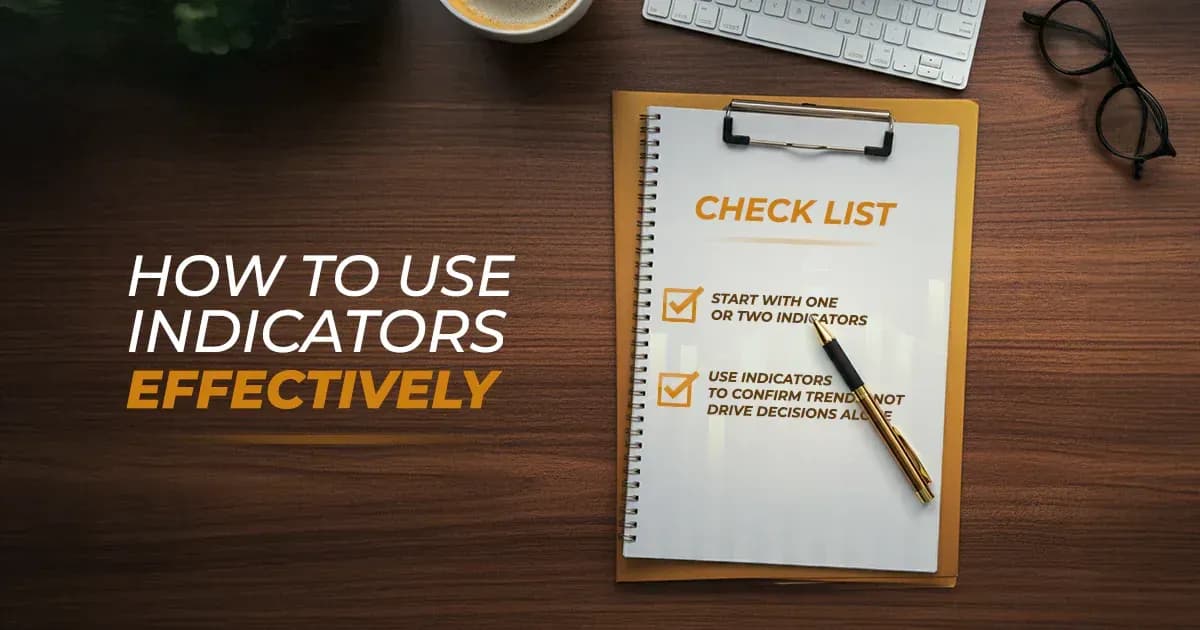
Technical Indicator Checklist
- Use only 2–3 indicators
- Combine different types of indicators
- Always use a stop-loss
- Match indicators with market conditions
Example Strategy Using Indicators
A simple strategy is combining a 50 EMA with RSI.
If the price is above the EMA and RSI is below 30, traders may look for buying opportunities.
How to Combine Technical Indicators Effectively
There are many indicators available, but using too many can lead to confusion. Most experienced traders focus on a few key indicators.
To choose the right indicators:
- Match them with your trading strategy
- Analyse current market conditions
- Define your trading goals
Read Our guide How to use technical indicators
Combining Indicators for Stronger Signals
Using multiple indicators provides better confirmation.
Examples:
- Moving Average + RSI
- MACD + Bollinger Bands
- Stochastic Oscillator + ADX
Avoiding Indicator Overload
Using too many indicators can clutter your charts and reduce clarity.
Tips:
- Keep charts simple
- Use only necessary indicators
- Focus on clarity over quantity
Common Mistakes to Avoid
Over-Reliance on Indicators
Indicators should guide decisions, not replace analysis.
Overcomplicating Charts
Too many indicators can lead to confusion and poor trading decisions.
Best Risk Management Practices
Position Sizing
Risk only 1–2% of your capital per trade.
Risk-to-Reward Ratio
Aim for at least 1:2 or 1:3.
Avoid Over-Leverage
Use lower leverage to reduce risk.
Use Stop-Loss Orders
Protect your capital from large losses.
Conclusion
Technical indicators such as RSI, MACD, and moving averages help traders identify trends, momentum, and reversals. However, they should always be used alongside proper risk management and strategy.
Start with a few indicators, practice on a demo account, and focus on consistency to improve your trading performance.
FAQ
The best technical indicators for forex trading include RSI, MACD, moving averages, Bollinger Bands, and Fibonacci retracement. Each indicator helps traders analyse trends, momentum, and market volatility.
No technical indicator is 100% accurate. However, indicators like RSI, MACD, and moving averages are widely used because they provide reliable signals when combined with proper analysis and risk management.
Most traders use 2–3 indicators at a time. Using too many indicators can lead to confusion and conflicting signals, making it harder to make clear trading decisions.
Yes, beginners can use technical indicators. It’s best to start with simple indicators like moving averages and RSI before moving on to more advanced tools like MACD or Fibonacci retracement.
Traders combine indicators from different categories, such as trend, momentum, and volatility. For example, using a moving average for trend direction and RSI for entry timing is a common approach.
No, technical indicators alone are not enough. Traders should combine them with risk management, market analysis, and proper trading strategies to achieve consistent results.
Leading indicators predict potential price movements, while lagging indicators confirm trends after they have started. Both are useful when used together.
Yes, professional traders use technical indicators, but they typically combine them with price action, market structure, and risk management strategies.

暗号資産に規律あるリスクを適用する準備はできていますか?Audacity Capitalの新しい暗号資産商品を探索し、あなたの取引戦略を持ち込んでください。
詳細を見るニュースレター
ニュースレターに登録して最新情報を入手。
ソーシャルコミュニティに参加
関連記事

What Is Forex Trading Volume?
Learn what trading volume means in Forex trading, how it’s measured, and how traders use volume to confirm trends and price movements.

How to Use Fibonacci Retracement in Forex Trading (And Actually Make It Work)
Learn how to use Fibonacci retracement in forex trading to identify pullbacks, support and resistance levels, and high-probability trade entries.

Fibonacci in Forex Trading: How to Use Fibonacci Levels Like a Pro in 2026 ?
Learn how traders use Fibonacci in forex trading, including retracements, extensions, fans, arcs, time zones, and proven trading strategies.
