



What Is Support and Resistance in Trading?



Support and Resistance in Trading are areas on a chart where the market price could stop or change direction. Support is a price level or zone below the current market price. It could stop the price from falling further because we expect buying interest to increase around this area. Resistance is a price level or zone above the current market price. It could stop the price moving higher because an increase in selling pressure may overcome the demand at that level.
When we look at support, we are looking at potential floors to market price action. When we look at resistance, we are looking at potential ceilings.
But levels don’t hold for long, and price can move through support and resistance before coming back to the area. Or it can continue past the level altogether.
Traders use these areas to look for:
- Possible entry and exit points
- Stop-loss levels
- Profit targets
- Potential breakout areas
Let’s get into the depth of this topic:
What Is Support and Resistance in Trading?
Support is a price level or area below the current market price. It should, or could, stop the price from falling further because buying interest may increase around that area.
Resistance works in the opposite way. It is a price level or area above the current market price where selling pressure could prevent the price from moving higher.
These levels are formed from what price has done before. When the market keeps falling towards the same area and then moves higher, traders watch that area as support. But if the price repeatedly rises towards another area and then falls, that area becomes resistance.
Thomas N. Bulkowski's work on support and resistance describes these areas as places where price can stall or reverse, while also noting that price can move through them.
This is why support and resistance should not be treated as perfect lines.
A better way to look at what is support and resistance in trading:
- Support: An area where falling price could find buying interest.
- Resistance: An area where rising price could meet selling interest.
How do Support and Resistance Work?
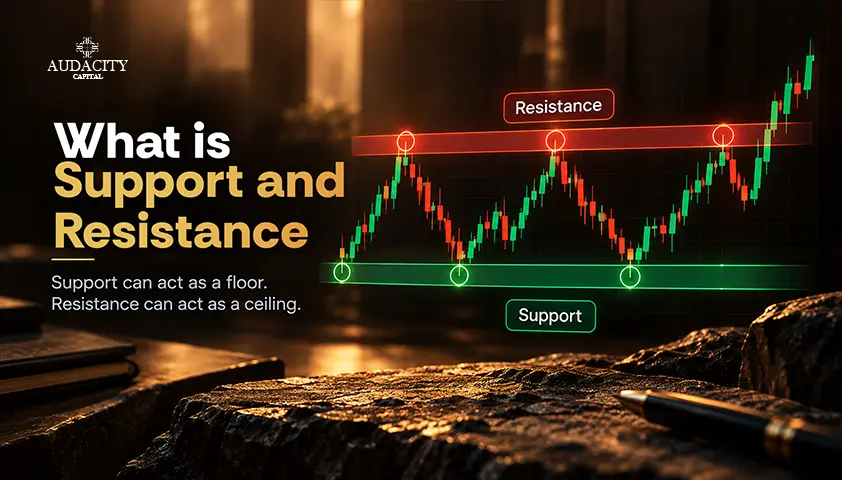
Support and resistance are based on what the market has done before. When price reacts strongly around an area, traders could remember that reaction. When price comes back to the same area, that previous reaction can make the level important again.
For example, suppose Nifty has moved towards the same price several times but has struggled to move higher. Traders who were already involved in the previous moves, or those who missed them, may watch that area when price returns. This could then lead to another reaction.
But the number itself is not what makes the level important. It is the price behaviour around that number that matters.
When we look at support, we are looking at an area where buying interest could appear. When we look at resistance, we are looking at an area where selling interest could appear.
This is also why support and resistance should not always be drawn as one exact price. There is an approximation involved when identifying these areas, so there should be some room for error.
How to Find Support and Resistance in Trading?

There are several ways to find support and resistance in trading. Some traders start with previous highs and lows, while others look for areas where price has stopped, reversed, or moved sideways. The important point is to look for price areas that the market has reacted to before.
1. Previous Swing Highs and Swing Lows
A previous swing high could act as resistance because price has already struggled around that area. A previous swing low could act as support because price has previously found buying interest there.
When the market reacts around the same area more than once, that area becomes more interesting. It is recommended to look for multiple price-action zones that are well spaced in time when identifying support and resistance.
2. Previous Highs and Lows
Previous day highs and lows can be useful, especially for intraday trading. Previous week highs and lows, along with major historical highs and lows, can also give traders areas to watch.
These levels do not have to hold. They simply give traders a reference point before price reaches the area again.
3. Consolidation Areas
An area where price has spent a lot of time moving sideways can also become important. Price may have moved up and down around the same area several times before eventually breaking away.
A level that price barely noticed once is usually less interesting than an area where the market repeatedly changed direction.
4. Round Numbers
Round numbers can also attract attention. Examples could include ₹1,000 on a stock, 25,000 on an index, or 1.1000 in forex.
But round numbers are not automatically strong levels. Previous price action should still provide the main reason for marking them.
5. Trendlines and Moving Averages
Trendlines and moving averages can provide dynamic support or resistance. Unlike a horizontal level, these areas move as the market moves.
They can be useful when the market is trending, although they should not replace the basic price levels already visible on the chart.
6. Look at More Than One Timeframe
A level that is visible on a daily chart could matter differently from one that appears only on a five-minute chart. Higher timeframes can show the wider support and resistance areas, while lower timeframes can help with the timing of a trade.
When several timeframes point towards the same area, that area could deserve more attention.
Types of Support and Resistance
There are several types of support and resistance that traders can use when looking at a chart. The most common are horizontal levels, dynamic levels, psychological levels, and role-reversal levels.
Horizontal Support and Resistance
Horizontal support and resistance are the simplest types to understand. They are areas where price has stopped, reversed, or struggled to move through before.
Support can be a previous swing low, whereas resistance can be a previous swing high. These levels can be useful because the market has already reacted around them.
Dynamic Support and Resistance
Dynamic support and resistance move as the market price moves. Trendlines, moving averages, and channels can all be used in this way.
For example, a moving average could act as support when price is moving higher. A trendline could also give an area where price may stop falling during an uptrend. Previous highs and lows, moving averages, and trendlines are some common ways through which traders identify these areas.
Psychological Levels
Round numbers can sometimes act as support or resistance as well, just don't treat every round number as a key level by default.
Role-Reversal Levels
Sometimes resistance becomes support after price breaks above it. In the same way, support can become resistance after price breaks below it. This is known as role reversal, and this behaviour is an important part of support and resistance.
Here's the thing: A broken level often tells you more when price comes back to test it than on the first break itself. The reaction of price around that old level says a lot about whether the breakout is actually holding.
Some experts also talk about drawing these levels too. Support and resistance isn't an exact science. Your line doesn't have to touch the exact high or low, which is another reason to think of them as zones, not precise prices.
How to Use Support and Resistance in Trading?
When you are planning a trade, you can use support and resistance in a few ways:
- To find possible entries
- To decide where your trade idea is no longer valid
- To set profit targets and watch for breakouts
Using Support for Entries
When price approaches support, traders may look for signs that the area is holding. This could be a rejection of lower prices, a change in price direction or the market spending time above the support area.
This does not mean that traders should automatically buy at support. The level only gives an area to watch. The price action around the area still matters.
Using Resistance for Entries
The same idea can be applied to resistance. When price reaches an area where it has struggled before, traders may look for signs that the market is finding it difficult to move higher.
A short trade could then be considered if the trader's other conditions are also met.
Using Levels for Stop Losses
Support and resistance can also help with stop-loss planning. If a trader takes a long position because support appears to be holding, a move clearly below that support could mean the original idea is no longer working.
The same applies to a short trade around resistance. A move clearly above the resistance area could change the trade setup.
Using Levels for Profit Targets
The next opposing level can also provide a possible profit target. For example, a trader looking at a long position near support could look towards the next resistance area as a place where the price may struggle again.
Trading Breakouts
Support and resistance become useful even after a level breaks. Price can push above resistance, hold above it, and keep going higher. Or it can break through and then fall back below the level.
That's why many traders wait for a retest before deciding to take the breakout. If old resistance holds as new support, it's another sign that the market is actually accepting the move.
Trading insight: A breakout isn't just about price crossing a line. What happens after the break is often just as important as the break itself.
Support and resistance don't tell you what price has to do next. They help you figure out where a trade idea makes sense, and where it doesn't anymore.
What Is Support and Resistance in Forex Trading?
There’s a lot of buzz around the question, “What is support and resistance in forex trading?”, and the basic idea is the same as in other markets.
In forex trading, participants can check the previous highs and lows, including areas where price has reacted several times, round numbers, and higher-timeframe levels. For instance, 1.1000 can be an area worth watching on EUR/USD, especially if price has reacted around the same area before.
Forex also trades across major market sessions, so the same currency pair can move through different levels as activity changes during the day. Previous session highs and lows can therefore provide useful areas to watch.
Sharp price movement can also be a result of economic releases. Price can shift through support or resistance regardless of whether the level had previously produced several reactions. Support and resistance are present across different timeframes, and these levels are not absolute.
How to Find Support and Resistance in Day Trading?
Finding support and resistance in day trading is slightly different because traders are usually looking at shorter periods of price movement. Previous session highs and lows, the opening range and intraday swing points can all provide useful areas to watch.
Some of the main areas to look at include:
- Previous day high and previous day low
- Previous day's closing price
- Opening range high and low
- Intraday swing highs and swing lows
- Major support and resistance from higher timeframes
- Round numbers
- Areas in which the current session has reacted already
Work from the wider chart towards the shorter chart – it’s the simplest way to find these levels.
Step 1: Start with the daily (or higher timeframe) chart and mark the main support and resistance areas (or zones).
Step 2: Mark the previous session high, low, and close.
Step 3: Move to the intraday chart, such as the 5-minute or 15-minute chart, and look for new swing highs, swing lows, and consolidation areas (or zones).
Step 4: Watch what happens when price reaches one of the marked areas. That is because we expect a reaction at this level, which would show whether the area is holding.
Step 5: Only plan the trade if the potential entry, stop loss, and target (or profit target) make sense together. It would be expected that they should, or could, give the trade a clear structure.
Previous-session prices are also used in technical tools such as pivot points, which calculate potential support and resistance from previous-period high, low, and closing prices.

Start Your Funded Trading Journey
Become a Funded TraderSupport and Resistance in the Indian Market
Support and resistance are also useful when trading the Indian market. Nifty 50, Bank Nifty and liquid NSE stocks can all show areas where price has previously stopped, reversed or struggled to move further.
One simple example would be the previous session's high on Nifty.
A trader may mark that level before the market opens. If Nifty approaches it during the morning session, the level gives the trader an area to watch. Price could reject the level, move sideways below it or break above it.
If the level breaks, the next question is what happens afterwards. Price could continue higher, or it could return to the old level and fall back below it.
Previous session lows can be viewed in the same way. Opening ranges, major daily levels and important levels from the wider market can also give useful references during the session.
The same approach can be used for Bank Nifty, sector indices and individual NSE stocks. The level is only the starting point. That is because we expect the reaction around that level to give it meaning.

Join the Free Prop Firm Trading Competition
Register for FreeCommon Mistakes When Trading Support and Resistance
There are a few common mistakes that can make support and resistance less useful.
- Treating support and resistance as exact prices instead of areas.
- Drawing so many levels that the chart becomes difficult to read.
- Looking only at the short-term chart and ignoring the wider market structure.
- Assuming that every touch of support will produce a bounce.
- Entering a trade immediately without looking at the price reaction.
- Forgetting to check where the next support or resistance area sits.
- Moving a stop loss further away after a level has clearly failed.
The biggest problem is usually not finding the wrong level. It is expecting the level to behave in a particular way every time.
A level is useful because it gives the trade structure. But if you treat it as a guarantee, it becomes dangerous.
Conclusion
Support and resistance are reference points. They should, or could, show areas where the market has reacted before. That is because we expect price could react again at this level.
The most useful way to work with them is to treat them as zones rather than exact numbers. Previous highs and lows, timeframe, price action and the reaction around the level can all help decide whether an area is worth watching.
It would be expected that support and resistance will not tell traders exactly what price will do next. They should, or could, however, give a trading plan more structure. This would then make it easier to decide where an idea could work and where it may no longer make sense.
FAQs
Support is an area below the current market price where price could stop falling. Resistance is an area above the current price where price could stop moving higher.
Look for previous swing highs and lows, repeated price reactions, consolidation areas, previous highs and lows, round numbers and other areas where price has reacted before.
Focus on clear turning points, levels that have been tested more than once, sideways zones, last session's high and low, big round figures, and any price zone where the market paused or reversed before.
The basic idea is the same in forex. Traders look for areas where currency prices have previously stopped, reversed or struggled to move further.
Yes. When price breaks below support, the same area could later act as resistance. The opposite can happen when resistance breaks and later becomes support.
Yes. Support and resistance are not guarantees. Price can move through either area, particularly when market conditions change or strong price movement develops.

暗号資産に規律あるリスクを適用する準備はできていますか?Audacity Capitalの新しい暗号資産商品を探索し、あなたの取引戦略を持ち込んでください。
詳細を見るニュースレター
ニュースレターに登録して最新情報を入手。
ソーシャルコミュニティに参加

関連記事
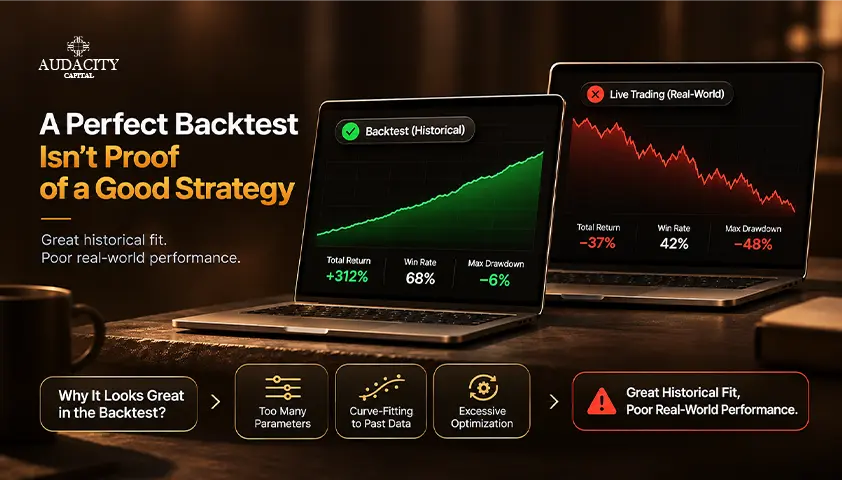
Overfitting in Trading: Signs, Causes & How to Avoid It
Learn what overfitting in trading means, why strategies become overfit, the warning signs to watch for, and how to build more robust trading systems.


Swap in Trading: What It Is, How It Is Calculated and How It Affects Your Positions
Learn what a swap in trading is, how overnight fees are calculated, when triple swaps apply, and how swap costs affect forex and CFD positions.
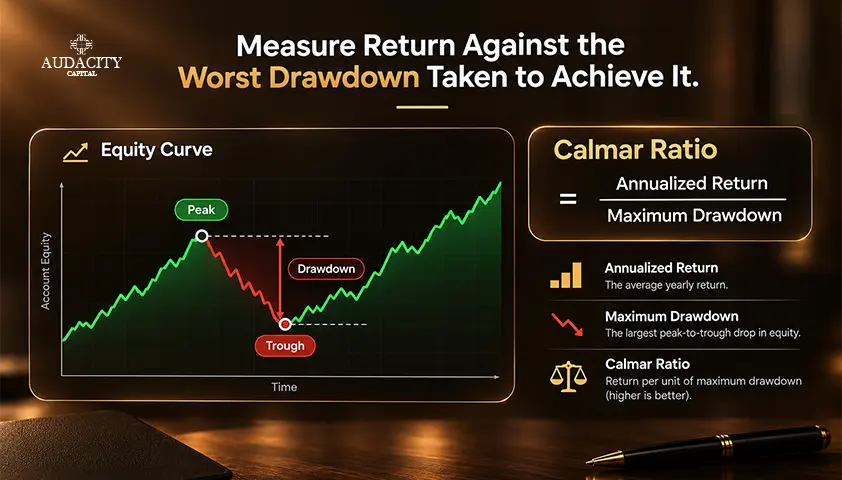
Calmar Ratio: Meaning, Formula and Examples
Learn what the Calmar Ratio means, how to calculate it, interpret results, and compare it with Sharpe and Sortino ratios.

Stochastic Oscillator
Learn how to use the stochastic oscillator in trading, interpret overbought and oversold levels, spot crossovers, and adjust settings.