
Bullish Engulfing Candlestick Pattern: The Complete Trader's Guide

Bullish Engulfing Candlestick Pattern
The bullish engulfing candlestick pattern is a bullish reversal signal that appears after a downtrend.
It forms when:
- a bearish candle is followed by
- a larger bullish candle that completely engulfs the previous candle’s body
This pattern signals that buyers have overwhelmed sellers and that momentum may be shifting higher.
When used correctly, traders use the bullish engulfing pattern to:
- identify trend reversals
- confirm support zones
- improve entry timing
- structure swing trading setups
However, not every bullish engulfing pattern leads to a reversal. Context, volume, support levels, and confirmation signals all play a major role in determining whether the setup is reliable or a false bullish trap.
In this guide, you’ll learn:
- how to identify the bullish engulfing pattern
- how traders confirm the signal
- common mistakes to avoid
- practical trading strategies and risk management rules
Bullish Engulfing Pattern (Quick Answer)
Feature | Explanation |
|---|---|
Pattern Type | Bullish reversal pattern |
Candles | Two-candle formation |
Appears After | Downtrend |
Signal | Buyers overpower sellers |
Best Timeframes | Daily & H4 |
Strongest Confirmation | Support + volume spike |
Risk Management | Stop below engulfing candle low |
What Is the Bullish Engulfing Pattern?
The bullish engulfing pattern is a two-candlestick reversal formation that appears after a price decline. The first candle is bearish, confirming the existing downtrend. The second candle is bullish and its body completely swallows the body of the first candle, showing that buyers overpowered sellers within a single session.
In plain language: sellers drove prices lower, then buyers stepped in so aggressively that they erased the entire prior session's loss and closed higher.
This reversal in one or two sessions can signal the beginning of a trend reversal or, at minimum, a significant counter-trend rally that offers a tradeable long opportunity.
Quick Stat
Key Fact: Research by Liberated Stock Trader puts the bullish engulfing pattern's win rate at approximately 53% on the daily timeframe when traded in isolation. That figure rises meaningfully when the pattern is combined with support zones, oversold indicators, and high volume confirmation.

Fig 1. Bullish Engulfing Pattern: anatomy, structure, and pattern rules
Anatomy of the Bullish Engulfing Candlestick
Before you can use this pattern with confidence, you need to understand what each candle is communicating.
Candle 1: The Bearish Candle
- Red or black body, showing sellers were in control
- Appears during an established downtrend
- Can be any size, though a smaller body makes the engulfment more significant
- Closes near its session low, reflecting continued bearish pressure
Check more about latest guide Bearish Engulfing Candlestick Pattern
Candle 2: The Bullish Engulfing Candle
- Green or white body
- Opens below or at the close of the previous candle (often a gap down)
- Its body fully engulfs the body of the first candle: its open is lower than the prior close and its close is higher than the prior open
- Ideally closes near the session high, showing strong buyer control into the close
- Shadows (wicks) are secondary; it is the bodies that define the pattern
Pattern Rule
Important distinction: Only the real bodies need to overlap. The second candle does not have to engulf the full high-to-low range of the first candle. If it does engulf the wicks as well, that is a stronger version of the signal.
How to Identify a Bullish Engulfing Pattern: Step-by-Step
Use this checklist every time you think you see the pattern forming.
Step | What to Check | Why It Matters |
1 | Confirm a prior downtrend is in place | Without a preceding decline, there is nothing to reverse |
2 | Candle 1 is bearish (red/black body) | Confirms sellers controlled the prior session |
3 | Candle 2 opens at or below C1 close | Shows bearish sentiment carried into the new session |
4 | Candle 2 body fully engulfs C1 body | The core requirement; buyers have overwhelmed sellers |
5 | Candle 2 closes near session high | Confirms buyers maintained control through the session |
6 | Check location: near support or prior low? | Context dramatically improves signal reliability |
7 | Look for volume spike on Candle 2 | High volume confirms conviction behind the rally |
The Psychology Behind the Pattern

Candlesticks record human emotion in real time. The bullish engulfing pattern tells a very precise story across two sessions.
Day 1: The market closes lower. Sellers are confident. Bearish momentum appears to be continuing.
Day 2 open: Price gaps down. Bears feel vindicated. New sellers enter, expecting further declines.
Day 2 intraday: Buyers emerge at lower prices, absorbing every sell order. Sellers begin covering positions.
Day 2 close: The session closes above the prior day's open. Sellers are now trapped and sitting on losses. Confidence collapses.
This sequence matters because it reveals a failed breakdown. The market tried to go lower, found aggressive demand, and reversed. That failure at lower prices is the signal. It is not just a pattern on a chart. it is visible proof that buyers overwhelmed sellers at that level.
Signal Strength: What Makes a Bullish Engulfing Pattern More Reliable?
Not all bullish engulfing patterns are equal. These factors increase the probability that the signal leads to a genuine rally.
- Size of the engulfing candle: A larger green candle relative to the prior red one shows stronger conviction. The wider the engulfment, the more decisive the buyer takeover.
- Location at support: Patterns forming at well-established support zones, prior lows, or key Fibonacci retracement levels carry far more weight than those appearing mid-range.
- Volume confirmation: A surge in volume on the bullish candle shows institutional participation. Patterns on thin volume are far more likely to fail and reverse again.
- Close near the high: A candle that closes at or near its session high shows buyers were dominant through to the end of the session. A long upper wick would reduce signal strength.
- Length of the preceding downtrend: The longer the decline before the pattern, the more buyers are likely waiting at lower prices. Extended sell-offs build demand that amplifies the reversal.
- Confirmation from indicators: RSI in oversold territory (below 30), price at the lower Bollinger Band, or bullish divergence on MACD all strengthen the case for a reversal.

Six confluence factors that strengthen the bullish engulfing signal
Bullish Engulfing vs Similar Candlestick Patterns
Several bullish reversal patterns look similar on the surface. Understanding the differences helps you read price action accurately and avoid misidentification.
Bullish Engulfing | Similar Pattern |
Two candles; the second body fully covers the first body | Piercing Line: Similar two-candle bullish pattern, but the second candle only closes past the midpoint of the first, not a full engulf. Weaker signal. |
Requires a prior downtrend for context | Hammer: Single-candle bullish reversal with long lower wick. Shows rejection at lows but less conviction than a full engulfing candle. |
Second candle closes above the first candle's open | Morning Star: Three-candle pattern with a doji in the middle. More reliable but rarer. Requires indecision candle before the bullish close. |
Volume spike on second candle strengthens the signal | Inverted Hammer: Single bullish candle with a long upper wick at the bottom of a downtrend. Requires more confirmation, less decisive. |
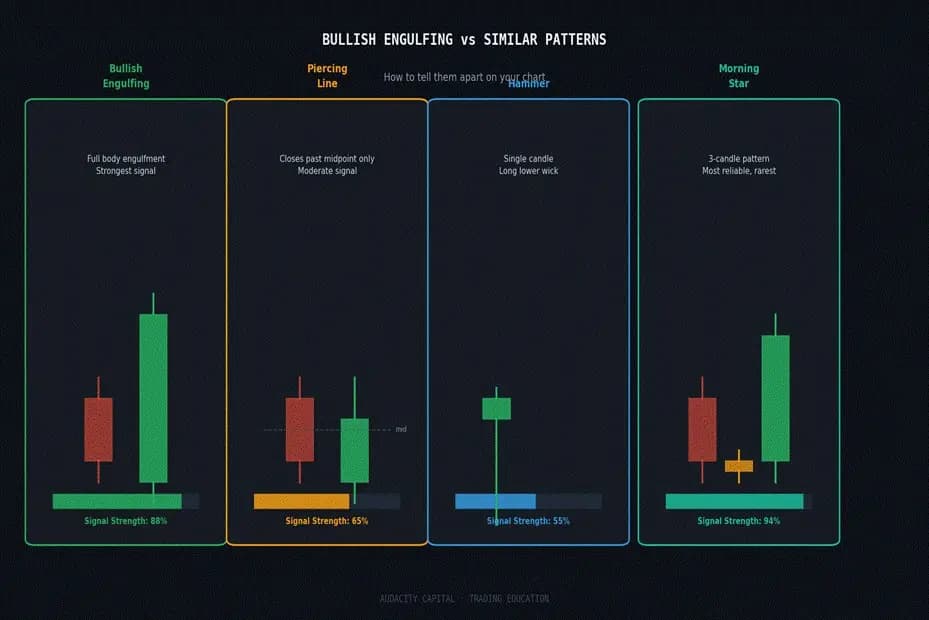
Bullish engulfing vs similar patterns:visual comparison and signal strength
How to Trade the Bullish Engulfing Pattern: Three Practical Strategies
There is more than one valid entry approach. The right one depends on your risk tolerance, trading style, and the market conditions at the time.
Strategy 1: Support Zone Entry
Best for: Swing traders and forex traders on H4 or daily charts
- Wait for price to fall into a known support zone (horizontal level, prior low, or demand zone)
- Look for the bullish engulfing formation to complete at that level
- Enter long at the open of the candle following the engulfing pattern, or at the close of the engulfing candle itself
- Place stop loss below the low of the engulfing candle (plus a small buffer)
- Take profit at the next significant resistance level above
Strategy 2: Moving Average Bounce
Best for: Trend-following traders who want high-probability setups in pullbacks
- In a broader uptrend, price often pulls back to a key moving average (20 EMA, 50 EMA) before resuming higher
- A bullish engulfing pattern forming right at that moving average is a high-probability long entry signal
- This aligns the short-term pattern with the longer-term trend direction, stacking probabilities in your favour
- Stop below the moving average, target the prior swing high or the next resistance level
Strategy 3: RSI Oversold + Bollinger Band Lower Boundary
Best for: Traders who prefer indicator confirmation before entering
- Set up RSI (14) and Bollinger Bands (20 period, 2 standard deviations) on your chart
- Wait for price to reach the lower Bollinger Band AND RSI to be below 30 (oversold)
- If a bullish engulfing pattern forms in that zone, the confluence of three signals makes for a compelling long entry
- Target: 20-period SMA (middle Bollinger Band) or upper band on an extended move
- Stop: just below the low of the engulfing candle
Best Indicators to Confirm the Bullish Engulfing Pattern
Many traders combine the bullish engulfing pattern with technical indicators to improve confirmation quality and reduce false signals.
The most commonly used indicators include:
RSI (Relative Strength Index)
An RSI reading below 30 may indicate oversold conditions, strengthening the probability of a bullish reversal.
Moving Averages
Bullish engulfing patterns forming near the 20 EMA or 50 EMA often align with trend continuation setups.
Volume
Higher trading volume during the engulfing candle suggests stronger buyer participation and institutional interest.
Bollinger Bands
A bullish engulfing pattern near the lower Bollinger Band may signal exhaustion in selling pressure.
MACD Divergence
Bullish divergence on MACD can support the possibility of a momentum reversal.
Entry, Stop Loss, and Take Profit Rules
Every trade built around the bullish engulfing pattern needs defined parameters before you enter. Improvised risk management is how accounts blow.
Trade Parameter | Recommended Approach |
Entry (Aggressive) | Close of the bullish engulfing candle. Higher risk but captures more of the move. |
Entry (Conservative) | Open of the next candle after the pattern is confirmed. Reduces false signal risk. |
Stop Loss | Below the low of the engulfing candle with a buffer (3-5 pips or 0.1-0.2% below the low). |
Take Profit (Target 1) | Nearest significant resistance level above entry. |
Take Profit (Target 2) | Next resistance zone further up, aiming for at least a 1:2 risk-reward ratio. |
Risk Per Trade | Never exceed 1-2% of account capital on a single setup regardless of conviction level. |
Which Timeframes Work Best?
The bullish engulfing pattern appears on every timeframe, but reliability varies significantly across them.
- Daily and Weekly charts: Highest reliability. These timeframes reflect genuine shifts in institutional sentiment and filter out intraday noise. Ideal for swing trading and position trading.
- H4 (4-hour) charts: Strong reliability for intraday swing traders. Widely used in forex, particularly on major pairs during the London and New York sessions.
- H1 (1-hour) charts: Moderate reliability. Patterns appear more frequently but false signals increase. Require stronger confirmation before acting.
- M15 and below: Low reliability. Patterns form constantly and are dominated by noise. Not recommended for trading this pattern in isolation.
For traders managing funded or prop firm accounts, the daily and H4 timeframes offer the best balance of signal frequency and quality. They reduce overtrading risk while still providing actionable setups across the trading week.
Markets Where the Bullish Engulfing Pattern Works
One of the strengths of candlestick patterns is that they apply across all liquid markets.
- Forex: Highly effective on major pairs (EURUSD, GBPUSD, USDJPY) where liquidity is deep and patterns form cleanly. The daily chart on major currency pairs reflects institutional order flow that reinforces candlestick signals.
- Stocks: Effective on individual equities and indices, particularly on the daily chart. Bullish engulfing patterns on S&P 500, FTSE 100, or NASDAQ during broad market pullbacks are among the most reliable.
- Cryptocurrencies: Works on Bitcoin and major altcoins, especially after extended selloffs. Requires additional confirmation given crypto volatility, but the pattern carries weight on the daily chart.
- Commodities: Effective on gold (XAUUSD), silver, and oil. Gold is particularly responsive to bullish engulfing patterns after sharp declines driven by dollar strength or risk-off sentiment shifts.
- Indices: A bullish engulfing on a major index daily chart after a multi-week selloff is one of the highest-conviction reversal signals available to a macro trader.
Common Mistakes Traders Make with This Pattern
Knowing what to avoid is just as valuable as knowing what to look for.
Mistakes to Avoid
Mistake 1: Trading it without context. A bullish engulfing in the middle of a sideways range is much less meaningful than one forming at a clear support level after an extended selloff. Location determines relevance.
Mistake 2: Ignoring the broader trend. A bullish engulfing on a daily chart within a dominant long-term downtrend may produce only a short-lived bounce before the trend continues lower. Always understand which degree of trend you are trading.
Mistake 3: Entering immediately at pattern close. Waiting one candle for confirmation reduces false signals significantly, especially in choppy or low-conviction market conditions.
Mistake 4: Using it on low-liquidity instruments. Patterns on thinly traded assets or during low-liquidity sessions produce unreliable signals due to wide spreads and erratic price movement.
Mistake 5: Setting stops too tight. Placing a stop just one or two pips below the engulfing candle invites premature stop-outs. Always add a reasonable buffer below the low.
Mistake 6: Ignoring volume. A bullish engulfing candle on declining volume lacks conviction. Volume is the footprint of institutional activity. Without it, the pattern is unconfirmed.
When the Bullish Engulfing Pattern Fails
No candlestick pattern wins every time. Understanding why and when this one fails keeps you prepared.
- Strong macro headwinds: If bearish news follows the pattern (rate hike, earnings miss, risk-off shift), sellers can overwhelm the bullish signal entirely.
- Pattern in a strong downtrend: In a powerful bear market, bullish engulfing patterns frequently produce only shallow bounces before the decline resumes. Trend alignment is not optional.
- Weak engulfment: A small engulfing candle that barely overlaps the prior red body is a weak signal. The smaller the margin of engulfment, the higher the failure probability.
- Ranging market: In choppy, sideways price action, reversal patterns are almost meaningless. A directional trend context is a prerequisite for pattern reliability.
- Key resistance directly above: If the pattern forms just below a major resistance zone, sellers may step back in before the rally gains meaningful ground.
Risk Management Note
When the pattern fails, price typically closes back below the low of the engulfing candle. That is your exit signal. A failed bullish signal within a downtrend sometimes resolves into a continuation short, so understanding trend context before entry prevents you from getting trapped twice.
Trading the Bullish Engulfing Pattern on a Funded Account

For traders in prop firm challenges or managing funded accounts, the bullish engulfing pattern fits well into a disciplined, rules-based approach. It provides an objective entry signal with clearly defined risk parameters.
- Defined risk before entry: Because the stop loss is placed below the low of the engulfing candle, maximum risk per trade is known before you enter. This makes position sizing straightforward and eliminates the temptation to move stops after the fact.
- News filter discipline: Avoid entering bullish engulfing setups directly before high-impact news events. A data release can instantly invalidate the technical setup and spike through your stop.
- Selective execution: In a funded account context, not every bullish engulfing pattern warrants a trade. Only setups with strong confluence (support zone + volume + indicator signal) meet the bar for execution.
- Journal every setup: Log each trade with entry rationale, pattern quality score, and outcome. Over time this builds the statistical picture of how the pattern performs in your specific markets and sessions.
- Protect your drawdown: In Audacity Capital's Ability Challenge, the daily drawdown limit is 7.5% of balance or equity. Sizing your bullish engulfing trades at 1-2% risk keeps multiple losing trades from threatening your evaluation progress.
Audacity Capital Note
At Audacity Capital, we fund traders who combine technical skill with disciplined risk management. The bullish engulfing pattern, applied correctly at support with volume confirmation, is exactly the kind of structured, repeatable setup that funded traders use to grow accounts consistently.
Bullish Engulfing Pattern: Quick Reference Summary
Feature | Requirement | Notes |
Pattern type | Two-candle reversal | Appears after a downtrend |
Candle 1 | Bearish (red/black) | Part of the preceding downtrend |
Candle 2 | Bullish (green/white) | Body fully engulfs Candle 1 body |
Opening of Candle 2 | At or below C1 close | Gap down is common |
Closing of Candle 2 | Above C1 open | Close near high is strongest |
Volume | Higher on Candle 2 | Confirms buyer conviction |
Best timeframe | Daily / H4 | Reduces noise, higher reliability |
Best location | At support or prior low | Confluence improves probability |
Stop loss | Below low of Candle 2 | Add buffer for whipsaw |
Confirmation | Candle 3 or indicator signal | Reduces false signal risk |
Win rate (daily TF) | ~53% (baseline) | Rises with confluence factors |
Key Takeaways
Before you close this guide, here is everything distilled into the principles that matter most.
The pattern requires a downtrend. A bullish engulfing candle in a sideways market is noise. The same pattern at a key support level
Two candles tell the complete story. Day one: sellers in control. Day two: buyers step in, absorb all selling pressure, and close above the prior candle's open. This visible transfer of power is the entire premise of the pattern.l after an extended selloff is a high-probability signal. Context is not optional.
This is a reversal signal, not a trend tool. The bullish engulfing pattern flags a potential end to a downtrend. It is not a trend-continuation tool. Trading it against a dominant downtrend reduces its effectiveness significantly.
Wait for confirmation where possible. The aggressive entry is at the close of the engulfing candle. The conservative entry is at the open of the next candle. One extra session of patience reduces false signals significantly.
Final Thoughts: The Bullish Engulfing Pattern and the Disciplined Trader
The bullish engulfing candlestick pattern is one of the clearest signals of a potential trend reversal that technical analysis offers. In two candles it shows sellers losing control and buyers stepping in decisively. When this happens at the right location, with volume behind it, and after an extended move, the pattern becomes a high-confidence long signal.
But it rewards patience and selectivity, not excitement. Traders who use this pattern profitably are not entering every green candle that slightly overlaps the prior red one. They are waiting for quality, confirming the context, and sizing their trades so that no single loss threatens their account or their evaluation.
That discipline, applied consistently, is what separates traders who grow accounts from those who grind through drawdowns without ever building an edge.
Learn, practice, and apply your trading strategy in Audacity Capital's free monthly trading competition.
Frequently Asked Questions (FAQ)
These are the questions traders search most when researching the bullish engulfing pattern.
A bullish engulfing pattern is a two-candle formation that signals a potential reversal from a downtrend to an uptrend. The first candle is bearish (red/black). The second candle is bullish (green/white) and its body completely covers the body of the first candle, showing that buyers have overwhelmed sellers. It is most reliable when it forms at a support level after a sustained price decline.
Yes, but reliability varies. The daily and four-hour timeframes offer the most reliable signals because they filter out noise and reflect institutional activity. On lower timeframes such as M15 and below, the pattern appears frequently but generates many false signals. Traders using lower timeframes should require strong confirmation from at least two additional signals before acting.
On the daily timeframe, research puts the baseline win rate at approximately 53%. Reliability rises significantly when the pattern is combined with other signals such as oversold RSI, a key support zone, or a volume spike on the engulfing candle. Isolated patterns without confluence have lower win rates and should be treated with caution.
No. The standard definition requires only the real bodies to engulf. The second candle's open must be at or below the first candle's close, and the second candle's close must be above the first candle's open. If the wicks are also engulfed that is a stronger version of the signal, but it is not required for the pattern to be valid.
Both are two-candle bullish reversal patterns, but the second candle in a piercing line only closes past the midpoint of the first candle's body, not fully above the first candle's open. A bullish engulfing requires the second candle to close above the first candle's open entirely. The bullish engulfing is therefore a stronger signal with higher conviction.
Yes, but reliability varies. The daily and four-hour timeframes offer the most reliable signals because they filter out noise and reflect institutional activity. On lower timeframes such as M15 and below, the pattern appears frequently but generates many false signals. Traders using lower timeframes should require strong confirmation from at least two additional signals before acting.
Your stop loss should be placed below the low of the bullish engulfing candle. Add a small buffer of a few pips or a small percentage below the low to reduce the risk of being stopped out by a wick before the price moves in your favour. Never place the stop above the pattern — that would put you on the wrong side of the trade entirely.
Yes, and it is widely used by forex traders. Major pairs such as EURUSD, GBPUSD, and USDJPY produce clean bullish engulfing setups due to their deep liquidity and strong institutional participation. The pattern is especially effective on the daily and four-hour charts when it forms at key support levels or after extended sell-offs during high-liquidity sessions.
A failed bullish engulfing occurs when the price does not rally after the pattern forms and instead closes back below the low of the engulfing candle. This is your signal to exit and reassess. In a dominant downtrend, a failed bullish engulfing can confirm bearish continuation, so understanding the broader trend context is critical before entering.
It can be used in day trading on H1 or H4 charts, but it is less suited to M15 or below where false signals are very frequent. Day traders using this pattern should always require confirmation from at least one additional technical signal (volume, support level, or indicator reading) before entering, and should avoid trading it in low-liquidity sessions.
Pronto para aplicar risco disciplinado em cripto? Explore os novos instrumentos de cripto da Audacity Capital e traga sua estratégia de trading.
Saiba MaisNewsletter
Junte-se ao nosso boletim para ficar atualizado.
Junte-se à Nossa Comunidade Social
Comece Sua Jornada Hoje Com Nosso Teste Gratuito
Mostre com orgulho suas habilidades e conquistas através de certificados e obtenha reconhecimento pelo seu trabalho árduo e dedicação de potenciais investidores e colegas.
Teste GratuitoArtigos Relacionados
Best RSI Settings for the 1-Minute Nasdaq 100 Chart
No single setting prints money on this fast, noisy index. Here's the best RSI for 1-minute chart Nasdaq 100 scalping, the filters it needs, and the real risks.
10 Best EAs to Pass Prop Firm Challenges in 2026
An honest, vetted look at the best EAs for a prop firm challenge in 2026. Strategy-grouped picks, banned-strategy warnings, firm rules, and a real setup and verification framework. No pass-rate hype.

Prop Firm Hedging Explained: What Is Allowed and What Gets You Banned?
Prop firm hedging means four different things. See which types are allowed, why the multi-account "guaranteed pass" is banned, and how to hedge legitimately.

Range Trading Strategy: The 10 Best Range Trading Strategies in 2026
Discover the 10 best range trading strategies for forex, stocks, and indices. Learn how to identify ranging markets, manage risk, and trade support and resistance successfully.