


What Is POC in Trading? Point of Control Explained


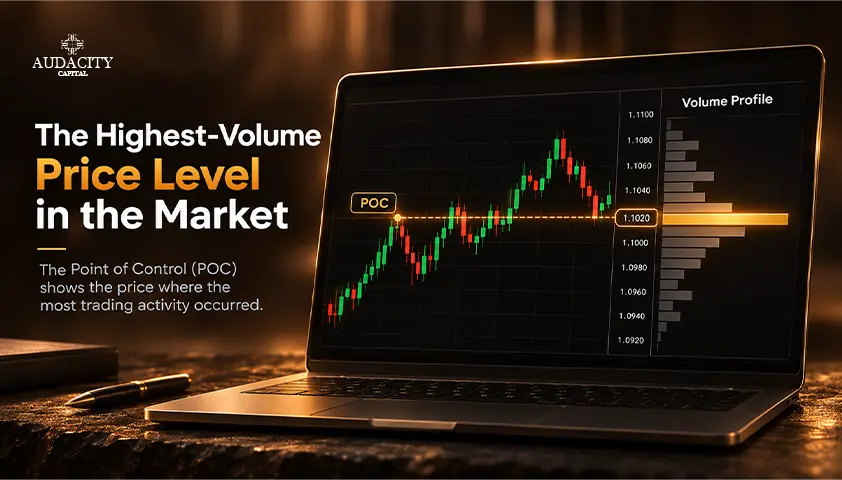
POC stands for Point of Control. It is the price level or profile row where the highest volume traded in the selected time frame in the Volume Profile.
Traders focus on POC since it shows the price levels with the highest past activity and will be a guide on price action if price reaches this level again.
In this article we will discuss how is POC calculated, what is the difference between developing and naked POC, when can we use VAH, VAL and Market Profile and what is the importance of it when using it in Forex charts.
What Does POC Mean in Trading?
The normal volume bars show the trade volume during the particular period of trading. Volume Profile reorganises that same activity according to the price level.
POC is not the amount of trades made within an hour, but it reflects the amount of trades made on each price level. It makes a histogram in the chart horizontally and the longest one is known as Point of Control.
The longest row represents:
- price where most transactions took place
- major historically active zone
- a price level worth considering if price returns
POC is often referred to as 'the area of acceptance', as a lot of transactions have been done at this price level. POC of trades is a historical metric, not a predictive one.
There are two things to consider regarding POC. First of all, POC is not the ‘fair value' of the asset. It just shows the price level at which most of the transactions have taken place in a certain profile.
Second, at this level, the POC does not indicate if the buyers or sellers have won or lost. Each transaction has two parties, so the volume of transactions indicates activity, not who was more powerful.
How Is Point of Control Calculated?
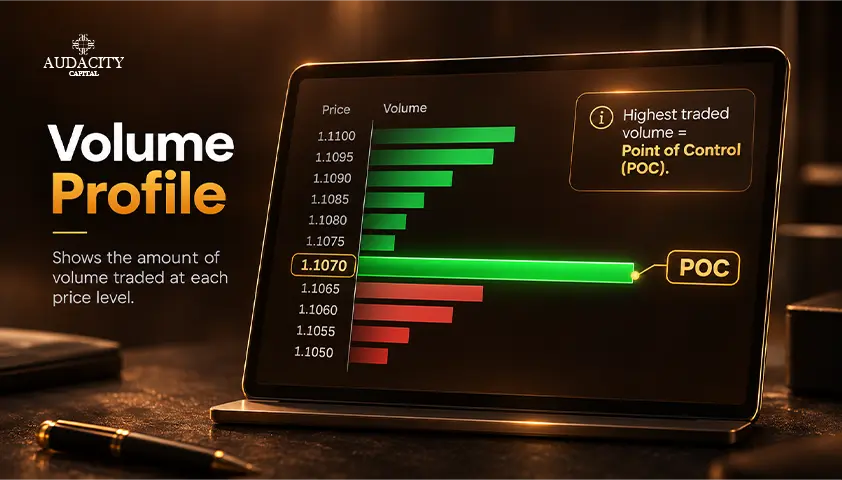
The mechanics are very simple and most charting platforms will automatically process this with the POC indicator that is in their Volume Profile tools. Conceptually, the process is as follows:
- Select the session, period or a user-defined session interval.
- Divide the price interval into rows or bins.
- Calculate the amount of volume that was traded in each row.
- Compare the volumes in each line.
- Record the row with the biggest volume as POC.
Let's take a hypothetical scenario:
Price | Traded Volume |
100 | 8,500 |
101 | 12,300 |
102 | 18,700 |
103 | 14,100 |
104 | 7,900 |
In this case, the POC will be 102 since more volume was traded in it than in any other price row.
Why Two Platforms Can Show Different POCs
When you're looking at the same market on two platforms, it's normal to see a slight difference in the POC. The reasons can be:
- profile range
- session type
- row or bin size
- trading data provider
- other options in profile calculations
Platforms like GoCharting and Quantower highlight the significance of profile configuration. A POC has significance only in the context of the parameters in which it is calculated.
What Does POC Tell You About the Market?
Using the POC in the right way involves viewing it as an area in which there has been some past activity. The trader will pose questions such as:
- Where has the selected session or range made the most of its volume?
- Where have there been substantial two-way trades?
- If the market comes back, where could price interaction get more focus?
So what is POC in trading if it isn't a signal? It is a reference point, and there are three situations that describe how POC is viewed.
Price Trades Around the POC
Any further price action at that level will mean that the market continues to accept that level.
Price Moves Away From the POC
This shows that the market might be building activity at another level, forgetting about previous concentration.
Price Returns to a Previous POC
Previous concentration makes the level significant, but it depends on the current price action whether it acts as support, resistance, balance or is just being traded through.
The presence of the level does not mean anything about the coming reversal. What really counts is the price action when price hits that level.
Developing POC, Previous POC and Naked POC Explained
In traders' charts there are several terms for POC. They define specific stages in the development of the same concept.
Developing POC (dPOC)
The developing POC is the POC of the profile or session that is developing. With the emergence of a new volume, it can change within the session. For example in Quantower, you'll have different levels that indicate where the levels are formed compared to the previous sessions.
Previous or Completed POC
Once the profile or session has been selected, its POC will not be changed for that specific profile. Traders have this level in their charts to refer to during future sessions.
Naked POC
The naked POC is the previous POC of the complete profile which was not tested since. This is the level to pay attention to because it shows an important historical volume concentration which has not been tested yet.
Some internet sources tend to make a fuss about this concept. The naked POC isn't always strictly required to be considered, and there isn't a specific amount of sessions in which price should go back to it. It's just something to keep an eye on.
POC Migration
If the developing POC keeps migrating either upwards or downwards, the region of maximum volume concentration migrates as well. Think of this as data regarding the development of the distribution, rather than as a bullish or bearish indicator.
How Traders Interpret Price Around the POC
The way traders view price action around the POC is based on behavior analysis, not on any definite rules. There are three possible scenarios that occur frequently.
1. Price Rejects the POC
Price tries to test the region but does not stay there and pulls away from it. The POC may rely on the price level as a reference point, but the rejection is relevant because of price action, not because of the price level itself.
2. Price Accepts Around the POC
Price remains near the level and trades around it. This may indicate balance and/or acceptance of that price. Touch does not count; what counts is time period spent and repeated trading around the level.
3. Price Moves Through the POC and Builds Activity Elsewhere
The earlier point of control would no longer matter if the market begins to create new volume concentration at another price. This new POC may shift closer to this region and the old price becomes a historical fact.
POC vs VAH, VAL and VWAP
There are certain terms in Volume Profile and volume-based charts that should not be confused.
Reference | What It Represents |
POC | The price line with the largest trade volume in the profile |
VAH | Upper border of the Value Area |
VAL | Lower border of the Value Area |
Volume weighted average price for the specified period/session |
Typically, the Value Area comprises about 70% of the profile volume, but sometimes the platforms give a possibility to adjust the figure or method of its computation.
The POC is normally located inside the value area and shows us one price row whereas VAH and VAL show us its borders.
Both VWAP and POC might be totally different prices particularly on the directional session when the price action takes place in one area and the average price forms somewhere else.
Volume POC vs Market Profile POC
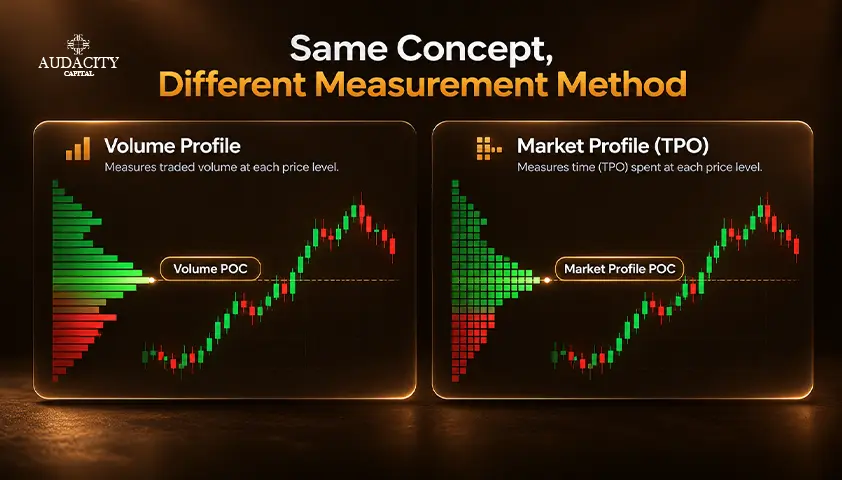
Point of Control in trading is used by both Volume Profile and Market Profile, but calculations are different.
Volume Profile POC | Market Profile / TPO POC | |
Input | Executed volume | Time Price Opportunities |
POC represents | Price row with highest traded volume | Price row with greatest TPO count |
Main question | Where did most volume trade? | Where did the price spend the most configured time? |
According to the Volume Profile manual on Audacity website, POC stands for highest executed volume.
In our Market Profile manual, POC is a price row with a maximum number of TPOs. These price levels can be similar, but they are not the same.
Volume Profile POC answers the question about participation, whereas the Time Price Opportunities POC answers the question about time spent at a certain price level.
And there is one more concept which should be distinguished. Bar POC on footprint chart is a price row within one bar having the maximum volume. But this is not the POC for the entire profile or for the entire session.
Can You Use POC in Forex Trading?
Certainly, traders have to be aware of the volume that is used in their forex trading platform.
Exchange markets like futures operate through the centralised and reported traded volume of the exchange. The spot forex market is decentralised and there is no world exchange which reports every transaction for EUR/USD, GBP/USD and USD/JPY. Forex platforms use:
- there is tick volume
- there is broker volume
- there is liquidity provider data
- and another proprietary feed
This implies that the price level revealed by the POC in any spot-forex trading platform cannot automatically be taken as the most traded price level for that pair.
The POC only reveals the price level based on the information available in the platform and feed. This does not make forex POC useless. It changes the way it should be interpreted. Treat it as the level that you consistently apply in your trading charts.
Common POC Trading Mistakes
The common mistake traders make while trading using POC happens when the level reference tool is considered a complete trading system. Here are a few misunderstandings that you need to avoid.
- Considering all POC touches as trade opportunities. The price level is determined by POC but it doesn’t provide an automatic entry trigger.
- Assuming the price level must go back to the POC. POC and naked POC can remain untested for a long time. Hence you should never use “magnet” for describing this.
- Thinking that the POC level is a permanent support or resistance. Interpretation of the level depends on the market reaction after the price level retests this level.
- Utilizing too many POCs. Daily, weekly, composite, and custom profiles give a different level of POC. Highlighting all of them reduces the significance of using POC.
- Overlooking the importance of profile settings. Changing session, range, row size, or data feed will result in changing the POC level calculated.
- Confusion between Volume POC and TPO POC. These are two distinct measures, not the same indicator.
- Thinking that high volume indicates the direction of movement. The POC denotes the concentrated trading activity; it doesn’t tell you if buyers or sellers will dictate the next action.
POC Is a Reference Level, Not a Prediction
With the POC, you will know the precise answer to one historical question: at which point was there the maximum concentration of trading activity in a particular profile? Thus, POC becomes a good indicator for monitoring acceptance, rejection or change in volume distribution.
POC does not predict whether the price will go up, down, reverse or return. The value of POC consists in its use together with a properly identified profile and monitoring of how the market behaves with respect to this reference point.
This article is for educational purposes only and is not investment, financial or tax advice. Trading involves risk, and no chart level guarantees any outcome.
Frequently Asked Questions
The usual volume profile will show only one POC depending on the calculation algorithm of the particular platform. In case there are two price rows with equal volume peaks, the platform will apply its own tie-breaking rule. Moreover, changing settings may result in obtaining different POCs on the same market period.
Yes. Daily, weekly, and custom-range profiles calculate volume for different trading periods and therefore will result in different POCs. The POC only has meaning relative to the profile used to calculate it.
No. The POC is the sole price row with the highest-volume in the chosen profile. A High Volume Node (HVN) means some area with relatively high volume and might include more than one price row. POC can be located within the High Volume Node but the two terms should not be used interchangeably.

Pronto para aplicar risco disciplinado em cripto? Explore os novos instrumentos de cripto da Audacity Capital e traga sua estratégia de trading.
Saiba MaisNewsletter
Junte-se ao nosso boletim para ficar atualizado.
Junte-se à Nossa Comunidade Social

Comece Sua Jornada Hoje Com Nosso Teste Gratuito
Mostre com orgulho suas habilidades e conquistas através de certificados e obtenha reconhecimento pelo seu trabalho árduo e dedicação de potenciais investidores e colegas.
Teste GratuitoArtigos Relacionados
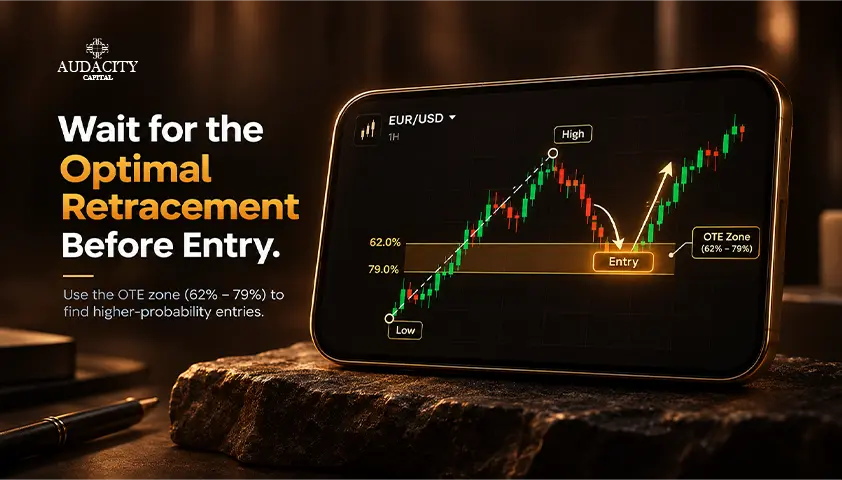
ICT Optimal Trade Entry (OTE): Explained
Learn how ICT Optimal Trade Entry works, including the 62%–79% Fibonacci zone, 70.5% level, bullish and bearish OTE setups, entries and risks.

What Is Full Porting in Trading?
Learn what full porting in trading means, how traders use maximum buying power, the risks of going all-in, and how to manage trading risk.
What Is the Slow Stochastic Oscillator? Formula, Signals and Strategies
Learn how the Slow Stochastic Oscillator works, understand its formula and signals, and explore trading strategies and risk management.
NQ in Trading – What is NQ in Trading?
Learn what NQ means in trading, how E-mini Nasdaq-100 futures work, their contract specifications, trading hours, strategies and risks.