


Market Profile Trading: How to Read TPO Charts


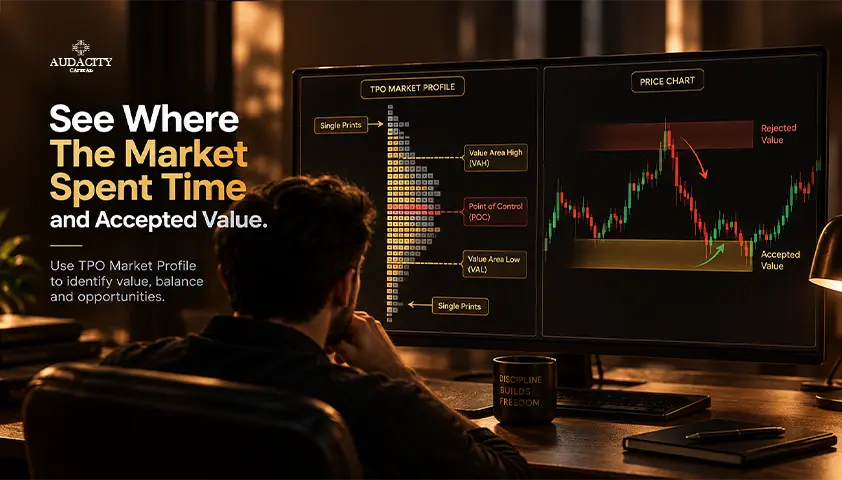
A candlestick chart shows how price moved through time. A Market Profile turns that view sideways and reorganizes the session around a different question: where did price spend its time?
That shift can help you see acceptance, rejection and session structure more clearly, but it does not produce automatic buy or sell signals.
This guide on Market Profile Trading covers the Time Price Opportunity definition, the key levels, a chart-reading workflow, and a direct comparison with Volume Profile.
What Is Market Profile Trading
Market Profile Trading is the use of a Time Price Opportunity (TPO) chart to organize prices by the time brackets that are traded at each level.
Each letter or block on a TPO chart marks one subperiod, commonly 30 minutes, during which that price was touched. Stack the marks at every price row, and the session becomes a horizontal distribution instead of a sequence of bars.
The idea comes from auction market theory.
Markets move to find prices where buyers and sellers are willing to keep trading. When price keeps returning to the same rows, the profile widens, and traders often read that as price acceptance.
When price moves quickly through an area, it leaves thin sections, single prints or tails, which can indicate fast movement or price rejection.
These are descriptive interpretations. A wide row does not tell you who traded, and a thin row does not forecast the next move.
Market Profile was developed by J. Peter Steidlmayer at the Chicago Board of Trade in the 1980s, and Market Profile® is a registered trademark of the CBOT.
How a TPO Market Profile Is Built
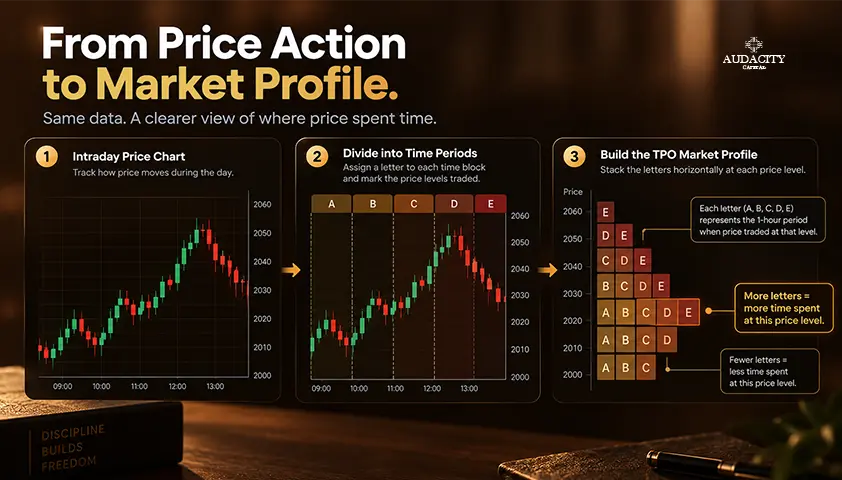
A TPO market profile is built one subperiod at a time. Here is the sequence for a single session.
A. Building the Profile Step by Step
- Choose the session. Define the start and end time of the profile period.
- Divide it into subperiods. A 30-minute bracket is common, but it is not mandatory.
- Assign each subperiod a label. The first bracket is usually A, the second B, and so on.
- Mark every price row visited. If price trades through a row during bracket A, that row gets an A.
- Collapse the marks. Push the letters toward the left edge, and the distribution appears.
B. Settings That Change the Chart
Two traders can see different levels on the same market if their settings differ. Before you trust any level, confirm these settings:
- Profile period: daily, weekly or a custom range
- Session template: which hours count as the session
- Time zone: the clock used to start and end each bracket
- Bracket duration: the length of each TPO subperiod
- Price-row size or tick grouping: how many ticks each row contains
- Value-area percentage: often 70 percent, but configurable
- Extended hours: included or excluded
C. Developing Versus Completed Profiles
While the session is open, the developing POC, value area and shape can all change. A chart of the completed session contains information that was not available earlier in the day.
In your own examples and backtests, describe only the levels you could have known at the decision time.
Key Market Profile Levels and Terms
Use the table below as a quick reference. Every definition here is based on TPO activity, not traded volume.
Term | Meaning | Practical use | Important limit |
TPO | A letter or block showing that a configured price row traded during one subperiod. | Builds the time-at-price distribution. | Its size depends on bracket and row settings. |
POC | The price row with the greatest TPO count for the profile. | A reference for where the session spent the most time. | A developing POC can move before the session ends. |
VAH and VAL | The upper and lower boundaries of the configured TPO value area, commonly 70 percent. | Frame the central area of time-price activity. | The percentage and calculation method can vary. |
Initial balance | The range of the first chosen subperiods, traditionally two 30-minute brackets. | Provides an early-session range and later range-extension context. | The first hour is a convention, not a universal rule. |
Single prints | Price rows containing one TPO in part of the profile. | Highlight fast auction movement or low time acceptance. | They do not have to be revisited or filled. |
Tails or excess | A taper of relatively few TPOs at a profile extreme. | May support a rejection interpretation. | It does not identify who traded or guarantee reversal. |
Before the next session opens, mark the completed prior-session high, low, POC, value area high (VAH) and value area low (VAL) as fixed lines.
These are known references. Keep them separate from the developing levels of the current session so that you always know which information was available when.
Some platforms apply their own tie-breaking rules when two rows share the highest count, and they expand the value area in slightly different ways. Treat any single algorithm as one method, not the standard.
Market Profile vs Volume Profile
Market Profile counts time-price opportunities, while Volume Profile groups traded volume by price. Both can display a POC and value area, but the levels can differ because they measure different inputs.
Feature | Market Profile | Volume Profile |
Primary input | Time brackets that traded at each price | Executed volume at each price |
Common display | TPO letters or blocks | Horizontal volume histogram |
POC meaning | Price row with the most TPO activity | Price row with the most traded volume |
Main question | Where did the market spend time? | Where did the market transact the most volume? |
Data consideration | Strongly affected by session and bracket settings | Affected by feed coverage and volume data quality |
A few related tools answer other questions. Candlesticks show price over time. Footprint charts show executed bids and ask details inside a bar. The depth of market (DOM) shows displayed resting liquidity. None of these tools is a substitute for the others.
How to Read Market Profile Day Types and Shapes
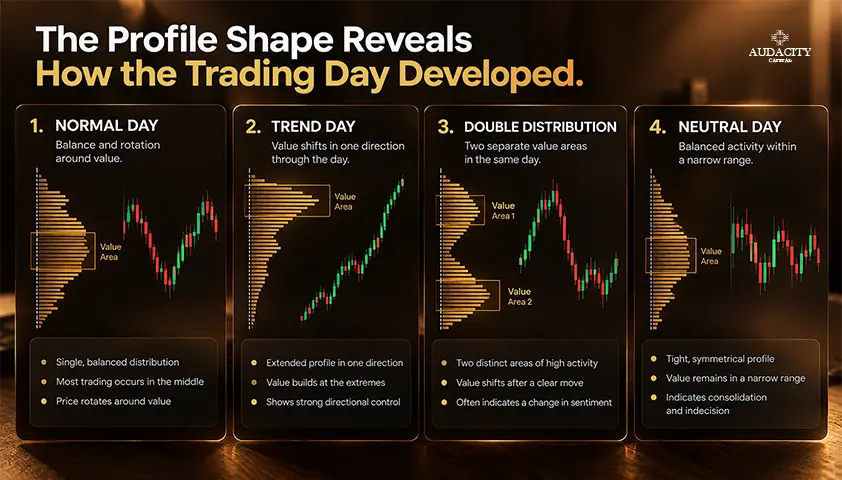
Market profile day types describe how the session developed relative to its initial balance. Naming rules vary by educator and platform, so treat these as a common framework rather than fixed definitions.
Commonly Taught Day Types
- Normal day: A wide initial balance forms early, and price makes little or no range extension beyond it.
- Normal variation day: Price extends beyond the initial balance in one direction, widening the range more than a normal day but without a sustained trend.
- Trend day: A narrow initial balance is followed by persistent range extension in one direction, producing a long, thin profile.
- Neutral day: Price extends beyond both sides of the initial balance, then settles near the middle or one extreme.
- Non-trend day: A narrow range with little extension and limited development on either side.
- Double-distribution trend day: Price builds one distribution, breaks away, then builds a second distribution, often leaving a thin zone between them.
Profile Shapes as Visual Shorthand
A D shape is broadly balanced, with the widest rows near the middle. P and b shapes are asymmetrical, with the bulk of activity in the upper or lower part of the range. A B shape often describes two areas of activity separated by a thinner zone. None of these letters carries a fixed bullish or bearish forecast.
Single Prints and Excess
Single prints, thin zones and tails can support a story of rapid movement or rejection. That story still needs confirmation from subsequent price action. Single prints do not have to fill, weak highs or lows do not have to be revisited, and a shape cannot reveal which group of participants is in control.
Read From Context to Detail
Work in this order: prior-session location, opening location, initial balance, range extension, developing value, then shape. Day type is often clearer late in the session, so never treat a final label as if you knew it at the open.
How to Use Market Profile in a Trade Plan
A market profile trading strategy begins with structure, not with an entry. Use this six-step process:
- Define the session and settings. Keep them unchanged while you test.
- Mark the completed prior-session references. High, low, POC, VAH and VAL.
- Classify the open. Is price inside prior value, outside value but inside the prior range, or outside the prior range?
- Watch for acceptance or rejection at a planned level. Acceptance means price builds time there. Rejection means it fails to.
- Define entry, invalidation and target before placing the order.
- Size the position from the planned loss and the stop distance.
Balanced-Session Idea
Value area trading in a balanced session may involve a rotation back through value. Consider it only after price rejects a value-area edge and returns inside value. The POC can act as a reference target, but it is not a guaranteed magnet. Sustained acceptance beyond the edge cancels the idea.
Directional-Session Idea
A continuation idea may apply when price accepts beyond a known range and builds time outside value. This still needs a separate trigger and a structural invalidation. One TPO printing outside the range is not a reason to enter.
Execution
State the order type for every plan: market, limit or stop. Actual fills can differ from planned prices because of spread, liquidity, slippage or gaps. The profile supplies context. Your risk and execution rules complete the plan.
Market Profile Across Futures, Stocks, Forex and Crypto
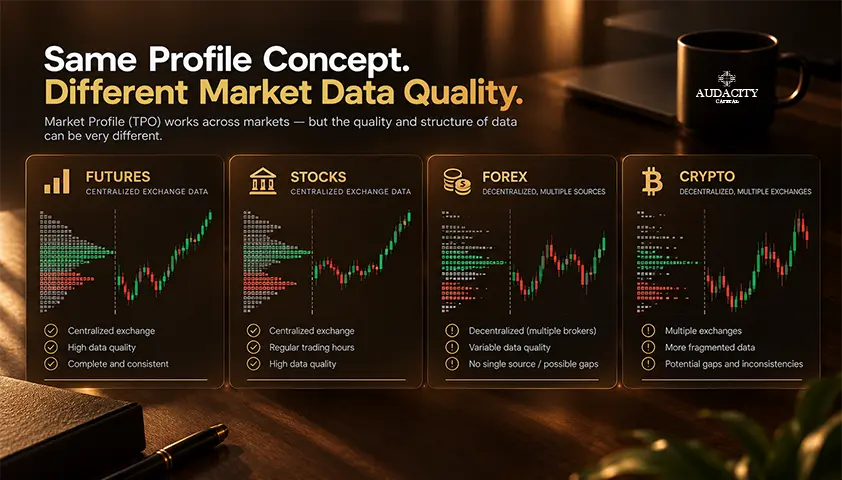
Futures
Futures are the clearest teaching example because they have defined sessions. Decide whether your profile covers the primary session, the overnight session or both. Each template produces a different structure.
Stocks
State whether you include regular or extended hours. A premarket profile combined with the main session is not directly comparable with a regular-hours-only profile.
Spot Forex and CFDs
A TPO chart uses price and time, so it does not require centralized traded volume. However, session boundaries, broker price feeds and time zones differ. One broker's profile is not a universal market profile.
Crypto
Name the exchange and set a repeatable 24-hour boundary, such as a chosen UTC reset. Changing the venue or the session cut can change the chart. Continuous trading still needs a session definition.
Common Market Profile Trading Mistakes and Risks
1. Frequent Mistakes
- Confusing TPO activity with traded volume
- Treating VAH or VAL as automatic support or resistance
- Calling a day type too early in the session
- Changing settings until the profile fits the story you want
- Assuming single prints must fill
- Using final-session levels with hindsight
2. Overfitting
The number of shapes, open types and day-type labels can create false precision. Start with a small rule set. Test one instrument, one session and one group of settings before expanding. Record losing and skipped trades in your journal, not only the winners.
3. Data and Platform Risk
Check the time zone, daylight-saving changes, session holidays, missing intraday data, price-row grouping and value-area method. A chart can look precise and still be built on inconsistent settings or incomplete data.
4. Trading Risk
Define the invalidation before entry, and size the position from the stop distance and planned loss. Market Profile does not remove gap, leverage, slippage, liquidity or news risk. If a setup has no clear invalidation, skip it.
Conclusion
A TPO profile organizes where price spent time, while you supply the setup, trigger, invalidation and risk limit. To build real familiarity, replay twenty sessions with unchanged settings and record how price behaved around prior value, the POC and the initial balance.
Frequently Asked Questions
TPO stands for Time Price Opportunity. One TPO records that a configured price row traded during one configured subperiod. The letters simply label the periods, so A marks the first bracket, B the second, and so on. A 30-minute bracket is common, but you can adjust it.
No. Market Profile counts TPO activity, which represents time brackets at each price. Volume Profile counts executed volume at each price. The two may show similar shapes, POCs and value areas on the same session, but their levels can differ because they are built from different inputs.
There is no universal best setting. A daily profile with 30-minute TPO brackets is a common starting point, but the session, instrument and your decision horizon all matter. Keep settings consistent and test them thoroughly before changing bracket size or session boundaries.
TPO profiles can be built for both because they use price and time rather than centralized volume. The chart still depends on the broker or exchange feed, the time zone and the session reset you choose. The profile provides analytical context, not proof of a profitable strategy.

Ready to apply disciplined risk to crypto? Explore Audacity Capital's new crypto instruments and bring your trading strategy.
Learn MoreNewsletter
Join our newsletter to stay up to date on features and releases.
Join Our Social & Community

Start Your Journey Today With Our Free Trial
Proudly showcase your skills and accomplishments through certificates and get recognition for your hard work and dedication from potential investors and peers.
Free TrialRelated Articles
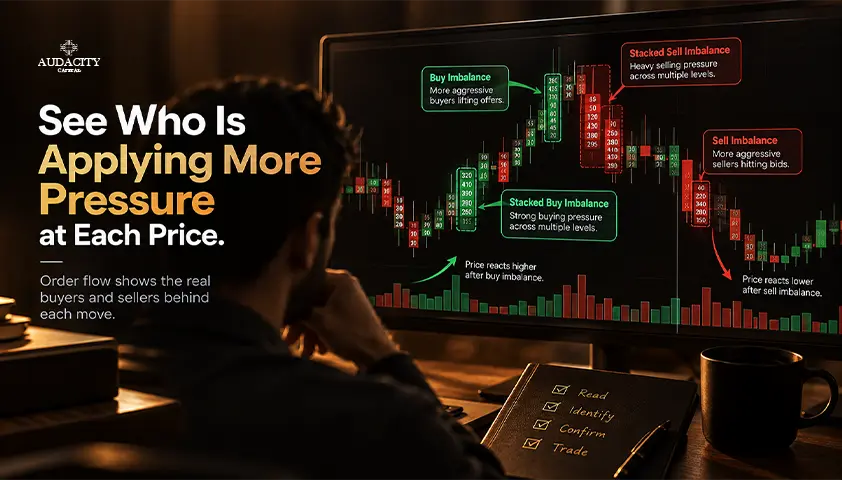
Order Flow Imbalance: How to Read Buy and Sell Pressure
Learn what order flow imbalance means, how footprint and order book readings differ, and how traders assess buy and sell pressure with context.

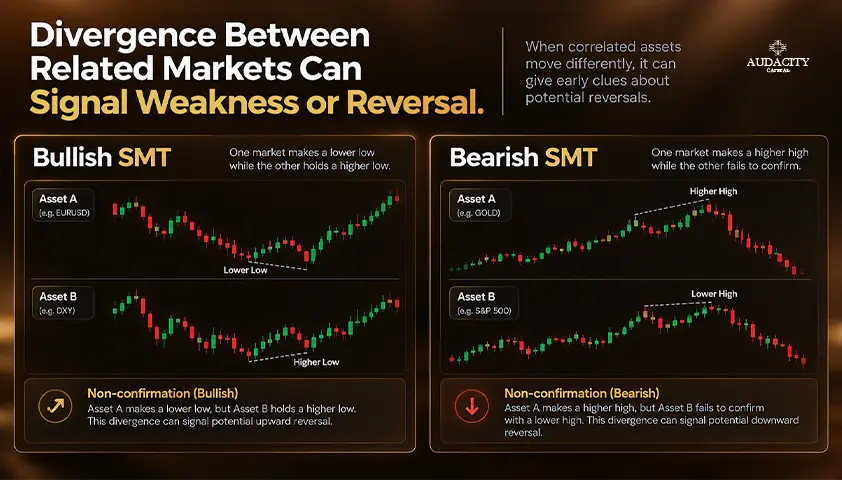
SMT Divergence in Trading: Bullish and Bearish Examples
Learn what SMT divergence means, how bullish and bearish setups form, which markets traders compare, and how to confirm signals and manage risk.
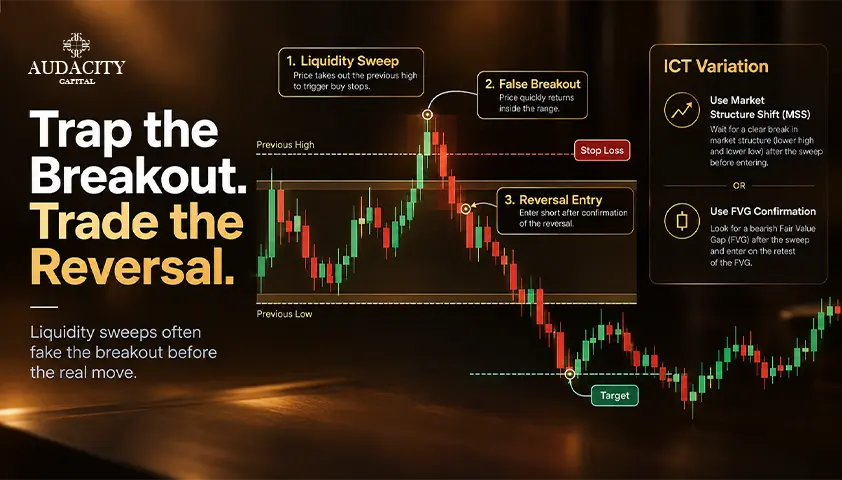
Turtle Soup Trading: Rules, Examples and ICT Variations
Learn turtle soup trading with original rules, ICT variations, bullish and bearish examples, risk controls, and a practical backtesting checklist.
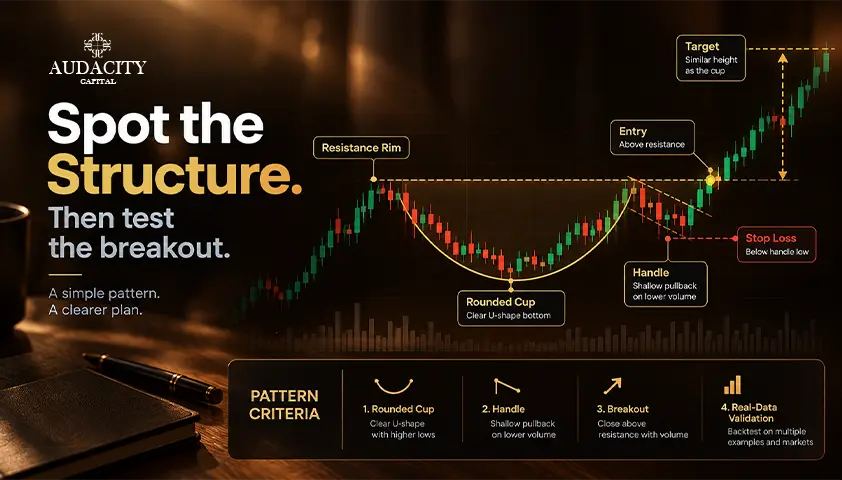
Cup and Handle Pattern: Criteria, Entry and Real Data
The cup and handle pattern explained: the criteria sources disagree on, how to trade it, and what the performance data actually says.