


Depth of Market (DOM) Explained: How to Read Market Liquidity


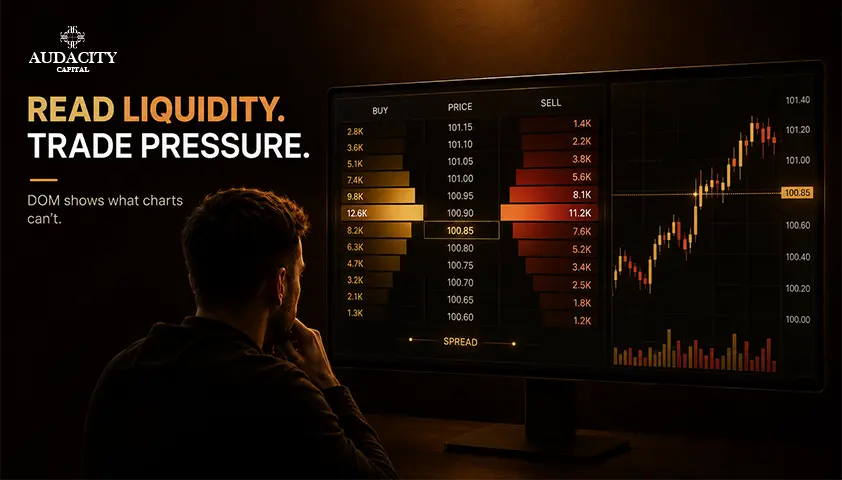
Depth of Market is a visual snapshot of the visible buy and sell limit orders resting on various prices around the current market.
It shows where displayed liquidity sits, how it is distributed across price, and how it changes as the market approaches a level.
This is why traders with active trades keep their ladders open.
Displayed trading interest can help traders plan their entries and estimate execution costs. It can also be used to gauge whether a level has any liquidity behind it.
In this guide, we will go through how to read the ladder, how to judge liquidity properly, and common misinterpretations which lead to bad trade decisions.
What Is Depth of Market (DOM)?
Depth of Market, market depth, and the order book are different terms used to refer to the same thing. In the ladder, you find the resting buy limits on the bid side and the resting sell limits on the ask side. Each row represents a price and the total displayed size at that price.
The word "resting" is important. These are limit orders that are waiting to trade. These are not finished orders, and may be amended, moved or cancelled by the traders at any time before they are executed. This is why the DOM is a snapshot of intent, and not a record of what's happened.
The top row of each side of the ladder is what traders refer to as the best bid and the ask, otherwise called the inside market. Other prices outside the inside market represent visible liquidity only available if the price moves there.
This is covered in a simple annotated ladder:
PRICE BID SIZE | ASK SIZE
100.05 | 180
100.04 | 240
100.03 | 95 <- Best Ask
-------------------- SPREAD ---------------------
100.02 120 | <- Best Bid
100.01 310 |
100.00 640 |
99.99 155 |
Anatomy of a DOM: Price, Bid, Ask and Order Size
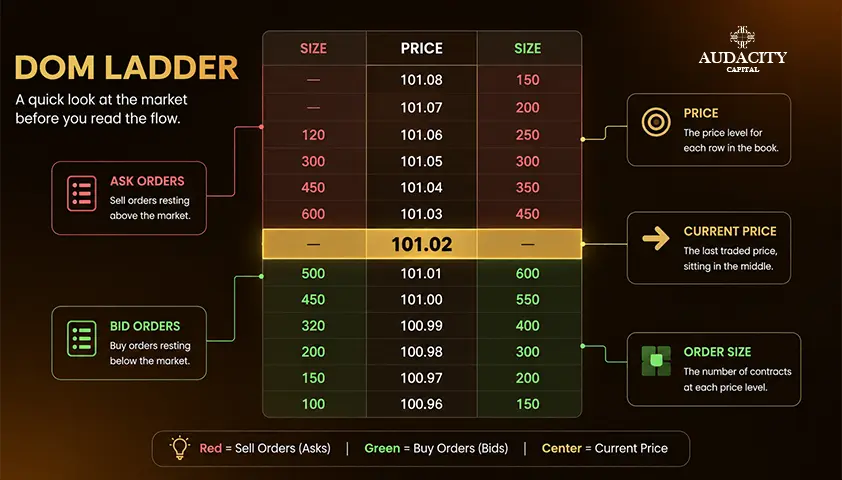
First decode one ladder before moving onto interpreting one. Most crucial is the price column. The bid size will give information on all displayed buy orders for levels below the inside market. The ask size will tell about all displayed sell orders for levels above the inside market.
The difference between the best bid and the best ask is called bid ask spread. Narrower spread means higher liquidity which means that both entry and exit costs become low. Wider spread causes high execution cost and slippage especially during news and large sizes.
In addition to actual numbers, important is the shape in which size is distributed. It is not just the highest number that the trader is seeking. It is the size distribution shape around nearby prices and whether it is getting thicker or thinner.
As it is seen from the DOM ladder above, it is the 640 at the 100.00 level that draws the attention, but what is important to pay attention to is whether the number will stay the same as the price is approaching.
What DOM Tells You About Market Liquidity
More orders do not necessarily mean more liquidity. DOM shows just one of many aspects of liquidity: the depth of resting orders at different prices. In addition to it, traders analyze the bid ask spread, traded volumes, price impact and the speed at which quotes are refilled after they are consumed.
The studies outlined by CME Group put it in perspective. At times of volatility, order book depth may decrease dramatically. The market is able to handle high volumes of trades if quotes are refreshed promptly. Depth doesn’t necessarily equate to all aspects of market liquidity.
In practical terms, instead of asking "how much size do we have there? Consider asking “how easily is this market consuming orders without large price movement?" This will help you concentrate on execution quality and not on the biggest number on your screen.
Liquidity check:
Signal | What it tells you |
Displayed depth | How much visible size sits near price |
The immediate cost of aggressive execution | |
Quote refresh | How quickly resting orders return after being hit |
Price impact | How far price moves for a given traded size |
Fill quality | Whether orders are filled at expected prices |
Resting Liquidity vs Executed Orders: The Key Difference
Resting liquidity is found in the DOM while executed orders are found in Time and Sales and visible in the footprint charts. This is because intent can be withdrawn whereas executed orders cannot be undone.
For example, suppose you have a large bid, a few ticks below the price. If that bid has not appeared before the price, then the price was not tested. If the bid remains in place then it has a lot more significance.
If this bid is still being hit by the sellers, and the size is being filled up, the trader will be able to get a more useful indication of buying pressure at this bid level.
The objective is not to spot manipulation since the size of order books is variable, and orders are re-priced, moved and cancelled for legitimate reasons.
The lesson is more valuable than the discovery of any patterns: evaluate the resting sizes relative to the actual orders and the price.
How To Read Depth of Market Step by Step
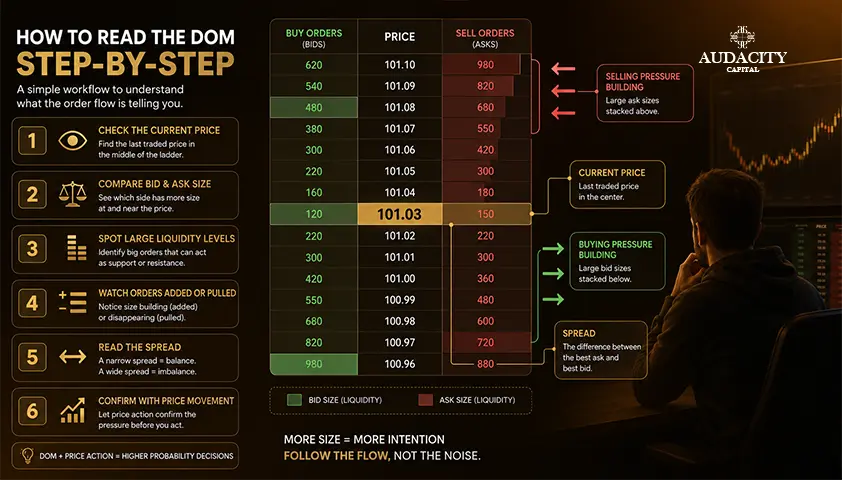
Ladder reading is not searching for "magic numbers" but rather it is a definite order. Always use these 5 steps.
1. Locate the position first.
Find a predefined level like previous high/low, a range edge, a VWAP zone or a market open. The DOM builds upon an existing concept, it does not invent one.
2. Observe the spread and the current depth.
Be sure to understand the price of a trade that is aggressive and the liquidity (that is visible) around the price.
3. Look at the behavior of the liquidity at price approach.
Is the size increasing, decreasing, or being updated? Persistence reveals much more than one-time observation.
4. Make comparisons with actual executions.
See if aggressive buyers are raising offers or sellers are making bids at the level. Next, see if the orders are absorbed or push price through.
5. Determine price action.
Is there resistance, rejection, or slice through? The answer will confirm or invalidate your interpretation.
The rule connecting all of the above is that a good reading of the depth of market can only be done with persistence and not with a snapshot. A large number means little if it disappears immediately.
What is important is that the size will hold up when orders are received and price tests the level.
3 Practical Ways Traders Use DOM Data
1. Execution planning.
Before entering, a trader can use the ladder to estimate available size near the market. This can help them choose between a passive limit order and an aggressive order. Wider spreads or thin nearby depth usually argue for smaller size or a more patient approach.
- Context: entering a swing position around a busy open.
- What the DOM shows: thin ask side, wide spread.
- What executes: aggressive market orders would sweep multiple prices.
- Price response: likely slippage on entry.
- What invalidates: spread narrows and depth stabilizes, changing the calculus.
2. Testing a key level.
At planned support or resistance, watch how resting limit orders behave as price arrives. Do they persist, replenish, or vanish? Then watch whether aggressive orders can push through the level.
- Context: price returning to yesterday's low.
- What the DOM shows: consistent bid size that refreshes after each hit.
- What executes: sellers keep hitting the bid, but size returns.
- Price response: price holds and stabilizes.
- What invalidates: bids pull just before price arrives, or a large sweep clears several levels with no refresh.
3. Breakout or liquidity vacuum confirmation.
Nearby depth can thin as the market begins to reprice. If aggressive orders then move through several prices quickly, the move may accelerate. This is descriptive, not predictive.
- Context: consolidation near a session high.
- What the DOM shows: ask-side depth thins across two or three prices.
- What executes: buyers lift multiple offers in quick succession.
- Price response: price moves cleanly through the level.
- What invalidates: fresh offers stack immediately above, absorbing the move.
DOM vs Time and Sales vs Footprint Charts
Each tool answers a different microstructure question. Combining them gives a fuller picture than any one alone.
Tool | What it shows | Best used for |
DOM | Resting visible limit orders by price | Judging available liquidity and planning execution |
Time and Sales | Completed transactions in real time | Seeing execution pace and aggressor side |
Footprint charts | Executed bid and ask volume by price inside each bar | Reviewing historical bar-by-bar order flow trading behavior |
In practice, market structure tells you the location, the DOM shows the liquidity waiting there, Time and Sales shows how the market actually trades against it, and footprint charts let you review what happened bar by bar after the fact.
No single tool is best. They answer different questions.
Which Markets Give the Most Useful DOM Data?
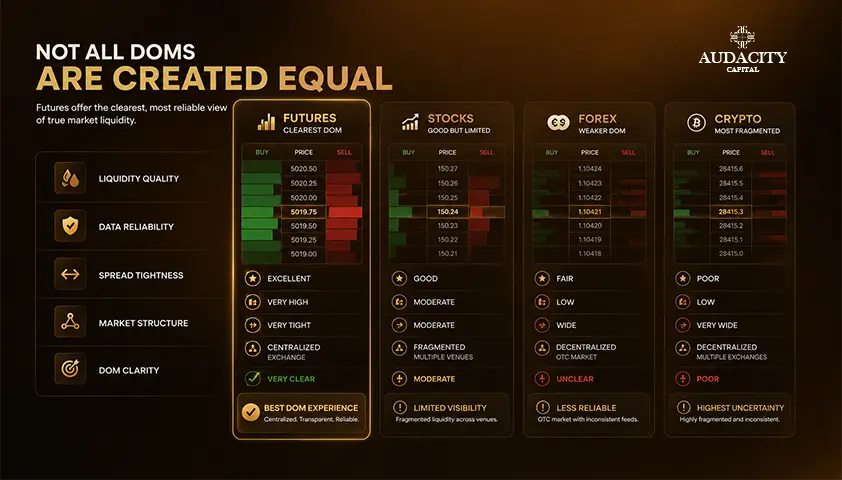
Futures are the cleanest teaching example:
A centralized exchange order book gives a consolidated view of displayed orders for a contract. That is why futures are commonly used when teaching DOM.
Equities involve trades in multiple venues:
Level 2 market data can reveal more than just the top-of-book, depending on the feed and venues involved. Two traders using different data feeds will have different views of the same equity DOM order book.
Crypto DOM is exchange specific:
The order book of one venue does not depict all crypto liquidity and depth can vary greatly from exchange to exchange. Spot forex order books are decentralized and the depth at brokers reflects the liquidity pool of the broker.
Before relying on DOM data, ask whether the book you are seeing is representative enough for the decision you want to make.
Common Depth of Market Trading Mistakes
Depth of market trading goes wrong in predictable ways. Avoiding these traps improves the quality of every read.
- Treating the largest bid or ask as guaranteed support or resistance. Displayed size can be pulled or moved at any time.
- Reading a single DOM snapshot instead of watching how orders change as price approaches.
- Ignoring actual executions. Resting size matters less when the market never trades against it.
- Applying fixed "large order" thresholds across instruments with very different typical depth and contract sizes.
- Ignoring spread, slippage, and price impact. Looking at the DOM without a predefined level or setup can make normal market noise seem meaningful.
When DOM Can Mislead You
Visible liquidity is incomplete by design. Some interest sits in iceberg orders that display only part of the total quantity. Other hidden liquidity may not appear in the public book at all.
Displayed orders can also be changed, refreshed, or canceled quickly for entirely legitimate reasons.
Order book depth can shrink during high-volatility periods without meaning the market is untradeable. Quote refresh and fill quality often paint a different picture than raw displayed size. This is one of the clearest findings from exchange-level research on liquidity.
Placement of algorithmic orders causes the ladder to move rapidly. The solution is not to try and beat each movement in the stacking and pulling of liquidity.
Concentrate on persistence at significant levels before opening of the DOM, on fills, and on the price response. That habit filters out the majority of noise.
Conclusion
A good DOM read begins with identifying the relevant level. After knowing which one to focus on, evaluate the surrounding depth and spread.
As price approaches, check whether the orders get added, removed, or refreshed. Finally, analyze the displayed liquidity against the actual executions and price response.
The DOM is important because it gives insight into liquidity ahead of time. This is why the information contained is provisional. Orders can be moved or removed from the DOM, while hidden liquidity lies outside the public order book.
The best way to read the DOM is to analyze both the visible orders and actual trades together with price action at the level. The practice will help to transform the DOM into a useful execution tool rather than a noisy chart.
Frequently Asked Questions
DOM and Level 2 both show resting orders beyond the top of book, and in many contexts the terms overlap. In equities, Level 2 specifically refers to market maker quotes beyond the best bid and ask across venues supported by the feed. DOM is the more common term in futures and often refers to a ladder-style visualization of the same underlying data.
Bid size is the total displayed quantity that traders are willing to buy at a given price, and ask size is the total displayed quantity they are willing to sell at that price. These numbers change constantly as orders are added, filled, or canceled. They represent intent, not completed trades.
No. A large resting bid shows that a large amount of buy interest is displayed at that price, but it can be canceled, moved, or partially hidden. Whether price responds depends on how the level behaves when actual selling arrives.
The DOM shows one dimension of liquidity: the displayed resting size available at each visible price. A full liquidity read also considers the spread, executed volume, how quickly quotes replenish, and how much price moves when orders trade against the book.
DOM shows resting limit orders that have not yet traded. Time and Sales shows completed executions in sequence, with price, size, and time. One is intent, the other is action.
It can be, with caveats. Spot forex is decentralized, so any depth you see reflects a specific broker or liquidity pool rather than a global book. Crypto DOM is exchange-specific, so the picture on one venue does not represent the whole market.
Some traders build strategies heavily around the ladder, but reading it in isolation is risky. Displayed depth is provisional, and combining it with location, executed order flow, and price response produces more reliable reads than the ladder alone.

Готовы применить дисциплинированный риск к криптовалютам? Изучите новые криптоинструменты Audacity Capital и примените свою торговую стратегию.
Узнать большеРассылка
Подпишитесь на нашу рассылку.
Присоединяйтесь к нашему сообществу

Начните свое путешествие сегодня с нашей бесплатной пробной версией
С гордостью демонстрируйте свои навыки и достижения с помощью сертификатов и получайте признание за свой тяжелый труд и преданность делу от потенциальных инвесторов и коллег.
Бесплатная пробная версияПохожие статьи

Swap in Trading: What It Is, How It Is Calculated and How It Affects Your Positions
Learn what a swap in trading is, how overnight fees are calculated, when triple swaps apply, and how swap costs affect forex and CFD positions.

Bearish RSI Divergence: How to Spot It, Confirm It and Trade It
Learn how to identify bearish RSI divergence, confirm reversal signals, plan entries and exits, and manage risk with practical forex trading examples.
Bullish RSI Divergence: How to Spot, Confirm and Trade It
Learn how to identify bullish RSI divergence, confirm reversal signals, choose entries, set stop losses, and manage risk effectively.
Sortino Ratio in Trading: How It Measures Downside Risk
Learn what the Sortino Ratio means, how to calculate it using downside deviation, and how traders use it to compare risk-adjusted performance.