


Turtle Soup Trading: Rules, Examples and ICT Variations


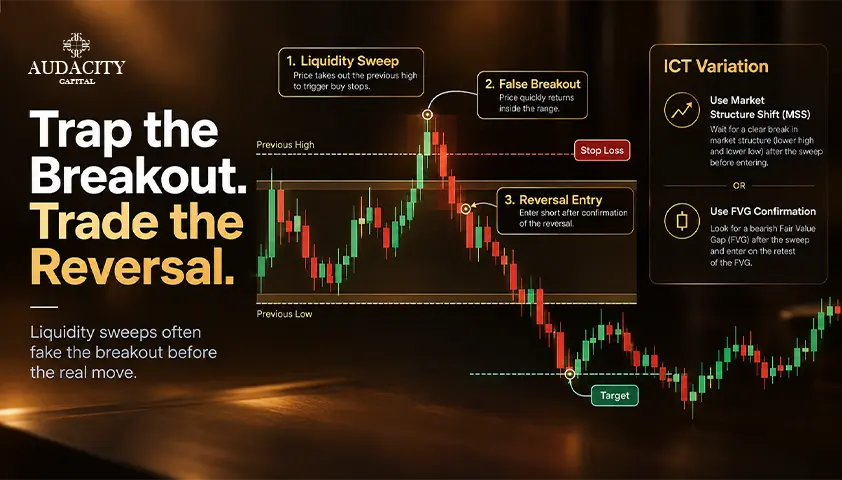
You trade a breakout over the previous day’s highs, and after a few minutes, the price moves down through your entry point and touches your stop. Every price action trader has experienced that trade.
Turtle Soup trading is based on that moment, it seeks out a failed breakout and trades the return through the level.
A reversal may fail as well, thus, the system requires rules to be established. This guide outlines the original rules, an alternative version, adaptations for ICT, and two worked examples and a test of the idea. The content is for educational purposes only and trading can involve risk of loss.
What Is Turtle Soup Trading?
Turtle Soup trading strategy is based on the idea of a failed breakout. Price breaches one level and goes back through it, and a trade is executed in the direction of that return.
A bullish turtle soup pattern occurs when price breaks below the previous low and then reverses back above it.
A bearish turtle soup occurs when the price crosses the previous high level and then reverses back below it. A touch to the level without breaking through it counts as a separate event and does not qualify.
The term originated with Larry Connors and Linda Bradford Raschke who explained the strategy in detail in their book called Street Smarts.
The renowned Turtle Traders bought breakouts to new highs and sold breakdowns to new lows. Connors and Raschke created a plan that smooths those breaks out if they fail.
In a chart, the turtle soup is an observable sequence, with a distinct level followed by a break above or below the level and price reclaiming the level.
The break is often referred to as a liquidity sweep due to the fact that there may be stop and breakout orders clustered around obvious price levels.
An ordinary price chart will not allow you to see the identity of those who caused the movement or any evidence of stop hunting. It only brings up what price did.
There are different tests for the original daily rules and modern intraday interpretations. They are separated in the following sections.
Original Turtle Soup Rules and the Plus One Variant
The rules below follow the explanation published by TradingMarkets, based on Connors and Raschke's work.
They are just historical published rules and not a call to copy their distances into another market. The long side is the first and the short side is the mirror image.
For a long setup, the current session must make a new 20-day low, breaking the previous 20-day low. That earlier low must have formed at least four trading sessions before.
The historical entry is a buy stop 5-10 ticks above the previous 20-day low. The order will be valid during the current session only. After the execution, the protective stop is one tick below the current session low.
A tick is the smallest possible price move in any instrument, and it differs from market to market. The ticks in these rules are not interchangeable with forex pips.
The session low used for the stop is the low known when the order fills. A lower low may be printed during the session, but this price does not exist at the time of the entry and should never be tested.
For the short setup, reverse: new 20-day high breaking old 20-day high at least 4 sessions old, sell stop 5-10 ticks below that old 20-day high, and protection 1 tick above the session high.
What Changes with Turtle Soup Plus One?
In Turtle Soup Plus One, the trigger is set for the next session. The previous 20-day low had to be at least three sessions old for a long setup.
Day one: The price makes a new 20-day low, and the closing price is equal to or below that broken level.
Day two: The buy stop order is placed at the previous 20-day low and expires without being triggered. One tick below the lower of two session lows serves as protection. The opposite is true for shorts.
Both approaches use 20 days of trading. But twenty-five-minute bars are another approach altogether.
How ICT Turtle Soup Differs from the Original
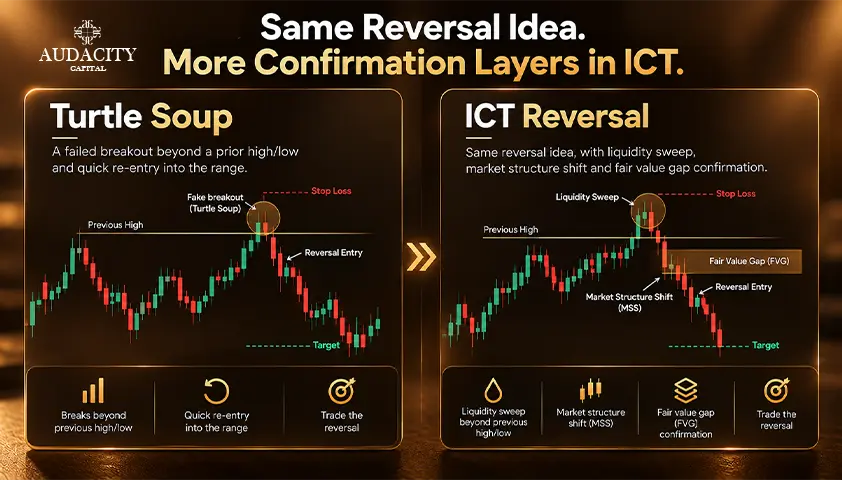
While the ICT turtle soup can be better described as adaptations of the Turtle Soup rule book, there is often a mention of past highs, lows or session levels in these versions. They call resting stops above highs buy-side liquidity and resting stops below lows sell-side liquidity.
Some publications then introduce a shift in market structure in which price moves above or below a relevant swing low or swing high after the sweep.
Others call for a fair value gap or a test of the level. A fair value gap is described as a three-candle formation where the wick range of the first and third candle creates a gap. Every additional criterion modifies the test.
Version | Reference and timing | What to keep separate |
Classic Turtle Soup | Daily lookback extreme; same-session trigger | Historical qualification and order rules |
Turtle Soup Plus One | Daily lookback extreme; next-session trigger | Its own age, close and order-expiry conditions |
Modern ICT variations | Selected swings or session levels; intraday execution | The chosen confirmation and entry method must be stated |
Context is important as well. The trade can be against the immediate breakout but within the context of the overall trend, hence these strategies are not confined to range-bound market environments.
The example below is a simple one illustrating these strategies on an intraday chart, not a replication of all possible ICT strategies.
How to Trade a Bullish or Bearish Turtle Soup Setup
This is a basic failed-breakout test that can be consistently applied. It features a completed 5-minute confirmation candle and a next bar entry. These are merely examples, not an optimum turtle soup trading strategy or universal ICT checklist.
1. Mark the Range Before the Setup
Use the previous completed session's high and low. Write down your session definition, such as an exchange's regular trading hours or a fixed daily cutoff. Also record the data feed you use, because different feeds can print different extremes.
Mark the opposite boundary as the planned target before any trade. Keep the same session convention throughout the exercise.
2. Wait for Price to Break a Boundary
For a long candidate, price must trade below the marked low. For a short candidate, it must trade above the marked high. The breach alone is not an entry signal, and you should not anticipate one from a candle that is still forming.
3. Require the Close Back Inside
In this illustration, the same five-minute candle must close back inside the prior session range. A close exactly on the breached level does not qualify. Skip any candle that sweeps both boundaries. Without this close, there is no entry under this rule.
4. Define the Entry and Invalidation
Assume entry at the next candle's open, only if that open is still inside the range. Place the planned stop loss beyond the sweep candle's extreme. Use a buffer you declared in advance for that instrument.
If the entry would already be beyond the planned target, discard the setup. Actual fills can differ from the chart price, so treat the open as an assumption, not a guarantee.
5. Fix the Exit and Attempt Limit
Use the previously marked opposite boundary as the target, and close any remaining position at the session end. Allow one attempt per boundary per session and one open position at a time.
Keep this exit and retry policy identical across both examples and your review.
Waiting for a completed candle avoids acting on unfinished information, but it can mean a later entry or a missed move. Optional structure-shift or gap conditions belong to a separately tested variation, never an unannounced change to these steps.
Turtle Soup Trading Examples
The two turtle soup trading examples below use the exact rules from the previous section. The instrument and all levels are hypothetical, prices are in generic units, and fills are assumed. The losing example is a valid setup that failed after entry, not one rejected with hindsight.
Item | Bullish example | Bearish example |
Previous session range | 100.0 to 102.7 | 197.3 to 200.0 |
Swept boundary | Low at 100.0 | High at 200.0 |
Sweep extreme | 99.2 | 200.8 |
Confirmation close | 100.2, back inside | 199.8, back inside |
Next-bar entry | Buy at 100.3 | Sell at 199.7 |
Planned protective stop | 99.1 | 200.9 |
Planned target | 102.7 | 197.3 |
Outcome assumed for teaching | Target fills before stop | Stop fills before target |
Gross result before costs | +2R | -1R |
In the long, a candle trades down to 99.2 and closes at 100.2, back inside the range. Only then does the next bar open, with the assumed buy at 100.3. The short follows the same order: close at 199.8 first, sell at 199.7 on the next open.
R means planned initial trade risk.
Each trade has 1.2 price units between entry and stop and 2.4 units to the target. The winner therefore returns 2R, while the loser loses 1R. These figures are before costs and apply only under the stated fill assumptions.
Neither figure is a recommended target or a performance estimate.
Costs change the picture. If spread and commission together cost a hypothetical 0.12 units per trade, the winner nets about 1.9R and the loser about -1.1R. Slippage on the stop could make the loss larger still. Two examples also say nothing about a win rate.
Risk Management and When to Skip a Setup
Stop distance and money at risk are different numbers. Planned cash loss depends on the distance to the stop, the position size and the instrument's tick or point value.
A tighter stop does not mean lower cash risk if size increases to match. Position sizing therefore has to be calculated for each trade. Actual losses can exceed the plan when execution slips through the stop.
Skip the setup when:
- No candle closes back inside the range.
- The next bar opens outside the range.
- Price has already passed the planned target.
- The stop or minimum position increment makes the planned risk unworkable.
- Conditions fall outside your written test plan, including spread or scheduled news filters, but only if you defined those filters before evaluating the setup.
Both sides of the idea can fail. A sustained breakout can keep running, and a return inside can reverse again. Once the attempt limit is used, stop fading that boundary. Never widen a stop to keep a losing interpretation alive.
There is no best timeframe, market or risk percentage for this method. Changing the instrument, session or timeframe changes the strategy, which means the evidence has to be gathered again. No named confluence removes reversal risk.
How to Backtest Turtle Soup Without Hindsight
This guide has not established a universal win rate or a profitable edge for Turtle Soup. A valid claim would need a defined implementation, market, period, trade count, costs and drawdown. Social media screenshots and hand-picked charts do not supply that evidence.
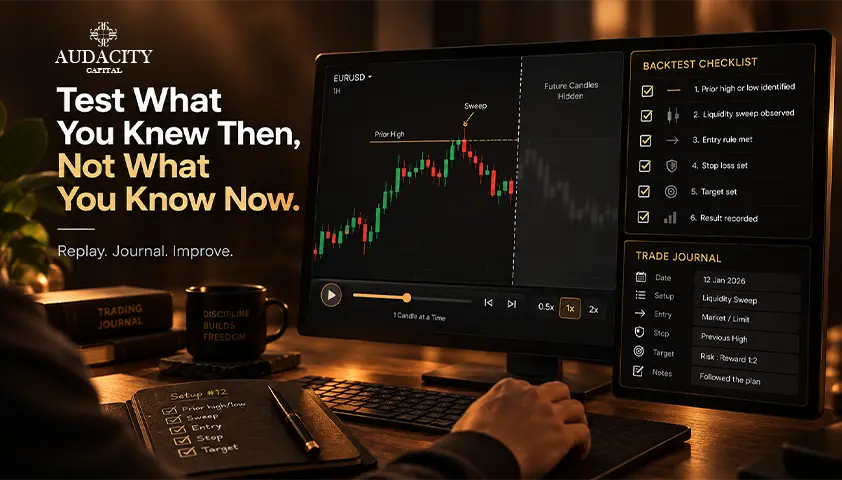
Lock your turtle soup strategy rules first. Then replay a continuous period bar by bar without seeing future candles. Log every qualifying setup, every skipped candidate and every outcome. Keep the original daily strategy and the intraday illustration in separate records.
For each trade, record entry, initial stop, exit, costs, result in R and any reason for rejection. Review average win, average loss, net expectancy, drawdown and losing streaks alongside win rate.
Then run out-of-sample testing: apply the unchanged rules to a later, separate period before drawing any conclusion.
When one bar touches both stop and target, confirm the sequence with finer data or apply a stated conservative assumption. Never pick whichever order makes the result profitable. Disclose session-end exits, missed fills and costs.
Conclusion
Pick one version: the classic setup, Turtle Soup Plus One or the intraday illustration.
Write its rules on a single page, then ask whether a second trader could mark the same entries from the same data. If they could not, tighten the wording before any real money is at risk.
To build the wider foundation behind this exercise, Audacity Capital Trader University offers free learning resources on market structure and risk management.
Frequently Asked Questions
No. Power of Three is ICT's broader framework of accumulation, manipulation and distribution. A failed-breakout entry may sit inside that interpretation, often in the phase the model calls manipulation.
The two labels do not specify identical rules, though. The phase names are the model's terminology for price behavior, not proof of institutional activity, and no phase is guaranteed to occur in a particular session.
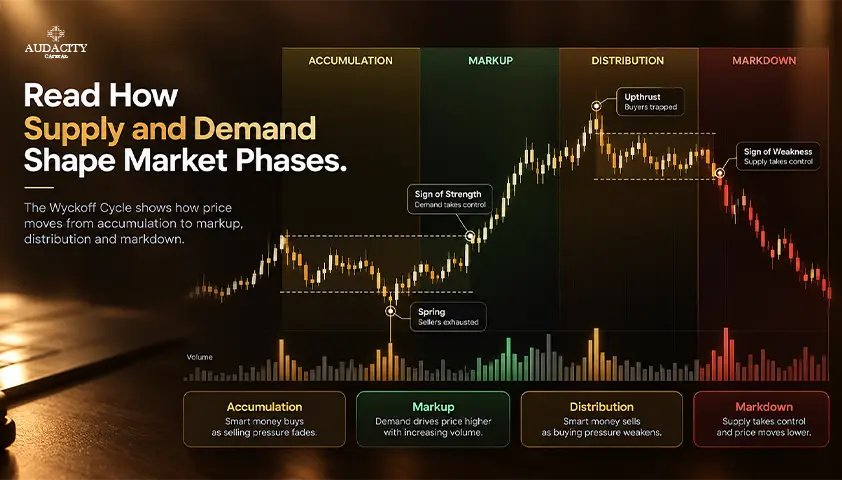
Not exactly. The chart shapes overlap: a spring moves below range support and returns, while an upthrust moves above resistance and returns. Wyckoff analysis also weighs the broader trading range, its phase and volume behavior around the move.
A failed breakdown that looks like a spring does not make the two methods, or their entry rules, interchangeable.
Yes, if the rules are explicit. A published MQL5 implementation shows the setup can be coded. The program must define the levels, entry timing, session boundaries, stops, exits and repeat attempts. Automation only executes the definition you chose.
It does not validate an edge, and it cannot reproduce discretionary judgment that was never written down. Historical results from any coded version are not expected returns.

Готовы применить дисциплинированный риск к криптовалютам? Изучите новые криптоинструменты Audacity Capital и примените свою торговую стратегию.
Узнать большеРассылка
Подпишитесь на нашу рассылку.
Присоединяйтесь к нашему сообществу

Начните свое путешествие сегодня с нашей бесплатной пробной версией
С гордостью демонстрируйте свои навыки и достижения с помощью сертификатов и получайте признание за свой тяжелый труд и преданность делу от потенциальных инвесторов и коллег.
Бесплатная пробная версияПохожие статьи

GTC in Trading: What Good Till Cancelled Orders Mean and How to Use Them Properly
Learn what GTC means in trading, how Good Till Cancelled orders work, when to use them, and the risks of leaving pending orders active.


Order Flow Imbalance: How to Read Buy and Sell Pressure
Learn what order flow imbalance means, how footprint and order book readings differ, and how traders assess buy and sell pressure with context.
Wyckoff Method Explained: Phases, Rules and Examples
Learn the Wyckoff Method, its three laws, accumulation and distribution phases, trade examples, and the limits of price and volume analysis.
SMT Divergence in Trading: Bullish and Bearish Examples
Learn what SMT divergence means, how bullish and bearish setups form, which markets traders compare, and how to confirm signals and manage risk.