


What is Drawdown in Trading?



You open your platform chart or your strategy report and there it is, a drawdown figure, printed as if explaining everything.
In most cases, it does not
The figure indicates that something was wrong, but does not indicate what exactly is being counted. It does not show the account value on which the calculation was done and what is needed to reverse the effect.
This article covers all this. Here, you will learn what the number measures, from which account value the calculation is made, what the different types report, why the recovery takes more money than the loss, what is the allowable amount of loss, and what reduces it.
What Is Drawdown in Trading?
A drawdown in trading refers to the fall from a peak in an account or a trading strategy to the lowest point it reached before hitting a new peak, expressed as a percentage of that peak.
The small detail omitted in short definitions is the high-water mark. This measurement always starts at the highest value achieved by the account.
A drawdown starts as soon as the account goes past the high-water mark, but it doesn’t end when the decline stops. Rather, a drawdown stops when the account achieves a new peak.
This implies that there's a minor distinction to be kept in mind. A trough is only confirmed after a new peak has been achieved. Until then, the lowest point is provisional as the account may fall further. That's why a drawdown that is on-going can only be estimated, not finalized.
One little caveat: In accounting, banking and pensions, it means something different and has to do with money being withdrawn, not the price going down. See the FAQ for more information.
How to Calculate Drawdown
In simple words, the formula is peak value minus trough value, divided by peak value, multiplied by 100.
Drawdown = ((Peak − Trough) / Peak) × 100
This is how drawdown is calculated, and its value is expressed in percentages.
The tricky thing is the denominator of this formula. The decline is based on the peak that the trading account reaches, not the initial balance.
For instance, if an account opens with a certain amount, it goes up to a higher level, and then falls back to the lower level, the highest level should be used, not the original deposit.
Let's illustrate this with an example:
Suppose you have an account for $10,000, it rises to $14,000 and then declines to $11,900.
In this case, the peak is $14,000, but not the starting point of $10,000, therefore the drawdown will be equal to ($14,000-$11,900)/$14,000 × 100, which comes to 15%.
If you measure it to the initial deposit, the outcome would be different: you will have profit, not drawdown, which is a completely different, and wrong, reading of the same account.
Is Drawdown Measured on Balance, Equity or Floating Positions?
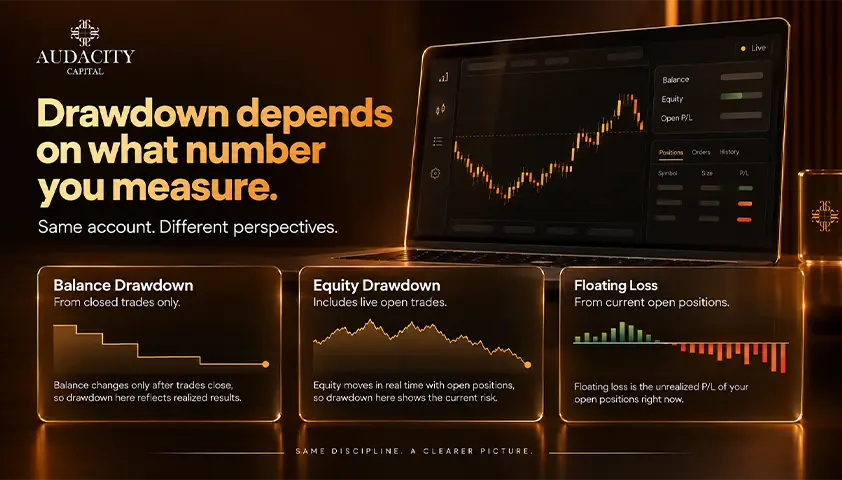
This is where two correct calculations can vary, and the significance surpasses most theories.
Balance based drawdown vs equity based drawdown is a question of what they have included. Balance usually measures the performance of the account in general, while equity considers the value of the floating positions too.
Hence, a drawdown based on balance will not account for anything currently floating, while a drawdown based on equity will account for it in real-time.
A single trading account may have two completely different drawdowns at the same time, but both calculations are accurate.
The outcome is instant. A trader who has a tendency of closing out trades too late will be trading with a lower balance drawdown and higher equity drawdown.
The balance calculation is not incorrect. It simply figures out the unrealized profit or loss that will equalize equity at the time of closing of those positions.
When comparing two drawdowns, one must be aware from which figure the other is derived for the comparison to make sense.
The difference between Balance-based drawdown and equity-based drawdown is not a technicality, but rather a difference in perception of risk.
Floating drawdown represents the loss observed in equity due to unrealized losses in open trades. It disappears when those positions recover, and when they don’t, then it becomes a realized drawdown.
A Drawdown Is Not the Same as a Loss
The terms are used interchangeably, but they have very different meanings.
A loss is the performance of a position or a certain period in relation to the investment that was made. A drawdown is measured in relation to the rolling high.
The reference points being different mean that the two figures can present entirely different pictures of the same account.
Work through an example. An account that started at $10,000 reached $16,000 and then fell to $13,000. In relation to the opening balance, the account has gained 30%, thus being profitable. In relation to its highest point of $16,000, the account is currently in an 18.75% drawdown.
Both numbers are correct. They describe the same account at the same time. While one number is positive, and another one is negative, none of them denies the other one.
It all comes down to the simple idea that being in a drawdown does not tell anything about the profitability of an account. It simply means that the account is below its highest point.
The Types of Drawdown
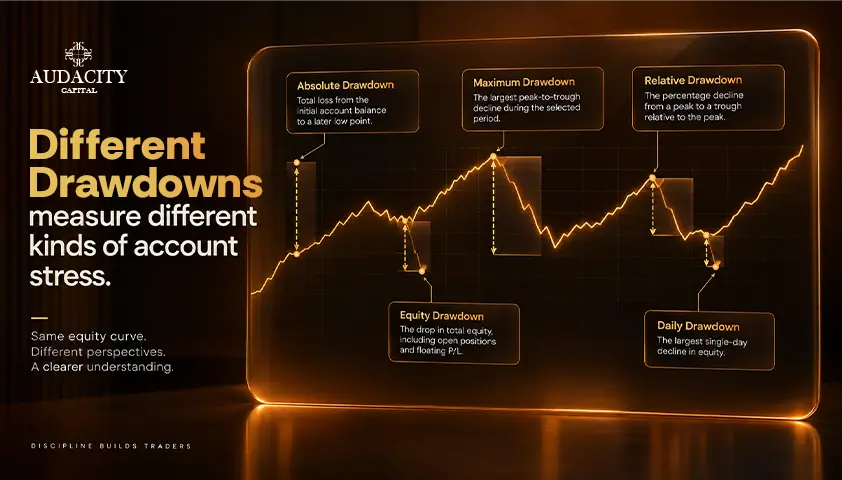
The word "report" is often used in many different ways, so it is good to differentiate the types.
1. Maximum drawdown
It is the greatest decline in the balance measured within the timeframe, and this is the number that the majority of reports highlight.
2. Average drawdown
It refers to the average size of drawdowns measured within a timeframe, although it could be reported in different ways.
3. Absolute drawdown
It is calculated from the starting balance instead of a peak, and it indicates how much below the starting deposit the balance falls.
4. Relative drawdown
It is calculated as a percentage of the peak it dropped from, and this is the percentage figure that the majority of reports refer to.
Absolute and relative drawdown are two different things, so it is important to be aware of which is being used in a report.
Two figures are actually measurement periods, not distinct concepts. Daily and end-of-day drawdowns refer to different windows.
A daily drawdown represents the drop in a single trading session. An end-of-day figure is based on closing values instead of intraday high-low ranges. This is the reason how two different numbers can be obtained on the same day.
One such drawdown measure is the drawdown duration or time under water. This is the time interval between two peaks.
To illustrate, the 25% decline that recovers within two months and that which takes three years will both have the same maximum drawdown figure. Based only on the drawdown depth, one cannot differentiate between them.
There are ratios that attempt to integrate all these factors together. The Calmar ratio divides return by maximum drawdown to compare strategies on return per unit of worst-case decline.
The problem with the Calmar ratio lies in the fact that it employs the drawdown depth approach. So a decline that recovered in weeks can receive the same treatment as one that took years.
Type | What it measures | What it does not tell you |
Maximum drawdown | The largest peak-to-trough fall in the period | How often declines happen, or how long they lasted |
Average drawdown | The typical size of declines in the period | How bad the worst one was |
Absolute drawdown | The fall measured against the starting balance | Anything about declines from later peaks |
A decline as a percentage of the peak it fell from | The cash amount involved | |
The decline within a single session | Anything about the wider trend | |
Drawdown duration | Time from a peak until a new peak is made | How deep the decline went |
Why Recovering Costs More Than You Lost
You must have seen the claim that recovering from a 50% loss requires a 100% gain. It is repeated all the time and never explained, which is the whole idea.
Drawdowns and their recoveries are calculated on two different bases. Drawdown is calculated on the maximum value while recovery must come on a smaller number, what is left after the drop.
Losing 25% means that 75% of your capital must increase by a third, since one-third of 75% amounts precisely to 25%. The logic behind the two bases explains why the table below comes as no surprise.
The proportion is not linear. If you double your drawdown depth, your recovery requirement more than doubles and continues growing exponentially beyond a certain level.
This is the math behind all recommendations about avoiding deep drawdowns and it sets up the cushion question in the next section.
Drawdown | Gain needed to recover | Why |
5% | 5.3% | The gain is earned on 95% of the peak |
10% | 11.1% | The gain is earned on 90% of the peak |
20% | 25% | The gain is earned on 80% of the peak |
33% | 50% | The gain is earned on 67% of the peak |
50% | 100% | The gain is earned on half the peak |
75% | 300% | The gain is earned on a quarter of the peak |
How Much Drawdown Is Acceptable, and How Much Cushion to Hold
This is the question most readers actually arrive with, and it is really two questions.
How much drawdown is acceptable?
A figure around twenty percent is widely cited as an upper comfort level. The reasoning comes from the recovery arithmetic above.
At that depth, the required gain to recover is still manageable. Beyond it, the required gain starts climbing steeply.
So the number has a logic behind it. But it is a convention that writers have adopted, not a property of markets and not a threshold with evidence behind it. How much drawdown is acceptable is not something a single number can settle for every trader.
There is a deeper reason no universal figure exists. Maximum drawdown describes the worst decline that has happened so far in the data measured. It is a record, not a limit.
A longer history has more opportunity to contain a severe decline, so the same strategy typically reports a larger figure over ten years than over two.
And in a long favorable stretch almost everything reports a modest figure, which means a small maximum drawdown can indicate a resilient strategy or an untested one. The number alone cannot tell you which.


Audacity Capital Empowering Traders Since 2012
Join the Top Prop FirmHow much cushion to hold?
Cushion is a different idea, so treat it separately. The question here is how much capital sits between the account and the point where a normal bad stretch becomes unrecoverable.
Several variables determine it:
- The depth of decline the strategy has historically produced
- How much of the account each position risks
- How many consecutive losses the strategy can generate
- The recovery required after a drawdown
Put those together and you have a more useful answer than any fixed percentage.
The important point is that a trading account cushion is not spare money sitting idle. It is the difference between a drawdown being survivable and being terminal.
Sizing it is a calculation each trader has to run against their own record, not a figure to copy from anyone.
For a sense of scale, look at verified index history. The S&P 500 fell roughly 57% from its October 9, 2007 peak to its March 9, 2009 trough during the financial crisis.
During the dot-com bust, the Nasdaq Composite fell around 78% from its March 10, 2000 peak to its October 9, 2002 trough. Those are the depths broad indices have actually reached, and they show why a serious decline is a property of markets, not an anomaly.
How to Reduce Drawdown?

Most guides list the techniques and stop there. The useful part is the cost that comes with each one.
If you want to know how to reduce drawdowns in active trading, learn the trade-off alongside the method. Every way of shrinking a decline gives something up.
The depth of a decline is largely a function of how much is committed per trade. Smaller positions produce smaller drawdowns, and they also produce smaller returns.
Predefined exits.
These cap how far any single position can run against the account. The cost is that tighter exits increase how often trades are stopped out before they would have worked.
Diversification.
Spreading capital across instruments that move together does very little. What reduces drawdown is low correlation, not variety.
Correlation and diversification are not the same lever, and diversifying properly dilutes the worst outcome and the best one alike.
Reducing leverage.
Leverage scales both gains and declines, so cutting it shrinks the figure in both directions.
Reducing size during a decline.
This slows the deepening of a drawdown, and it slows the recovery for the same reason.
None of these eliminates drawdowns. Any strategy that experiences a loss can fall below its previous peak. The realistic aim is limiting depth and duration, not avoidance.
Knowing how to reduce drawdowns in active trading is really about choosing which trade-off you are willing to accept.
Drawdown vs Volatility
These two numbers both show up in risk reports, and they are not interchangeable.
Volatility measures how much results vary around their average, and it is indifferent to the order those results arrive in. Drawdown is path dependent, which means the sequence is the whole story.
Take a fixed set of monthly results and rearrange them. The average is unchanged. The volatility is unchanged. The maximum drawdown can be completely different, because clustering the losing months together digs a far deeper hole than spreading them out across the year.
That single example is why both numbers appear side by side in risk reports, and why neither one replaces the other.
Conclusion
Ask what is drawdown in trading and the honest answer is that it is a measurement, not a verdict. The same percentage can describe wildly different experiences depending on which account value it was calculated from, how long it lasted, and how much history produced it.
None of that is visible in the number itself.
So do one thing whenever a drawdown figure is put in front of you.
Ask three questions: was it calculated on balance or equity, over what period was it measured, and what gain would be required to undo it.
Without those three pieces of information, the percentage doesn't tell you much.
Frequently Asked Questions
They share a word and nothing else. In accounting and banking, drawing down means taking funds from a facility or a pension pot, so it describes a withdrawal or a liability being taken on. In trading, it describes a fall in value from a peak. Same word, unrelated meaning.
There is no reliable range, because it depends on two things pulling in different directions. The depth of the decline and the return the strategy generates set the size of the climb, and the market conditions that follow set the pace. Arithmetic decides how far you have to travel, but it cannot tell you how long the market will take to get you there.
Yes, in a specific sense. Once a new high is reached, the high-water mark moves up, that episode closes, and the next decline is measured from the new peak. What does not reset is the record: the historical maximum drawdown figure stays on the books as the worst decline the account has seen.
Live results commonly show deeper declines for several reasons. A backtest can omit real costs such as slippage. It may also assume every trade was taken at the modeled price.
Some backtests also cover a shorter period than a full market cycle. The equity curve on paper tends to look cleaner than the one you live through.
The calculation is identical everywhere. What differs is the behavior of the underlying instrument. Markets with larger and faster price swings tend to produce deeper declines, and leverage amplifies the figure regardless of which market it is applied in.

Готовы применить дисциплинированный риск к криптовалютам? Изучите новые криптоинструменты Audacity Capital и примените свою торговую стратегию.
Узнать большеРассылка
Подпишитесь на нашу рассылку.
Присоединяйтесь к нашему сообществу

Начните свое путешествие сегодня с нашей бесплатной пробной версией
С гордостью демонстрируйте свои навыки и достижения с помощью сертификатов и получайте признание за свой тяжелый труд и преданность делу от потенциальных инвесторов и коллег.
Бесплатная пробная версияПохожие статьи

Trailing Max Drawdown
Understand trailing max drawdown rules in prop trading. Learn how it works, how it’s calculated, and how traders manage drawdown limits.


Relative Drawdown Explained: Meaning, Formula & Example
Learn what relative drawdown is in trading, how to calculate it, and why it matters for risk management. Simple formula and examples by Audacity Capital.

What Is Static Drawdown? How It Works + Examples
Learn what static drawdown means in trading and funded accounts. Audacity Capital explains how static drawdown works and how traders manage risk.

Prop Firm With the Highest Drawdown: Why It Matters More Than You Think
Looking for a prop firm with the highest drawdown? Discover flexible risk limits and trading conditions with Audacity Capital and compare top prop firms.