


Doji Candlestick Pattern: How to Read, Confirm and Trade It


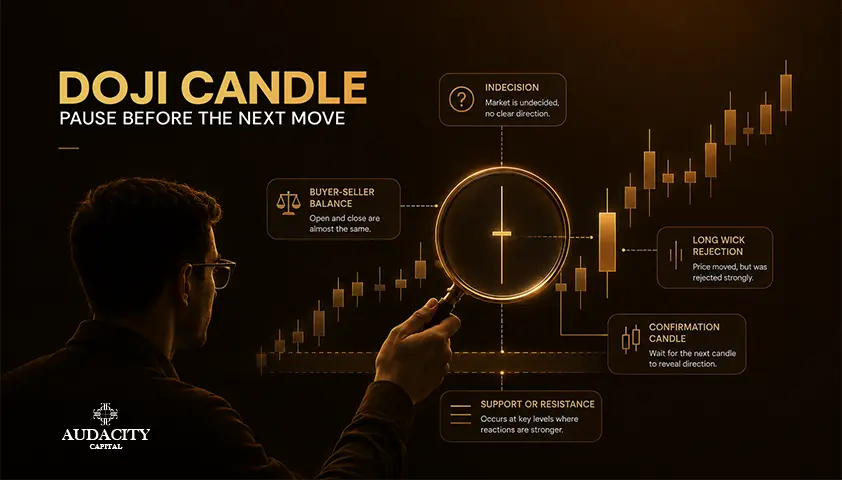
A doji candlestick forms when an asset opens and closes at the same price, or close enough that the real body almost disappears, whereas wicks reveal where the price moved during that time. It is one of the most easily recognizable patterns in price action and the most commonly misunderstood.
Its interpretation is straightforward: neither buyers nor sellers were able to gain a clear advantage over each other by the close. And that fact itself does not tell you what happens next.
This article explains how to spot a doji candle, the five common types, and how location on the chart alters its interpretation. This also includes confirmation and common pitfalls for new traders.
What Is a Doji Candlestick Pattern?
A doji forms when the opening and closing prices are almost identical, leaving the real body very small or nearly flat. The high and low, however, can be very well separated. The wicks are the story. They show how far price moved before returning near the opening level.
"Essentially equal" matters. In live markets, tick size and normal price noise mean that the open and close rarely match to the last decimal. Some charting providers use a percentage of the candle's total range to define a doji. Others require the open and close to match exactly. There is no universal standard here.
The story behind the doji pattern is pretty clear without exaggeration. Price went up, down or in both directions, but it returned to the initial level. This is balance, and whether it will lead to anything or not depends on the context.
How To Identify a Doji vs a Small-Bodied Candle
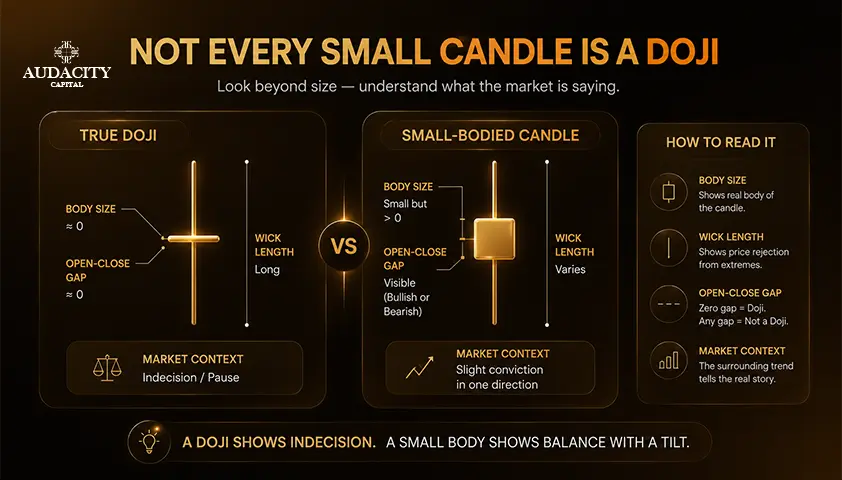
Here is how you can tell whether the candle is a doji candle or a small-bodied candle using the three-point test:
- The actual body of the candle is quite small compared to the total length of the candle.
- The price opened and closed nearly at the same level.
- The wick formation is one of the known doji formations.
However, not all small candles are dojis. This is when the difference in doji vs spinning top becomes important. A spinning top has an evident real body and wicks on both sides. It also shows indecision, but the open and close are clearly separated. A true doji will have an almost invisible body.
A typical small candle under the low-volatility market environment is neither. It is an indication of a quiet period, not rejection or a balance point to act upon. Compare the size of the body and the whole range of the candle. If the body occupies some significant part of the candle, then it is not a doji.
What Does a Doji Tell Traders?
The doji pattern indicates indecision at the close but it does not indicate a reversal pattern automatically.
The interpretation of this pattern varies according to its location:
- After an extended trend: Momentum may be stalling. The previous trade didn't result in a decisive close.
- Inside a range formation: The candlestick provides little additional information since ranges reflect indecision by definition.
- Close to a breakout or a critical level: The candle could indicate a short-term balance before the direction of the continuation or failure.
There is additional information in the upper and lower wick. A long lower wick indicates a price rejection at the lower levels. A long upper wick indicates a rejection by higher levels. Long wicks on each side indicate wide two-way flow without resolution.
The location, and what the candle will do next, is more important than the candle's name.
5 Types of Doji Candlestick Patterns
There are five popular doji patterns. They each have different forms, but no fixed prediction of direction.
1. Standard Doji
Shape: Open and close are in the middle of the trading range, with slight upper and lower wicks.
What it indicates: The price moved in both directions, but ended near where it had opened.
Best usage: It can appear during a pause at a significant support, resistance, or swing level. But it doesn't give any indication by itself of the direction of the next price move.
2. Long-Legged Doji
Shape: Small body with long upper and lower wicks.
What it indicates: The price moved up and down sharply but ended near its opening point.
Best usage: It can occur when there is a sharp increase in volatility or uncertainty near an important level. The candle shows two-way pressure, not a clear winner.
3. Dragonfly Doji
Shape: High open and close with long lower wick.
What occurred: Price drops within the bar then bounces up to the opening level.
Ideal setting: A dragonfly doji occurring at a support level after a decline may indicate sellers exhaustion. The bullish pattern will be more valid only if it is confirmed by subsequent price action.
4. Gravestone Doji
Shape: Low open and close with long upper wick.
What it indicates: Price rises in the bar then falls to the opening level.
Best setup: At resistance after a rally, a gravestone doji may show that buyers are losing strength. For bearish trading, it needs to be confirmed by other price action.
5. Four-Price Doji
Shape: The open, high, low, and close are nearly identical.
What happened: No price action took place within the timeframe of the candle.
Ideal setting: It typically occurs in periods of very low market activity or illiquid securities. The candle carries very little price information and thus is rarely used as a stand-alone reversal pattern.
Where a Doji Matters Most on the Chart
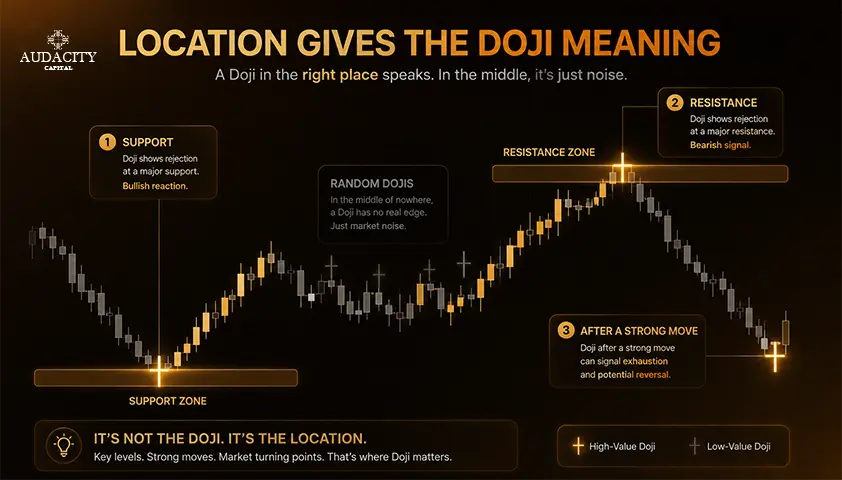
All dojis cannot be considered important. Location comes first over shape.
- Following a prolonged move, particularly a move around a support, resistance or a major swing point. This is when the candle is loaded with information.
- At a rejected breakout or failure. The candle can verify that the breakout attempt was not followed up.
- Near the edge of a defined range. Useful for traders who are looking for reactions.
- In the middle of random chop. It’s not very useful in such an environment. Indecision inside indecision – it’s just noise.
A doji appearing at the top of an uptrend is not necessarily bearish. It just means that the buyers dominating recent bars could not close this one decisively. Price still needs to confirm a shift by breaking structure downwards.
The same principle holds true if we have a downtrend. A doji appearing at the bottom of the move might be a sign of exhaustion, temporary pause, or normal breath before the trend resumes. The candle asks a question, while the next few bars give the answer.
How to Trade a Doji Candlestick Step by Step
A disciplined approach beats reacting to shape. Use this five-step decision sequence.
- Step 1. Establish market context. Identify the current trend, the nearest support and resistance, and recent volatility conditions. Without this frame, no candle means much.
- Step 2. Identify the doji type and the level rejected by its wick. Note which side of the market was pushed back. Do not assign a direction yet.
- Step 3. Wait for confirmation from price. A confirmation candle can come from a break of the doji high or low, a close beyond nearby structure, or a failed retest of the rejected level. Define the confirmation rule before the trade, not after.
- Step 4. Place invalidation beyond a logical price level. Use structure, not a fixed number of ticks. If the doji wick is long, the required stop may be too wide relative to a realistic target. If the risk-to-reward does not work, skip the trade.
- Step 5. Set the target from market structure or a tested framework. The doji itself provides no built-in target. Prior swings, range boundaries, or a fixed risk multiple do that job.
Waiting for confirmation includes the option of no trade. If the next bars do not deliver a clean signal, standing aside is the correct action.
3 Practical Doji Setups
Examples teach context, not certainty. Each setup has four parts: context, doji, confirmation, invalidation.
1. Dragonfly Doji After a Decline at Support
- Context: Price has fallen into a well-tested support zone.
- Doji: A dragonfly prints, with a long lower wick rejecting the level.
- Confirmation: A close above the next minor swing high, not just above the doji.
- Invalidation: A close back below the support zone that was defended.
2. Gravestone Doji After an Advance at Resistance
- Context: Price has rallied into a prior supply area.
- Doji: A gravestone forms, with a long upper wick.
- Confirmation: A close below the doji low, ideally under a short-term structural point.
- Invalidation: A close back above the resistance level.
3. Long-Legged Doji After Expansion (Often a No-Trade)
- Context: A wide-range candle prints in the middle of a session.
- Doji: A long-legged doji follows, showing both sides fighting hard.
- Confirmation: Only trade if price resolves clearly beyond a defined level and the higher-timeframe structure supports the thesis.
- Invalidation: If price stays inside the range of the expansion bar, treat it as no trade.
Doji vs Hammer, Shooting Star and Spinning Top
Shape confusion is common. This comparison helps.
Candle | Body | Wick Structure | Primary Signal |
Doji | Tiny or none | Varies by type | Balance or rejection |
Hammer | Small but visible, near the high | Long lower wick | Potential bullish rejection |
Shooting Star | Small but visible, near the low | Long upper wick | Potential bearish rejection |
Spinning Top | Small but visible, mid-range | Wicks on both sides | Indecision |
A hammer and dragonfly doji both show lower rejection. The difference is the body: a hammer has a small, visible body near the high.
A shooting star and gravestone doji both show upper rejection. Again, the body separates them. A shooting star has a small visible body, while a gravestone doji has almost none.
Spinning tops are similar in meaning, but their real bodies are more clearly visible. Classification helps, but context matters more than the candle's name.
Conclusion
A doji candlestick pattern shows that price returned to roughly its opening level after moving during the bar. That is useful information, but it carries no fixed bullish or bearish meaning on its own.
Use the decision sequence every time. Identify whether the candle truly qualifies as a doji. Judge where it formed on the chart. Wait for the price to confirm before acting. Define invalidation on structure, not on the candle itself. That approach turns a widely misused shape into one piece of a broader, disciplined price-action framework.
If you are building the discipline to trade structured setups with defined risk, Audacity Capital's evaluation and funded trader programs are designed to support exactly that kind of process-driven trader.
Frequently Asked Questions
A doji is neither by default. It shows that the open and close finished at similar levels after price explored a range during the bar. Its directional value comes from where it forms and how price reacts in the bars that follow.
No. A doji signals balance, not a guaranteed reversal. Context and the following price action determine its significance.
A doji has an extremely small or effectively flat real body, while a spinning top has a small but clearly visible body. Both communicate indecision, but a spinning top shows one side still closed with a slight edge.
It shows sellers pushed price lower during the bar but could not hold those levels into the close. The interpretation improves when the candle forms at support and is followed by a confirmation candle that closes above nearby structure.
It shows buyers tried to extend higher but lost those gains by the close. Its bearish reading strengthens when it forms at resistance and is followed by a close beneath a short-term structural level.
Yes, waiting for a confirmation candle or a clear price break is the disciplined approach. If confirmation does not appear on the terms you defined in advance, the correct choice is no trade.
It means the open, high, low, and close were essentially the same, which usually reflects very low activity or illiquid conditions. It is rarely a reliable reversal signal on its own and is often best ignored.

Handa nang maglapat ng disiplinadong panganib sa crypto? Galugarin ang mga bagong instrumento ng crypto ng Audacity Capital at dalhin ang iyong diskarte sa pangangalakal.
Matuto PaNewsletter
Sumali sa aming newsletter.
Sumali sa Aming Social Community

Simulan ang Iyong Paglalakbay Ngayon Gamit ang Aming Libreng Pagsubok
Ipagmalaki ang iyong mga kasanayan at tagumpay sa pamamagitan ng mga sertipiko at makakuha ng pagkilala para sa iyong pagsusumikap at dedikasyon mula sa mga potensyal na mamumuhunan at kasamahan.
Libreng PagsubokMga Kaugnay na Artikulo
Average Daily Range (ADR): How to Use It for Trading
Discover how to judge intraday room to move and set realistic targets. Compare average daily range vs. ATR to improve trade planning across all markets.

Depth of Market (DOM) Explained: How to Read Market Liquidity
Master Depth of Market (DOM) trading. Learn to evaluate order book liquidity, track real-time price response, and refine your execution with practical DOM insights.
Elliott Wave Theory: How to Identify and Trade Wave Patterns
Learn how Elliott Wave Theory works, the three hard rules that invalidate an impulse count, key corrective patterns, Fibonacci guidelines, and how to build a risk-defined trade plan around a wave count.
Head and Shoulders Pattern: How to Trade It
Learn the Head and Shoulders Pattern: how to spot it, draw the neckline, and trade the entry, stop, and target, plus how reliable it really is.