


Head and Shoulders Pattern: How to Trade It


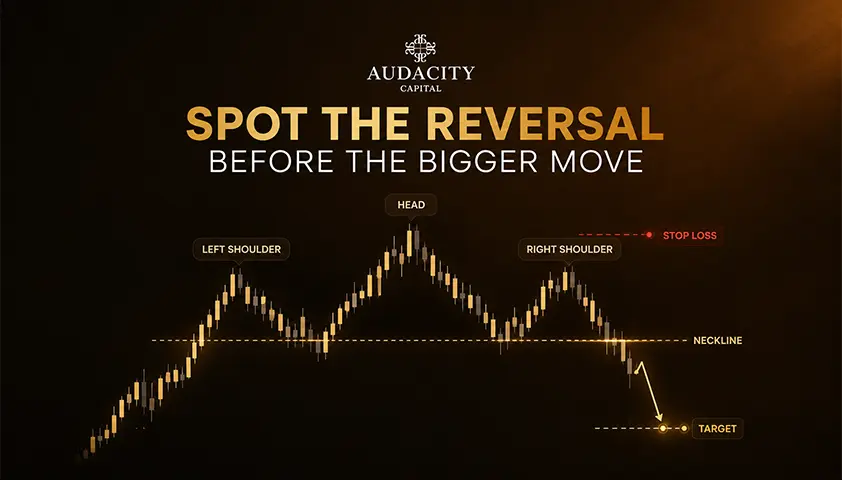
The Head and Shoulders Pattern is a trend reversal formation made of three peaks: a higher middle peak called the head, sitting between two lower peaks called the shoulders.
It becomes a tradeable signal only when price breaks the neckline, the line drawn across the two pullback lows between those peaks.
Reversal here simply means a trend changing direction, an uptrend rolling into a downtrend, or the opposite for the mirror version.
It is worth learning because it appears across forex, indices, commodities, stocks, and crypto, and because a huge number of traders watch it, which gives the neckline break real behavioral weight.
What it is not is a crystal ball.
Some of the success rates quoted online are inflated by how the numbers were counted, and you deserve the context before you risk anything.
This guide covers
- the two versions of the head and shoulders chart pattern,
- how to filter a valid setup from random noise,
- the exact entry, stop, and target mechanics,
- how reliable the pattern really is, and how it fails.
What is the Head and Shoulders pattern?
The head and shoulders reversal pattern describes a specific sequence at the end of a trend. Price rises to a peak and pulls back, forming the left shoulder.
It rallies again to a higher peak and pulls back, forming the head. Then it rallies a third time, but stalls at a lower high roughly level with the first peak, forming the right shoulder.
From there, price turns down and eventually breaks the neckline.
The shape matters less than the story behind it. Each rally shows buyers with less follow-through than the last. The head is the final push that the crowd cannot extend.
The right shoulder is a weaker attempt that fails well below the previous high, which tells you demand is thinning while supply builds. When price closes below the neckline, the level that had been acting as support gives way, and sellers have taken control of the structure.
That is the moment the pattern is confirmed, not the moment you first notice the shape.
The four components to name and label on your chart:
1. Left shoulder: the first peak in the sequence, followed by a pullback.
2. Head: the highest peak, showing the last strong burst of buying.
3. Right shoulder: a lower peak, roughly symmetric with the left shoulder in height and often in duration.
4. Neckline: the line connecting the two pullback lows between the peaks. It can be horizontal or sloped, ascending or descending, and it is the trigger level for the trade.
Everything described so far is the regular version, a bearish reversal that forms at a top after an uptrend.
There is also a bullish mirror image, the inverse head and shoulders, which forms at a bottom. That is next.
Regular vs inverse (inverted) Head and Shoulders
The two versions are mirror images, and so is the trade logic.
Every element flips: the direction of the prior trend, the shape, the side the neckline sits on, the direction of the breakout, the side your stop goes, and the direction of the measured target.
Both versions need a genuine prior trend to reverse, because a reversal pattern with nothing to reverse is just a shape.
The regular pattern forms after an uptrend as three peaks, with a higher head between two lower shoulders. It is a bearish reversal, traded short on a break below the neckline.
The inverse head and shoulders, also called the inverted head and shoulders, forms after a downtrend as three troughs, with a lower head between two higher shoulders.
The neckline is drawn across the intervening highs, and it is a bullish reversal, traded long on a break above that neckline.
Regular (top) | Inverse / inverted (bottom) | |
Prior trend | Uptrend | Downtrend |
Shape | Three peaks, higher head | Three troughs, lower head |
Neckline drawn across | The two pullback lows | The two intervening highs |
Signal | Bearish reversal | Bullish reversal |
Entry direction | Short on break below neckline | Long on break above neckline |
Stop side | Above right shoulder or head | Below right shoulder or head |
Target direction | Projected down from breakout | Projected up from breakout |
Note: Neither version is inherently more reliable than the other. Both are probability tools, and both still require confirmation and a defined stop.
How to identify a valid Head and Shoulders?
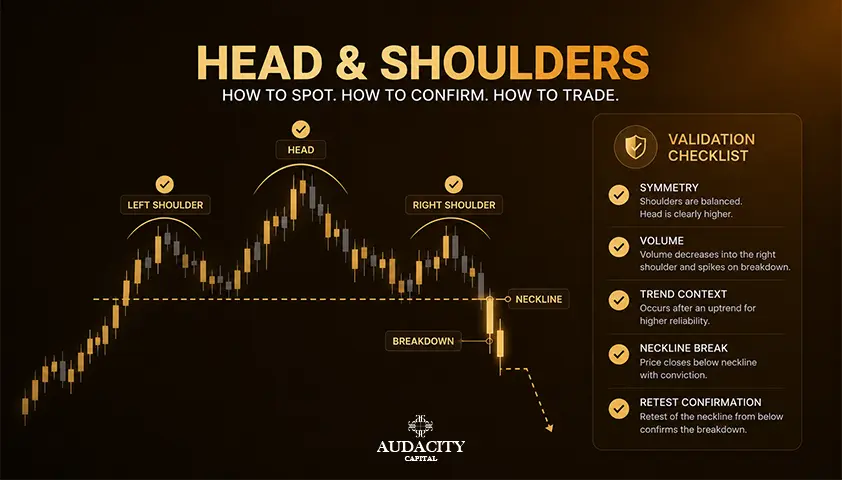
Over-identification is the single biggest reason traders lose money on this pattern. The shape is easy to imagine, so run every candidate through a checklist before it earns any attention.
1. Prior trend.
There must be a real trend to reverse. For a regular pattern that means a visible uptrend into the left shoulder. Three peaks inside sideways chop is not a head and shoulders chart pattern, it is range noise with an imaginary label on it. Mark the trend first, then look for the shape.
2. Proportions.
The head should be clearly the highest peak, with obvious separation from both shoulders. The shoulders should be roughly symmetric in height, and often in the time they take to form. Wildly uneven shoulders, or a head that barely exceeds the left shoulder, weaken the read considerably.
3. Neckline.
Draw the head and shoulders neckline across the two pullback lows for a regular pattern, or the two intervening highs for the inverse. It does not have to be flat. A horizontal or sloped neckline both count, though a steeply ascending neckline on a top pattern can delay confirmation and shrink your reward-to-risk.
4. Volume signature.
Classically, volume is heaviest into the left shoulder and head, lighter on the right shoulder, and picks up on the neckline break. Volume confirmation is not decoration, it is evidence that participation is behind the move rather than a thin drift. In forex, where centralized volume is unavailable, tick volume or futures volume is the usual proxy.
5. Timeframe.
Daily and weekly charts produce more reliable patterns than 5-minute charts. Low-timeframe shapes often look textbook and rarely deliver, because a single news print or liquidity sweep can undo them.
6. Optional confluence.
Bearish RSI or MACD divergence into the head, where price makes a higher high but momentum does not, adds weight to the loss-of-momentum story. Treat it as supporting evidence, never as a substitute for the break.
One rule sits above the rest: a pattern is a possibility until the neckline breaks, and a setup only after it. Anything before that is anticipation.
How to trade it: entry, stop, and target
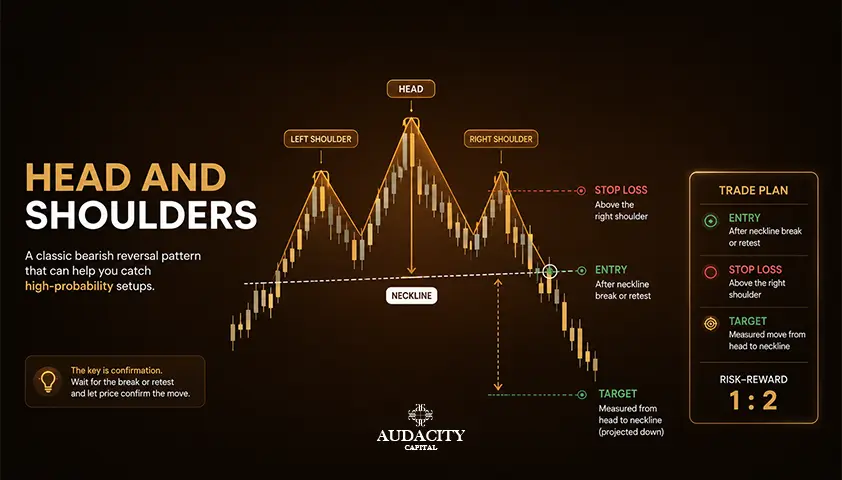
Here is the practical core. Read this as one plan for the regular pattern, and remember the inverse flips every direction in it.
Confirmation
The trade is live only once price breaks the neckline, below it for the regular pattern and above it for the inverse.
A candle that closes beyond the neckline is far stronger evidence than an intrabar poke that snaps back. A pickup in volume on the break adds confidence. No break, no trade.
Entry method 1: on the break
Enter as the breakout candle closes beyond the neckline. This gets you into the move early and never leaves you behind if the market runs. The cost is exposure to a false breakout, where price closes beyond the line and then reverses straight back through it.
Entry method 2: on the retest
Wait for price to pull back to the broken neckline, which often flips from support to resistance on a top pattern, and from resistance to support on the inverse.
This retest, sometimes called a pullback or throwback, usually offers a tighter stop and a better reward-to-risk. The trade-off is that some patterns never come back, and you miss them.
Neither method is objectively better. It is a style and risk decision, and consistency matters more than the choice itself.
Stop-loss placement
For a regular pattern, place the stop above the right shoulder for a tighter risk profile, or above the head for a more conservative invalidation that survives more noise. The inverse flips both below.
Add a small buffer beyond the structure, since exact highs and lows attract wicks. Whichever you choose, the level defines your invalidation point before you enter, not after.
Target: the measured move
The classic price target is a measured move. Take the vertical distance from the head to the neckline, then project that same distance from the breakout point, down for a regular pattern and up for the inverse.
Use prior structure, round numbers, and Fibonacci levels as intermediate checkpoints, because price frequently pauses at them.
The measured move is an estimate of potential, not a promise, so scaling out partially or trailing a stop as the move develops is a reasonable way to manage it.
Reward-to-risk and sizing
Compare the distance to target against the distance to your stop before you commit. If the target is barely wider than the risk, the setup is not worth taking regardless of how clean the shape looks.
Size the position so a single failure is affordable and forgettable, because failures are a normal part of trading reversals.
Element | Regular (bearish) | Inverse (bullish) |
Trigger | Close below neckline | Close above neckline |
Entry option A | On the breakout close | On the breakout close |
Entry option B | On retest of neckline as resistance | On retest of neckline as support |
Stop (tighter) | Above right shoulder | Below right shoulder |
Stop (conservative) | Above head | Below head |
Target | Head-to-neckline distance projected down | Head-to-neckline distance projected up |
For example: a pair rallies to 1.1000 (left shoulder), pulls back to 1.0900, pushes to 1.1100 (head), pulls back to 1.0910, then stalls at 1.1010 (right shoulder).
The neckline sits around 1.0900. Price closes at 1.0870, below the line. The head-to-neckline distance is 200 pips, so the measured target is roughly 1.0700.
A stop above the right shoulder at 1.1040 gives about 170 pips of risk for 170 pips of reward, which is thin. A retest entry near 1.0900 with the same stop improves that materially.
That comparison, not the shape, decides whether the trade is worth taking.
Does it actually work? An honest look at reliability
The success-rate trap:
You will see figures like 93% or 96% attached to this pattern. Those numbers usually measure whether price moved at all in the predicted direction after the break, which is a very low bar.
That is a completely different claim from whether price reached the measured target, yet both get quoted as if they were the same statistic.
When the denominator is target-hit rather than any-favorable-movement, published results cluster closer to 60%, with studies spanning roughly 50% to 81% depending on market, period, and how strictly the pattern was defined.
For the inverse head and shoulders in particular, a pullback to the neckline after the break is common, so early drawdown on a winning trade is normal.
What the headline says | What it usually means |
"93% success rate" | Price moved at least somewhat in the expected direction after the break |
"Hits its target most of the time" | Target-hit rates are typically nearer 60%, with wide variation by market and definition |
"Reliable on any chart" | Reliability rises on higher timeframes and falls on very low ones |
"Confirmed pattern" | Confirmed only after a close beyond the neckline, not when the shape appears |
The academic split:
A 1995 paper from the Federal Reserve Bank of New York found evidence of genuine predictive power for the pattern in currency markets.
A follow-up study in 1998 examining US equities concluded that traders acting on the shape there behaved essentially like noise traders. The evidence is market-dependent, and it is notably stronger in currencies, which is one reason the head and shoulders pattern forex traders watch gets more serious academic attention than its equity counterpart.
Timeframe:
Reliability improves as you move up in timeframe and degrades on very low ones, where liquidity is thinner and false breakouts are routine.
The takeaway is not that the pattern is useless. It shifts probabilities, and probabilities are what professional trading is built on.
The edge shows up only when you demand confirmation, respect the timeframe, and control risk on every trade. That is a workable foundation, not a discouraging one.
When the pattern fails, and how to handle it
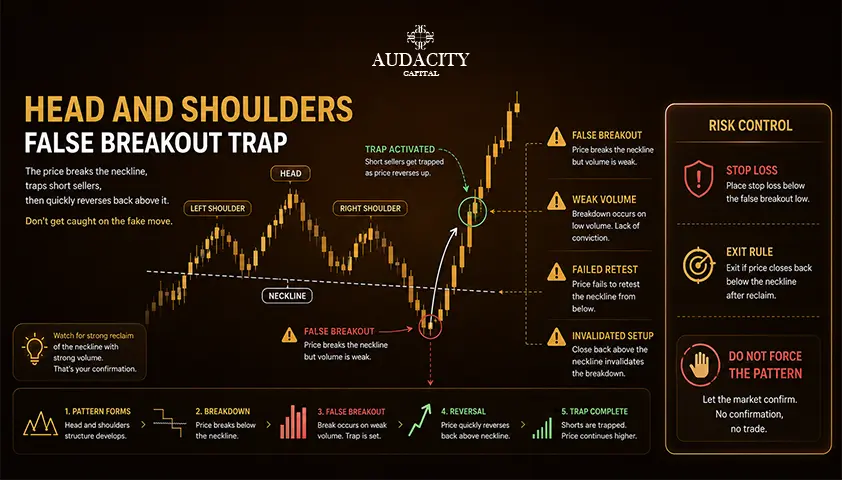
Failure is part of the pattern, not evidence you read it wrong. Learn the four common outcomes and how to respond to each.
1. False breakout (fakeout).
Price breaks the neckline, then reverses decisively back through it. A close back inside the pattern is your invalidation. Take the loss at your predefined stop rather than negotiating with the chart.
2. Confirmed failure.
For a regular pattern, price reclaims and closes back above the right shoulder. The bearish thesis is done. That failed pattern often becomes a signal in the opposite direction, since trapped sellers have to cover, and it can be traded as such, with its own entry, stop, and target defined before you act.
3. Second right shoulder.
The pattern extends and builds an extra shoulder, which happens more often in strong trending markets that refuse to roll over quickly. Redraw the structure and reassess rather than forcing the original trade to work.
4. Long stall.
Price breaks the neckline and then goes sideways with no follow-through. Treat this as unresolved rather than as a signal. If the trade is not doing what the plan expected, reducing exposure or standing aside is legitimate.
The protection in all four cases is identical: wait for confirmation, keep your stop where you put it, and size so that a controlled loss changes nothing about your week.
Common mistakes traders make
These are behavioral errors rather than pattern failures, and each one is avoidable.
1. Seeing the pattern everywhere: Drawing three peaks in sideways chop produces a shape without a thesis. Fix: confirm a genuine prior trend before you label anything.
2. Working on too low a timeframe: Five-minute patterns look convincing and deliver inconsistently. Fix: favor higher timeframes where structure carries more weight.
3. Entering before the break: Anticipating the right shoulder feels clever and often is not. Fix: treat the pattern as unconfirmed until the neckline breaks.
4. Ignoring the volume signature: A break on fading participation is weaker than one with a volume expansion behind it. Fix: use volume as confirmation, not as an afterthought.
5. Trusting inflated success rates: Trading a 60% probability with a 95% mindset leads to oversized positions. Fix: plan around realistic odds.
6. Moving or skipping the stop: Widening a stop mid-trade converts a small planned loss into an unplanned one. Fix: define invalidation before entry and honor it.
7. Chasing a late entry: If price has already covered most of the distance to the measured move, the reward-to-risk has gone. Fix: skip it and wait for the next structure.
8. Trading the shape without context: A pattern against a strong higher-timeframe trend, or right into a major support and resistance zone, is a lower-quality setup. Fix: check the larger picture before committing.
Conclusion
Used well, the Head and Shoulders Pattern is a structured way to trade trend exhaustion.
That means confirming a real prior trend, drawing the neckline honestly, waiting for the break instead of predicting it, entering on the break or the retest according to a plan you already wrote down, setting the stop at a true invalidation level, and projecting a measured move as a target rather than a promise.
Lean on higher timeframes, respect that a large share of setups will fail, and let position sizing make those failures routine. The headline win rates are folklore. A confirmed, well-managed setup with defined risk is something closer to a real edge.
If you have learned a pattern-based approach and tested it properly, a funded account such as the ones offered through Audacity Capital is one route to trading it with company capital instead of your own savings.
That is an option, not a shortcut. The skill and the discipline still have to come from you.
FAQ
There is no fixed duration. A valid pattern can form over hours on an intraday chart or over months on a weekly chart, and larger patterns on higher timeframes tend to carry more weight. The setup stays live until price either breaks the neckline, activating it, or reclaims the right shoulder or head, invalidating it. If it drifts sideways for a long stretch, treat it as unconfirmed rather than tradeable.
In a triple top the three peaks sit at roughly the same level. In a head and shoulders the middle peak is clearly higher than the two shoulders. Both are reversal patterns confirmed on a support break, but the head and shoulders shape reflects a more pronounced loss of trend momentum.
Usually it acts as a reversal, but the same shape can occasionally form as a pause within a trend and resolve in the original direction. Context decides it. Confirm the prior trend and the neckline break, and treat an out-of-context shape with more caution than a textbook pattern appearing after a mature trend.
Yes. Most charting platforms, including TradingView, offer pattern-detection or drawing tools, and scanners and algorithms can flag the shape. Auto-detection is noisy and often tags lookalikes in sideways chop, so use it as a first filter and verify the prior trend, symmetry, volume, and neckline break yourself.
You have two reasonable choices: wait for a retest of the neckline, which often provides a lower-risk second entry, or stand aside if price has already run most of the way to the measured target. Chasing a late entry destroys the reward-to-risk, and forcing a trade after the move is a common way to turn a good pattern into a bad trade.
Being widely known does not automatically erase it, because it reflects real crowd behavior around trend exhaustion and traders continue to act on it. Edges do erode, though, and false breakouts are common on lower timeframes with thinner liquidity. Treat it as one probability-shifting tool among several, confirm it, and always define your risk.

Handa nang maglapat ng disiplinadong panganib sa crypto? Galugarin ang mga bagong instrumento ng crypto ng Audacity Capital at dalhin ang iyong diskarte sa pangangalakal.
Matuto PaNewsletter
Sumali sa aming newsletter.
Sumali sa Aming Social Community

Simulan ang Iyong Paglalakbay Ngayon Gamit ang Aming Libreng Pagsubok
Ipagmalaki ang iyong mga kasanayan at tagumpay sa pamamagitan ng mga sertipiko at makakuha ng pagkilala para sa iyong pagsusumikap at dedikasyon mula sa mga potensyal na mamumuhunan at kasamahan.
Libreng PagsubokMga Kaugnay na Artikulo
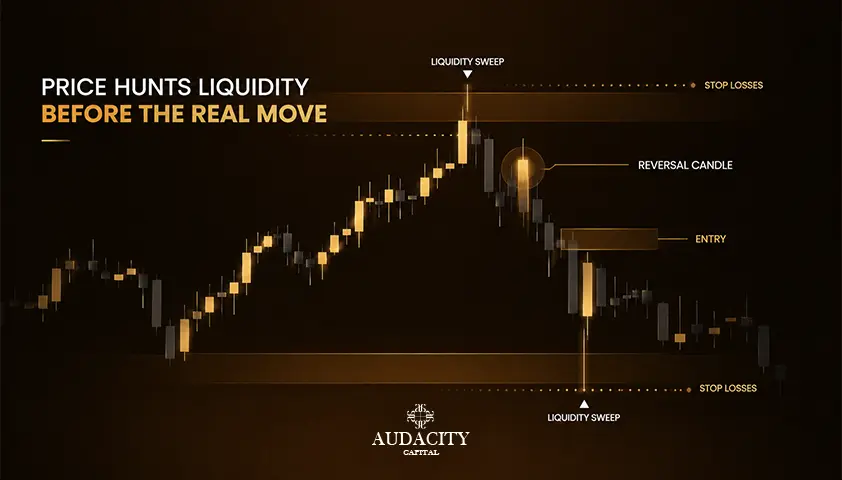
Liquidity Sweep Trading: A Complete Guide
Learn what a liquidity sweep is, how to identify valid setups, and how to trade liquidity sweep strategies with confirmation, risk management, and real examples.


Average Daily Range (ADR): How to Use It for Trading
Discover how to judge intraday room to move and set realistic targets. Compare average daily range vs. ATR to improve trade planning across all markets.
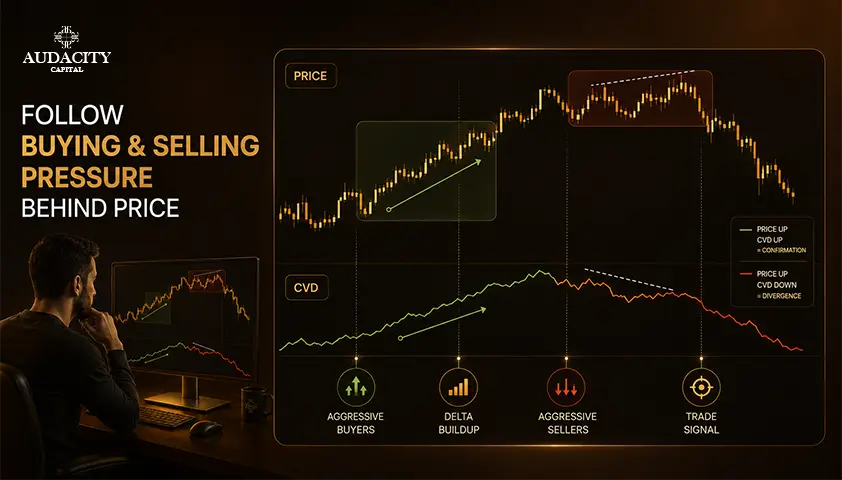
Cumulative Volume Delta (CVD): How to Read and Trade It
Cumulative Volume Delta (CVD) shows real buying vs selling pressure. Learn how CVD works, how to read divergence, and how to trade it across markets.
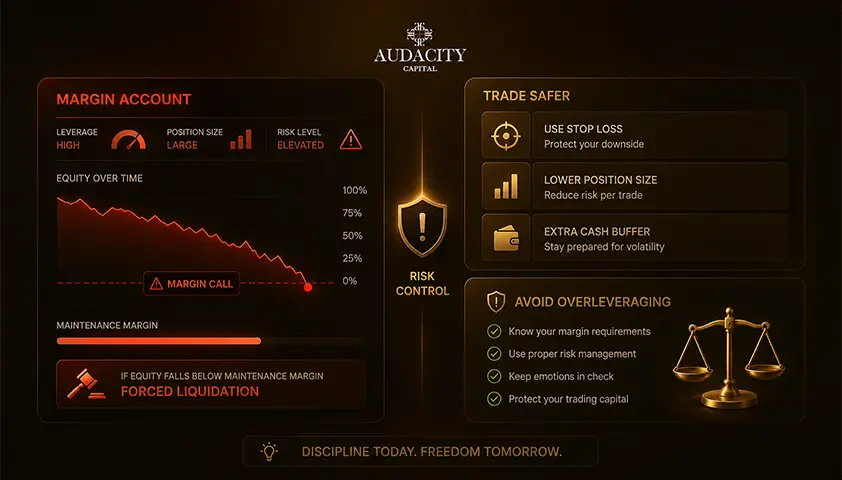
What Is a Margin Call and How to Avoid One
Understand how margin calls and stop-out levels work. Learn how maintenance requirements are calculated and how to keep your portfolio safe.