


Pin Bar Candlestick: How to Identify and Trade It


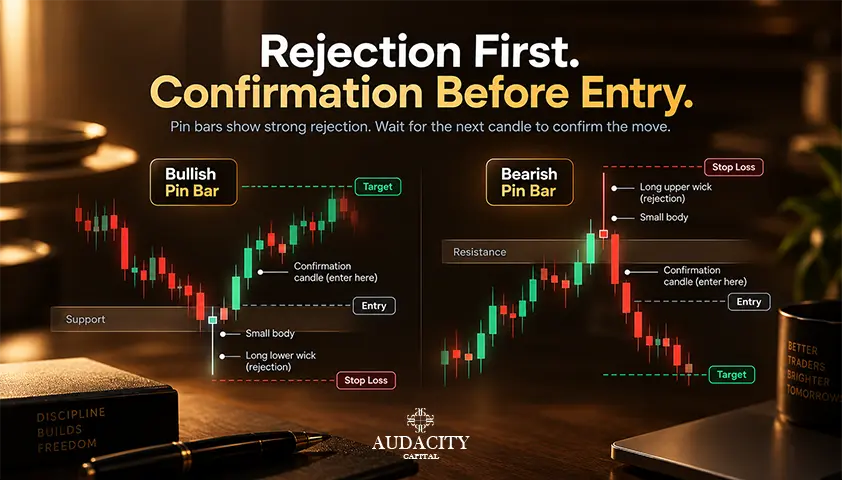
A pin bar candlestick is a single candle with three defining parts. There is a long tail on one side of the candle with a small real body close to the opposite end, and a short nose or no nose at all.
The tail is everything that matters. It reflects the level where the market entered and got rejected in the latter part of a candle that closed. This is the reason why pin bar candlesticks are discussed in terms of rejection and not direction.
The name is short for 'Pinocchio bar', an idea that has been credited to the technical analyst Martin Pring. A long tail means the market was lying about price levels and caught out before the session closed.
There is no consensus among definitions regarding the threshold. The most popular definition implies that the tail must be at least two-thirds of the entire range of the candle.
Another definition uses a criterion for the wick being twice or thrice larger than the body. Others place the body inside the outer third of the range. Those are different criteria and they yield different candles. It is better to pick any one criterion and apply it consistently.
Bullish vs Bearish Pin Bar
A bullish and bearish pin bar uses the same basic structure. What changes is the side of the candle where the long tail appears and, more importantly, what price was rejected.
A bullish pin bar has a long lower tail with the body sitting near the top of the candle. Prices moved lower during the period but failed to remain there. By the close, buyers had pushed it back towards the upper part of the range.
A bearish pin bar is the opposite. It has a long upper tail and the body sits near the bottom. Price traded higher but could not hold those levels and returned lower before the candle closed.
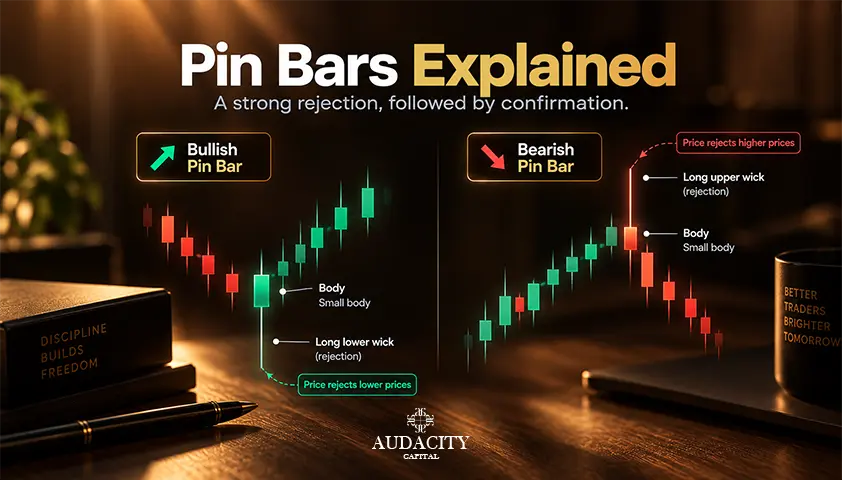
This does not mean that every lower-tailed pin bar is a buy signal or every upper-tailed pin bar is a sell signal.
A bullish pin bar appearing directly below strong resistance can still be a poor setup. A bearish pin bar sitting directly above support has the same problem. The candle only tells you where rejection happened. The surrounding chart tells you whether that rejection matters.
The colour of the real body does not change this basic reading. A lower-tailed pin bar can close slightly below its open and still show rejection from lower prices. An upper-tailed pin bar can close slightly above its open and still show rejection from higher prices.
This is why bullish and bearish are better understood as descriptions of the rejection rather than instructions to enter a trade.
The Same Candle Has Four Other Names
Here's a part of the pin bar content which often gets ignored.
Pin bar is the name for the chart pattern. The Japanese candlestick analysis assigns different names to the same formations depending on their direction and trend location.
Formation of a lower tail following the downtrend is known as the hammer, whereas the formation of the lower tail following the uptrend is known as the hanging man.
The formation of an upper tail following the uptrend is known as the shooting star, and the formation of the upper tail following the downtrend is known as the inverted hammer.
Two patterns, four names and apparently, there's nothing connecting them except for the distance.
There is no need to get too technical here. The candlestick methodology makes use of location in the naming of patterns because location influences their meaning. A trader who studies hammers and a trader who studies pin bars is studying the same candle with two methodologies.
Knowing this ensures that they are not considered as two separate methods.
Shape | Where it forms | Candlestick name | Common reading |
Long lower tail, small body on top | After a decline | Hammer | Potential bullish reversal |
Long lower tail, small body on top | After an advance | Hanging man | Potential bearish warning |
Long upper tail, small body below | After an advance | Shooting star | Potential bearish reversal |
Long upper tail, small body below | After a decline | Inverted hammer | Potential bullish reversal |
Reversal or Continuation?
The majority of traders view the pin bar formation as a reversal signal. It is the typical way this pattern is used in trading.
A pin bar turning away from a level following an extended move indicates failure to reach that level. The pattern is most effective in a ranging environment or a pullback in a larger trend.
There is also a second interpretation of this pattern that is less talked about. This is a pin bar formation in the direction of a current trend without a strong pullback before it. This candle indicates the trend consuming a temporary countertrend move rather than reversing.
How can you distinguish between them? Check out the price action before the candle formation. A pin bar after a prolonged move towards a level is one situation. The same candle in the midst of a trend is another.
The candle itself does not indicate anything. The chart around it does.
Why Location Does Most of the Work
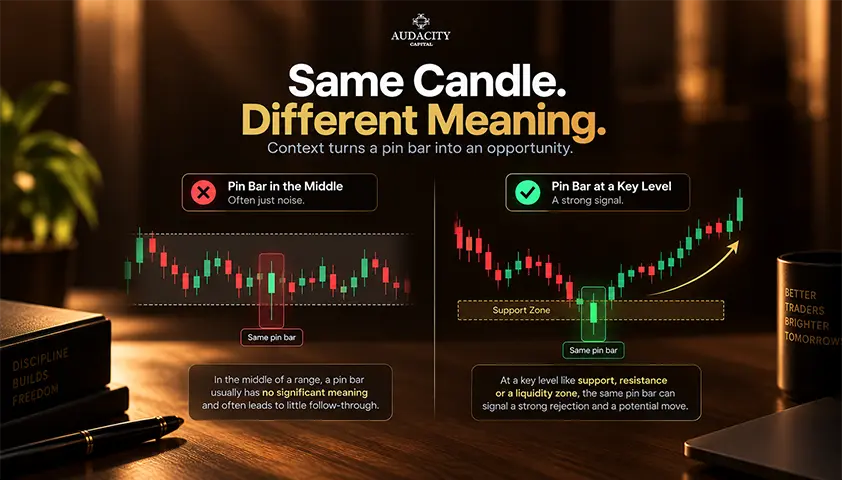
Position the pin bar in the context of rejection, not confirmation. Recognizing the pattern is simple. The real work is determining whether the rejection took place in a significant place.
Three conditions need to be met.
1. Did the tail reject a clear level?
It could be a horizontal level of support and resistance or a trend line that is holding firm.
2. Does the setup match the prevailing trend?
A perfect pin bar rejected from a strong trend could very well be an invalid pattern.
3.Does the price have room to move?
An achievable target requires having some room in front of it, not an opposite level in its way.
As is evident, what matters most is the location, not the candle. A perfectly shaped pin bar within a range is a regular candle without any information.
A regular pin bar rejecting a level that has repeatedly held its ground becomes significant if it is consistent with the general trend. This is the pattern you need to concentrate on. Most pin bars in any chart fail this test, and filtering them out is the key.
Entry, Stop and Target
There are two methods that traders use to enter the market when trading with a pin bar. Each method comes with a cost.
Entry Method 1: Break of the Nose
You place your stop just past the nose so that the trade is executed if the price moves in the expected direction. The cost here is the entry distance.
The farther the price has moved away from the tail before the entry, the lower your risk to reward on the same pin bar.
Entry Method 2: 50% Retrace
You place your limit order at the middle of the candle from the tip of the tail to the nose. You gain an advantage of a much better entry price which gives you a higher R-multiple on the same trade setup.
Some instructors use the same trade to show the distinction. It gives you around 1R when you enter at the nose and over 3R when you enter at the 50% retracement point. It is the same setup, just priced differently.
Stop
In both approaches, the stop goes slightly beyond the tip of the tail. If a move occurs through the tail, then the rejection was not successful, and the trade is not valid anymore.
The buffer size depends on the instrument and its volatility; thus, there are no pip numbers.
Target
Set your target at the first meaningful level in the direction of your trade, and choose it beforehand, rather than afterward. This is where these two entries start to differ.
The first level can be close and not allow you to get an acceptable reward ratio with a nose entry but still pay out on a 50% retrace entry on the same setup.
Any particular risk percentage and/or minimum reward ratio that you find somewhere else is just a personal guideline by the trader who posted it and not a standard.
Break of the nose | 50 percent retrace | |
Order type | Stop order beyond the nose | Limit order at the candle midpoint |
Fills | Only if price continues | Only if price retraces |
Entry price | Worse, further from the tail | Better, closer to the tail |
Effect on R-multiple | Lower on the same setup | Materially higher on the same setup |
Main drawback | Wider stop, weaker reward ratio | A large share of orders never fill |
The Trade-Off in the 50% Entry
The 50% retracement is clearly the choice to make. The R-multiple is higher, so how could anyone possibly prefer to go with the worse price at the nose?
The real cost is the fill rate, which is around half the time on average and sometimes even more for certain pairs, the price will not retrace sufficiently to hit the limit order.
Sometimes you end up missing out on the move altogether. This is contingent upon the pair and the rules.
Take the logic one step further since most of the articles stop there. The setups that do not get filled may actually include the very setups where the price exits quickly without ever looking back. And those are often the strongest moves.
Thus, by systematically passing over the best setups, the 50 % entry pays for itself through a superior price on the ones that it catches. They’re both real and they act in opposite directions.
Neither of the two approaches can be said to be better from a theoretical standpoint. The nose entry covers all setups, but at a worse price. The 50% entry only covers some of them, but at a better price.
Take note of what setups your favoured system leaves out. This is the only way of telling which side of the spectrum you are.
Common Pin Bar Trading Mistakes
The easiest mistake is trading the candle instead of trading the setup.
Pin bars are easy to find because almost every chart contains long-tailed candles. That does not make every one of them useful.
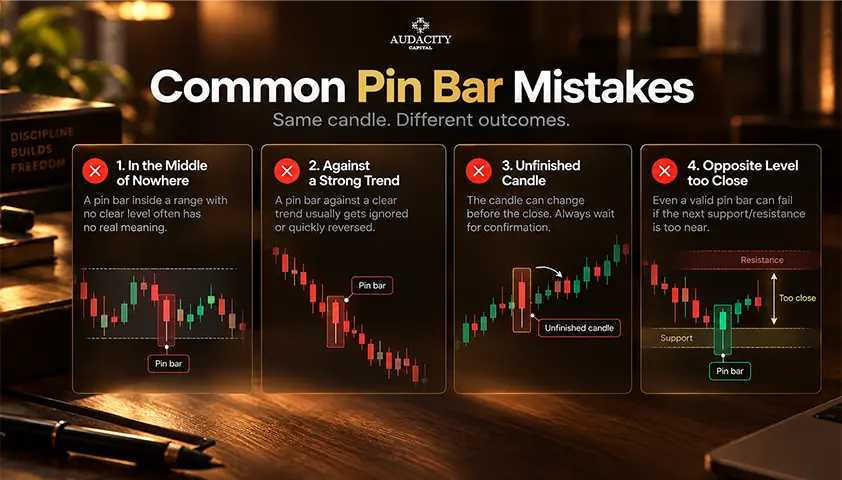
1. Trading Every Pin Bar
A long tail alone is not enough. A pin bar in the middle of random price movement has very little context behind it.
The first question should not be whether the candle has the correct proportions. The first question should be what level the tail rejected.
2. Ignoring the Direction of the Market
A pin bar can look perfect and still sit against a strong trend.
Trading every bullish pin bar during a strong decline or every bearish pin bar during a strong advance means relying on one candle to stop an entire move.
That can happen. It is not something the candle itself can promise.
3. Entering Before the Candle Closes
A pin bar only becomes a pin bar once the candle has closed.
A long lower tail halfway through the period can disappear if the market falls again before the close. The same applies to an upper tail.
Entering while the candle is still forming means trading a pattern that may not exist when the period ends.
4. Ignoring the Next Level
A valid rejection does not automatically mean there is enough room for a trade.
If a bullish pin bar forms at support but resistance is sitting just above it, the setup can still have poor reward potential. The same applies to a bearish pin bar with support immediately underneath.
This is why the target needs to be considered before the entry.
5. Changing the Rules After Seeing the Outcome
If one pin bar requires a two-thirds tail and another is accepted with a much smaller one because the trade happened to work, the definition is no longer doing anything useful.
Pick the criteria first and apply the same criteria to both winning and losing examples.
The Candle That Only Exists on Your Chart
This is the underlying principle nobody ever speaks of. Pin bars occur because of the range between the opening and closing of a candle. And this range is nothing more than a convention of the chart display, not a real market event.
If the same price action is split at another boundary, you will have a completely different candle. A daily pin bar is formed from four four-hour candles.
Switch to the four-hour chart and the same rejection signal might look like two normal candles without any pin bars at all. The pattern didn’t exist in the price; it was in how the chart sliced the price action.
The forex market has an additional wrinkle to this. Currencies trade non-stop and the daily close is determined by the platform provider.
Providers utilize different server times. This implies that a daily pin bar that appears in one chart for a particular market may not be present in another chart for the same market.
It is simple to verify, and most traders get surprised the first time they observe this. None of the above is justification to give up on the pattern.
Rather, it is justification to consider the candlestick as a summary of rejection and not an event itself. The level that is rejected becomes more important than the pattern that is performing the rejection. It brings you straight back to the location.
What the Evidence Says
You will find pin bar articles that open by promising a remarkable win rate. Very few of them cite anything to back it up.
The closest thing to the evidence lies under the alternative names.
Statistical studies of candlestick patterns are the hammer, hanging man, shooting star, and the inverted hammer. As discussed earlier, these candlestick formations are identical in shape but different based on context.
What that research reports tends to be far more modest than the trading literature suggests. If you want a figure, go to the primary source, read the sample size stated alongside it, and treat any number without a stated sample as marketing.
The pattern describes something genuine: price reached a level and was pushed back. Whether that makes a given setup tradable depends on the level, the trend and your own record, not on a published win rate.
The only performance figure that applies to you is the one you build from your own results.
Conclusion
A pin bar candlestick is a compact record of a level being tested and rejected, and that is real information worth reading. It is also a single candle whose existence depends on where the chart drew its boundary.
That is why the level matters more than the shape, and why most pin bars are worth discarding without a second look.
Put it to the test. Go back through a month of the instrument you actually trade and mark every pin bar. Split them into two groups: those that rejected a level in the direction of the trend, and the rest.
The ratio between those two groups is the honest picture of how often this setup is genuinely available to you.
One practical note. Since the daily close depends on your platform's server time, it helps to know exactly which close you use.
Audacity Capital's simulated evaluation accounts run on MT5 and DXTrade. That gives you somewhere to check the close time and test these filters before any capital is involved.
Frequently Asked Questions
The pattern forms on every timeframe. Higher timeframes produce fewer of them, and those tend to carry more weight because they summarise more trading activity.
Some educators restrict one specific combination pattern to the daily chart as a personal rule, but that is not a general requirement for pin bars themselves.
Not much. The tail and the position of the body do the work, so a bullish pin bar can close with a bearish body and still be perfectly valid. Some traders treat a close in the expected direction as mild extra confirmation, but it is a minor factor at most.
No. A pin bar does not need a nose, because the open or close can sit right at the extreme end of the candle. The nose only matters in relation to the tail and body proportions, not as a required feature in its own right.
It describes a pin bar forming immediately after an inside bar at a key level. Practitioners often treat it as a stronger signal than either pattern alone, though that claim is not supported by published data. We cover the inside bar in a separate article.
The pattern appears wherever candles are drawn, so it shows up across indices, metals and crypto. It is most meaningful on liquid instruments, where a rejection reflects real participation. On thinly traded instruments, a long tail can be a single print rather than a genuine rejection.

Kriptoya disiplinli risk uygulamaya hazır mısınız? Audacity Capital'in yeni kripto enstrümanlarını keşfedin ve ticaret stratejinizi getirin.
Daha Fazla BilgiBülten
Yeniliklerden haberdar olmak için bültenimize katılın.
Sosyal Topluluğumuza Katılın

Bugün Yolculuğunuza Başlayın Ücretsiz Denememizle
Becerilerinizi ve başarılarınızı sertifikalar aracılığıyla gururla sergileyin ve potansiyel yatırımcılardan ve akranlarınızdan sıkı çalışmanız ve özveriniz için takdir alın.
Ücretsiz Denemeİlgili Makaleler

GTC in Trading: What Good Till Cancelled Orders Mean and How to Use Them Properly
Learn what GTC means in trading, how Good Till Cancelled orders work, when to use them, and the risks of leaving pending orders active.

Inside Bar Pattern: Meaning, Examples and Trading Rules
Learn how to identify the inside bar pattern, compare entry and stop rules, and assess false breakouts before testing a trading strategy.

How Many Trading Days in a Year?
How many trading days are there in a year? See the number of U.S. stock market trading days in 2026, monthly totals, holidays and how markets differ.

Trade Deficit Explained: Causes, Effects and Markets
What a trade deficit is, what actually causes it, why it can widen in a strong economy, and why the textbook currency rule often fails.