


All About the Shooting Star Candlestick Pattern – Learn to Decode It


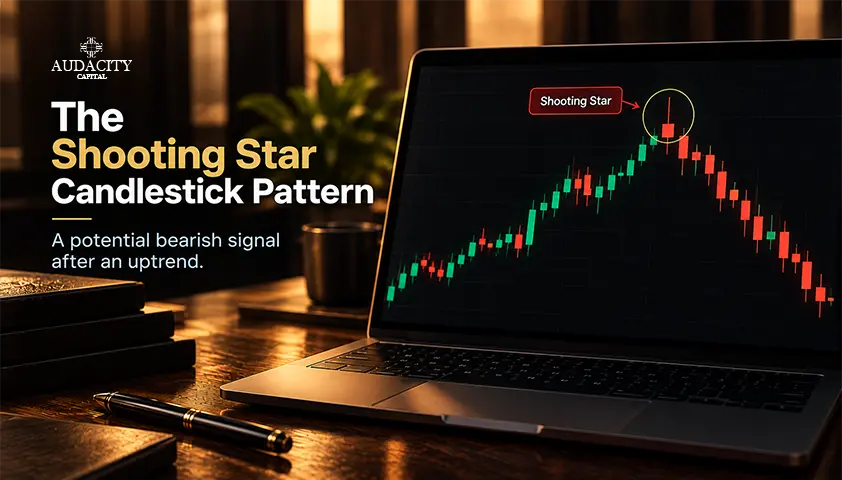
The shooting star candlestick pattern is a candle formation, a potential signal telling about change in direction after prices have been rising. Shooting star has a small body towards the lower end along with a long upper wick. It depicts that the price moved higher during the session but couldn’t hold those gains for long.
When it forms after an uptrend, the shooting star pattern candlestick is bearish. But traders should not take it as a sign that a fall is certain. It is important to look at the surrounding price movement and analyse if the market shows further signs of weakness.
What Is a Shooting Star Candlestick Pattern?
A candlestick pattern shooting star is a single candle that traders look for near the top of a price rise. The shape is fairly easy to recognise, but the important part is what happened during the session. Buyers pushed the price higher, but the market could not hold on to most of that advance before the candle closed.
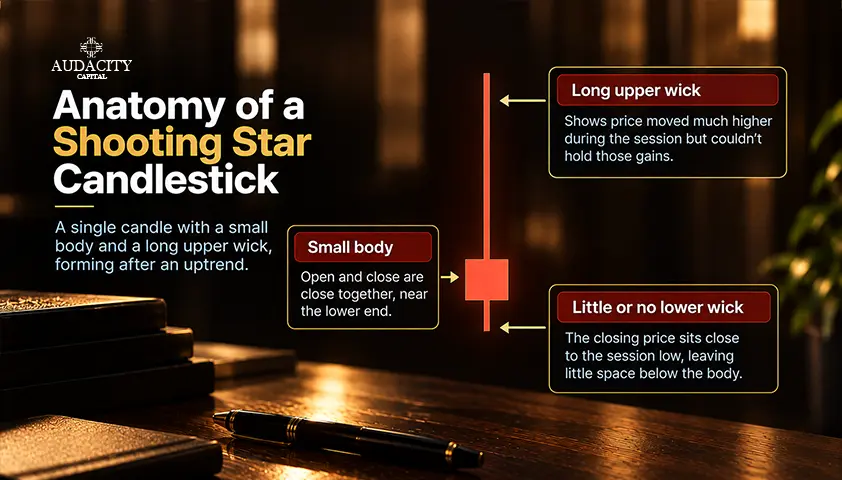
There are three features to look at:
- Small body: The opening and closing prices are close together, with the body sitting near the lower end of the candle's range.
- Long upper wick: The price moved well above the opening and closing prices before falling back. The wick is long, around twice the length of the body, or even longer.
- Little or no lower wick: The closing price sits close to the session low, leaving little space below the body.
The upper wick is the part that draws attention. It shows that higher prices were reached, but buyers were unable to keep the market near those levels. Sellers may have entered, or traders who already held the stock may have decided to take profits.
A shooting star can be red or green. Red just means it closed below where it opened, green means it closed a bit higher. Either way, color alone doesn't change the bigger picture - you still need to look at the wider chart.
How to Identify a Shooting Star on a Chart?
A Shooting Star only matters after a proper run-up. If the climb looks like it's fading, then the candle is worth a second look.
There has to be a rally before it.
1. If price wasn't moving up into it, it's not a candlestick pattern shooting star. You're looking for a clear up move that looks stretched or near a high.
2. The shape is the giveaway.
- Small real body tucked at the bottom of the candle.
- Long wick on top, usually 2-3 times the size of the body.
- Very little or no wick at the bottom.
- Can be red or green; color doesn't matter much. Red just looks a bit weaker.
3. Location matters more than shape: It should form right near the top of that up move, ideally where price has struggled before (old high, resistance zone, and round number). Same shape in the middle of nowhere means less.
4. What you DON'T want to see: If the lower wick is long too, that's not it. If the body is big and in the middle, that's not it. If it's after a downtrend, that's an inverted hammer, not a candlestick pattern shooting star.
Timeframe changes everything. A long upper wick on a one-minute chart might just be a quick spike that goes nowhere and doesn't really move the wider market. On a daily chart, that same wick means something else; it shows buyers and sellers fighting it out for hours.
Just because a candle matches the shape doesn't mean it has to be traded. Some will appear in the middle of a range, while others may form during a strong uptrend that continues for several more sessions. The purpose of identification is to find a possible warning, not to decide the trade before the rest of the chart has been considered.
Shooting Star vs Inverted Hammer and Hammer
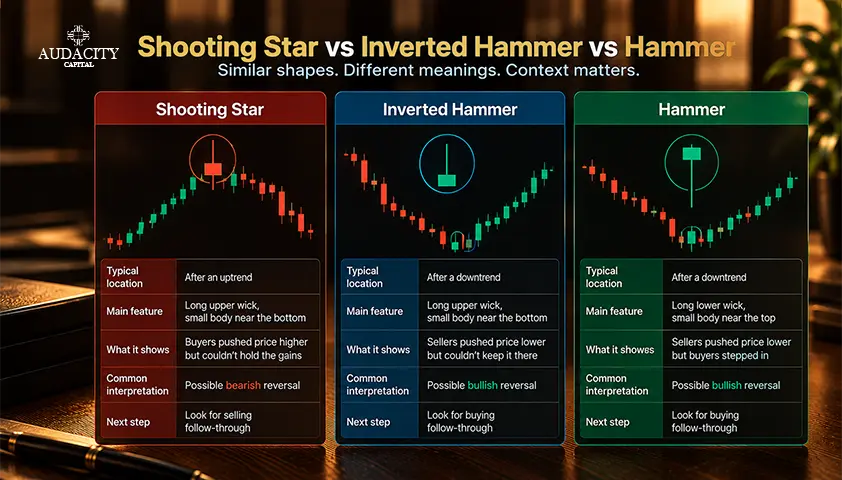
A shooting star, an inverted hammer and a hammer are often discussed together because they share some features. However, their shapes and positions on the chart are not all the same. The previous price movement is particularly important when deciding which formation is present.
The shooting star hammer candlestick pattern comparison helps explain why the same-looking candles can have different meanings on a chart.
Pattern | Typical location | Common interpretation |
Shooting star | After an uptrend | Possible bearish reversal |
Inverted hammer | After a downtrend | Possible bullish reversal |
Hammer | After a downtrend | Possible bullish reversal |
A shooting star and an inverted hammer have a similar shape. Both have a small body near the lower end and a long upper wick. The difference is that the shooting star appears after prices have risen, while an inverted hammer appears after a decline.
A hammer has a different structure. It usually has a small body near the upper end of the candle and a long lower wick. It may suggest that buyers stepped in after prices fell during the session.
If you put a candlestick pattern shooting star next to a hammer, the shape won't tell you much on its own. You have to look at the trend leading in. That is what gives the candle its usual read, and the price action after is what shows whether that read still holds. When comparing the shooting star hammer candlestick pattern, the trend leading into the candle remains an important part of the interpretation.
How Traders Confirm a Shooting Star Signal?
Shooting star pattern candlestick may be worth watching, but traders generally look for more evidence before treating it as a reversal. The candle itself shows buyers pushed price up and then lost it in the same session. What comes next tells you if that selling pressure has more to go.
- Pay attention to the next candle. A bearish close below the shooting star low points toward a weakening uptrend. If price climbs above the shooting star high, that bearish reading doesn't look as solid.
- Check the resistance zone as well. If the candle forms close to a previous top where price found it tough before, that rejection deserves a closer look. Resistance is an area where price may find it harder to push higher, although it doesn't always work. You can read more about support and resistance in trading.
- Look at volume and momentum. A jump in volume can mean more participation when that rejection happened. Tools like RSI and MACD may help to see what momentum is doing. However, none of these measures proves that prices must fall.
A useful way to review a shooting star is to ask:
- Did the price rise before the candle appeared?
- Did it form near a level that previously acted as resistance?
- Did the following candle support the bearish view?
- Did volume or momentum provide additional context?
All of this helps to assess the picture more carefully, instead of relying on a single candle as a trade signal.
A Hypothetical Shooting Star Example in the U.S. Stock Market
Picture a stock listed on the New York Stock Exchange. It has moved up from $90 to around $105 over several sessions and is now near a resistance area at $108, where price had a hard time pushing higher in the past.
That day, it opens at $104, goes up to $108, comes down to $103.80, and closes at $104.50. You get a small body and a long upper wick. It shows buyers tried higher, but the advance did not hold into the close.
What happens next can change how traders read the formation.
- Price moves lower: The next session closes at $101.50, below the shooting star's low. This may support the view that selling pressure is increasing.
- Price continues higher: In the following session, price goes over $108 and finishes at $108.50. This makes the bearish interpretation less convincing, since buyers pushed beyond the previous high.
The example shows why traders should not assume that a shooting star will always lead to a decline. The first candle records what happened during one session. The next price movement provides further information about whether the market is turning or continuing its earlier rise.
These prices are illustrative only and do not describe an actual stock or trading opportunity.
How Traders Approach Risk When Using a Shooting Star?
A shooting star near resistance doesn't mean the trade will work. That is why it is useful to know how much you are willing to risk before entering.
Some traders place a stop above the high of the shooting star if they are short. The thought is that a push above that high weakens the bearish case. Still, a stop loss can't promise you will get out at that exact price. Fast moves or gaps can cause a worse fill.
How much you trade matters as well. If there is more distance between entry and stop, you may need to take a smaller position to stay within your planned loss.
Before acting on the pattern, traders can consider:
- Invalidation: At what price would the original idea no longer make sense?
- Position size: How much could be lost if the stop is reached?
- Profit target: Is there a sensible price level based on the wider chart?
- Short-selling costs and risks: Are shares available to borrow, and what fees or margin conditions apply?
A fixed profit target does not automatically follow from the shape of the candle. Traders should consider the market structure and their own plan instead.
The U.S. Securities and Exchange Commission explains that short selling can result in substantial losses if a stock rises, including theoretically unlimited losses on an uncovered short position.
This is one reason a chart pattern should not replace a broader risk-management approach. You can also review Audacity Capital's guide to risk management for day traders.
Advantages and Limitations of the Shooting Star Pattern
A shooting star can make a chart easier to read by drawing attention to a session where the price moved higher but failed to hold most of the advance. When it appears near a previous high, traders may have a reason to watch the next few sessions more closely.
There are limits to what this formation can tell us, though. It does not confirm that sellers will remain in control, and it does not provide a fixed entry, stop-loss or profit target.
Potential use | Main limitation |
Notice a rejection of higher prices | The rejection may be temporary |
Identify a possible bearish reversal | The wider uptrend may continue |
Focus attention on a resistance area | Resistance may be broken |
Decide what price action to review next | The candle cannot predict the next move |
That is what makes the shooting star a starting point for further checks. Traders can frame a question about the market, but the price action that follows determines if the original idea continues to make sense.
Wrapping Up.
At its core, a shooting star is useful because it points out when a rally might be running out of gas. But it's still just one candle. Where it forms, what the trend was doing before, and what price does next - that's what decides if it's worth paying attention to. Looking at those pieces helps you read it without assuming every shooting star means price will fall.
FAQs
After an uptrend, a shooting star leans bearish. It shows buyers pushed price up, but they lost control before the close.
A shooting star, realistically, is just context. It signals sellers were active up there, but that doesn't equal ongoing control. Wait for price to tell you if that rejection holds up.
Yes, it can. Traders get hung up on red vs. green, but what really matters is that long wick on top. Green just means it closed a bit higher than it opened, but buyers still failed to hold the highs.
Same candle, different neighborhood. Uptrend + that shape = shooting star, potential bearish shift. Downtrend + that shape = inverted hammer, potential bullish shift.
On its own, not that reliable. It's one candle. It gets more useful when it's right at a level where price already struggled, and then you actually see follow-through to the downside.
The shooting star itself is always discussed as a bearish pattern. There's no bullish shooting star candlestick pattern version with the same name. The similar-looking bullish one lives at the bottoms, not the tops.

هل أنت مستعد لتطبيق مخاطر منضبطة على العملات المشفرة؟ استكشف أدوات التشفير الجديدة من Audacity Capital واجلب استراتيجية التداول الخاصة بك.
اعرف المزيدالنشرة الإخبارية
انضم إلى نشرتنا الإخبارية.
انضم إلى مجتمعنا الاجتماعي

ابدأ رحلتك اليوم مع تجربتنا المجانية
اعرض مهاراتك وإنجازاتك بفخر من خلال الشهادات واحصل على تقدير لعملك الجاد وتفانيك من المستثمرين المحتملين والأقران.
تجربة مجانيةمقالات ذات صلة
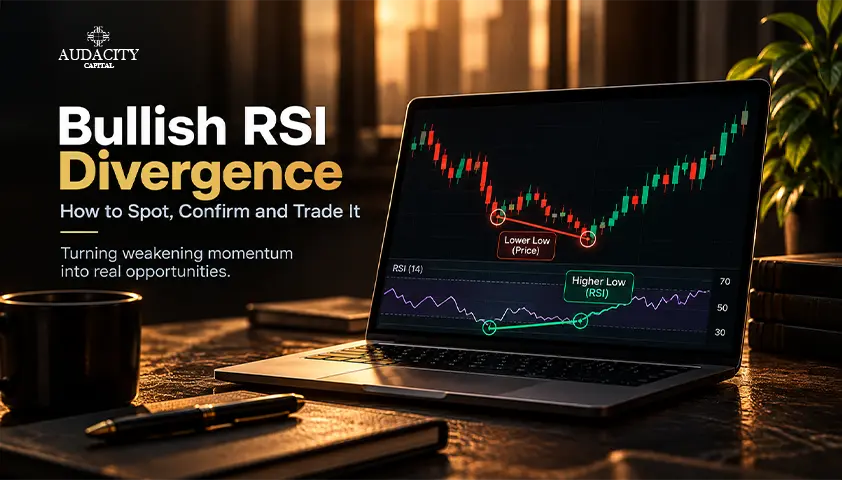
Bullish RSI Divergence: How to Spot, Confirm and Trade It
Learn how to identify bullish RSI divergence, confirm reversal signals, choose entries, set stop losses, and manage risk effectively.

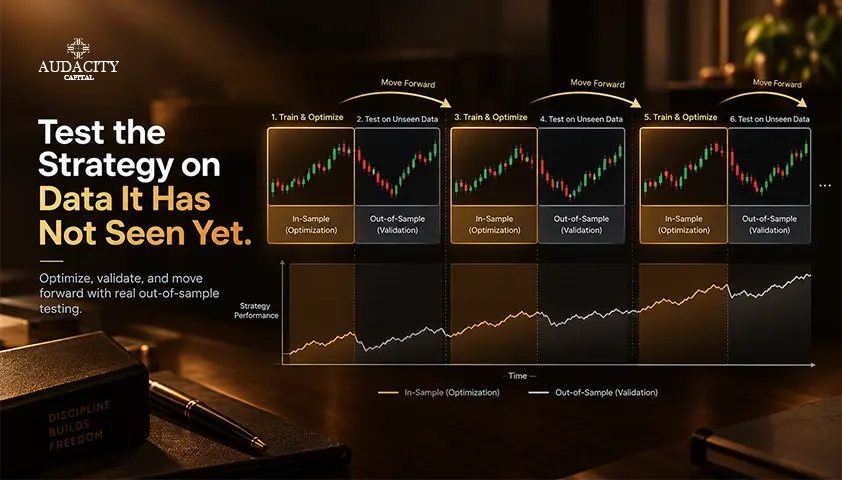
Walk-Forward Analysis in Trading: A Practical Guide
Learn how walk-forward analysis works in trading: in-sample and out-of-sample windows, rolling vs anchored designs, a worked example, and how to read results.
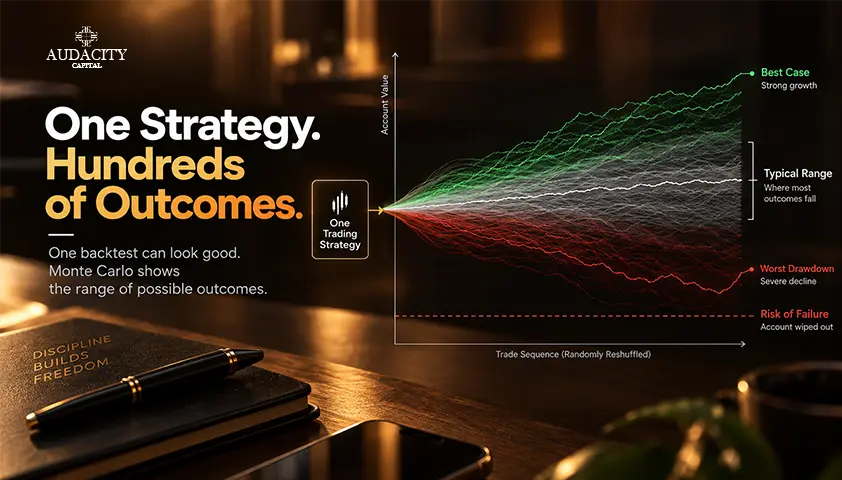
How to Stress-Test a Trading Strategy With Monte Carlo
Learn how Monte Carlo simulation reshuffles trades, estimates drawdown and losing-streak ranges, and tests a strategy beyond one backtest.
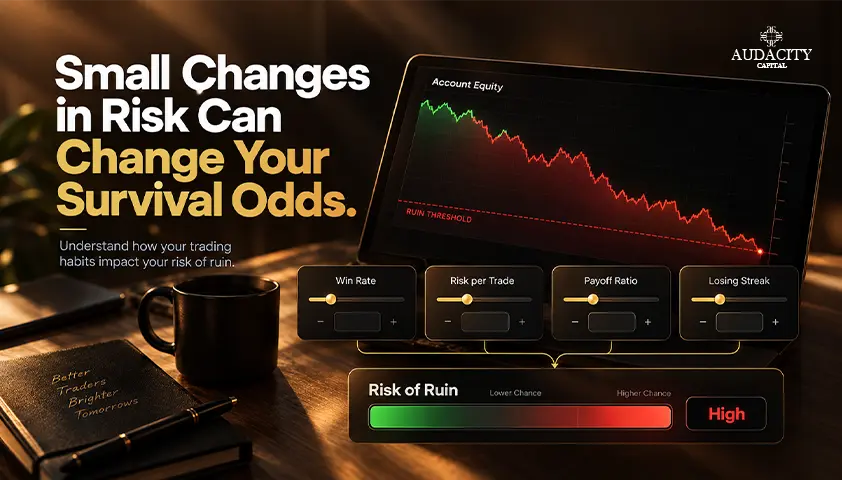
Risk of Ruin in Trading: Formula, Examples and How to Reduce It
Learn what risk of ruin in trading means, how the formula works, what affects it, and how position sizing can reduce the chance of account failure.