


Stochastic Oscillator



Introduction
The stochastic oscillator is a momentum indicator showing how an asset compares to its recent price range. It is widely used to show overbought or oversold conditions, which can indicate momentum changes. The indicator ranges between 0 and 100, and values above 80 are considered overbought. Values below 20 are considered oversold; however, this does not necessarily mean there will be a price change.
Traders use the stochastic oscillator indicator in many markets such as forex, stocks, indices, commodities, and crypto. When used with price action, trend analysis, and other technical indicators, it can help to identify possible trade entries and exits. Knowing how to interpret the signals, how to set the parameters and knowing how to avoid any pitfalls is key in making informed trading decisions.
In this guide, you will learn how the stochastic oscillator works, how to use it in different scenarios, and common mistakes to avoid.
What Is a Stochastic Oscillator?
A stochastic oscillator is a technical analysis tool used to determine the momentum of an asset's price. The oscillator compares the last closing price with the range of high to low prices over a certain period. The indicator was developed by George Lane in the 1950s and works around the theory that the momentum of an asset's price can change before the price actually changes direction.
When traders ask, " What is a stochastic oscillator, they need to understand that a stochastic oscillator simply shows where the closing price falls within the recent range of prices. The indicator will generally move between 0 and 100. When the oscillator rises above 80, it often indicates that the asset is overbought, and when it falls below 20, it suggests it is oversold.
Price direction and momentum sound similar, but they are not. Price direction indicates whether an asset is moving higher or lower. Momentum indicates the strength of this movement. This could mean that although a currency pair may be rising overall, the momentum is starting to slow down. Using the stochastic oscillator, traders can help determine when this is happening and whether it is worth considering if there may be a reversal or continuation.
As mentioned above, the stochastic oscillator is used by traders in many markets, including forex, stocks, indices, commodities, and crypto. The indicator can provide clues as to potential trading opportunities by looking at overbought/oversold levels, crossovers, and divergence. However, it is important to look at the context of the signals being given and look for confirmation. In strong trending markets, the indicator can remain in extreme levels for long periods of time. This indicator works best when used in conjunction with other technical indicators and having a plan in place for managing risk.
How Does the Stochastic Oscillator Work?
The stochastic oscillator is used to measure where an asset's most recent closing price falls in relation to its highest and lowest prices over a given time period. This can help traders identify if price momentum is increasing or decreasing. The indicator comprises two lines, %K and %D, both of which range between 0 and 100.
%K is the quicker of the two lines and shows where the most recent closing price sits in relation to the high and low range. %D is the slower signal line, usually a moving average of %K. When the lines cross over, it can be interpreted by traders that there may be a shift in momentum. However, it is important that this is confirmed by price action.
The Stochastic Oscillator Formula
The basic formula for calculating %K is:
%K = C – Ln/Hn – Ln * 100
Where:
- C = Current closing price
- Ln = Lowest low over the selected period
- Hn = Highest high over the selected period
The formula expresses the closing price's position within the selected price range as a percentage. A reading near 100 means the close is near the period's high, while a reading near 0 means it is near the low.
Understanding the Indicator's Readings
The most common numbers used by traders are 80 and 20. If the indicator goes above 80, then it suggests that the market is overbought. If the indicator goes below 20, then it suggests the market is oversold. However, this doesn’t always mean that a reversal will happen. In strong trends, the indicator may remain at extreme levels.
Understanding how to use the stochastic oscillator indicator will help you learn how to interpret the signals from the indicator. The indicator is based on how recent the price has been, how many periods are being looked back at, and how smoothing is being used. Using faster settings may give you more signals, whereas using slower settings will help to filter out any noise but will be slower. The indicator should be used with the overall trend and other technical indicators.
How to Read the Stochastic Oscillator
Knowing how to read the stochastic oscillator can help traders identify momentum and trading opportunities. There are a number of useful signals that can be identified when using the indicator, such as overbought/oversold levels, crossovers, and divergence. These should be analyzed in relation to price action and the overall trend.
Overbought and Oversold Levels
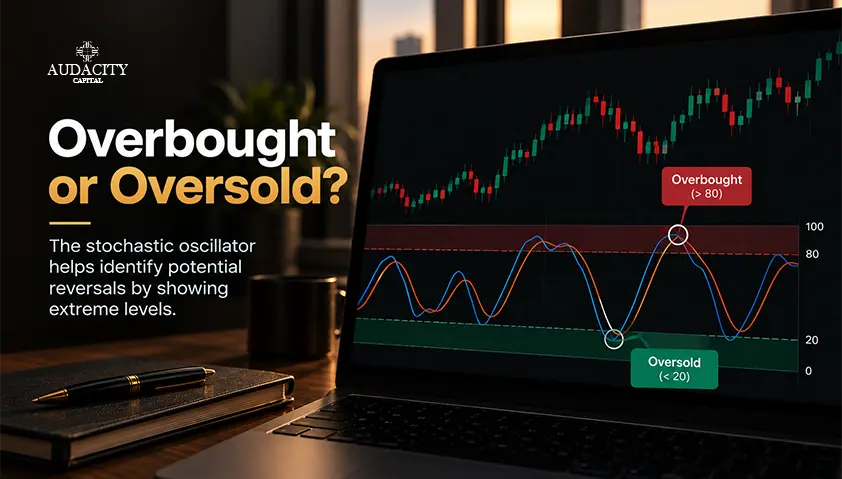
The stochastic oscillator indicator usually refers to the levels of 80 and 20. If the indicator rises above 80, this means that the closing price is at the top of its recent range, indicating bullish momentum. If it falls below 20, it means the closing price is at the bottom of its recent range, indicating bearish momentum.
This is often referred to as overbought and oversold. However, this does not necessarily mean a reversal will occur. In an uptrend, the indicator may stay above 80, and if there is a prolonged downtrend, it may stay below 20. Traders should look for further signs to back up the indicator's signal.
%K and %D Crossovers
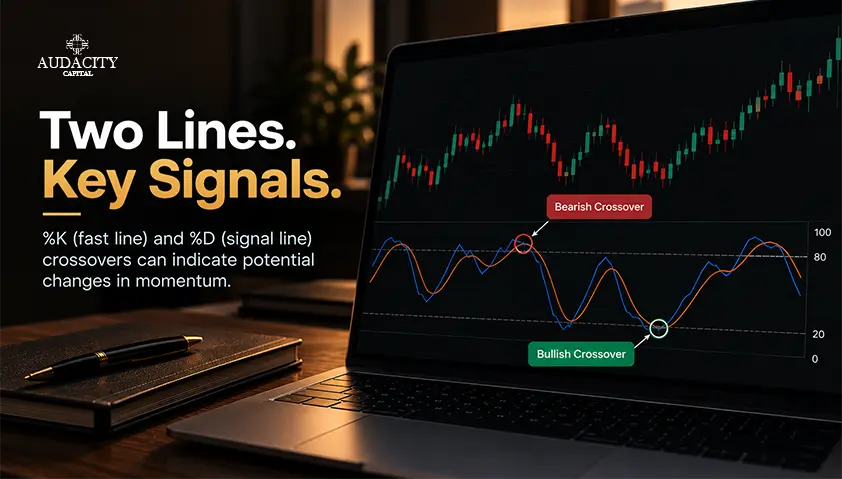
When the fast %K line crosses over the slow %D line, it is known as a crossover. If the %K crosses above the %D line, it is known as a bullish crossover, which could indicate that the upward momentum is increasing. Whereas if the %K line crosses below the %D line, it is known as a bearish crossover, meaning that the downward momentum could be increasing.
Crossovers can occur often in ranging markets and can cause many false signals. However, if they do occur near overbought or oversold levels, they may catch traders’ attention. To help make better decisions, traders can look at other factors such as support and resistance, candlestick patterns, and the overall trend.
Divergence
Divergence occurs when price moves opposite to the stochastic oscillator. It can be a sign that momentum is slowing down.
Bullish divergence occurs when price makes a lower low, and the indicator makes a higher low. It can suggest that price momentum is slowing down.
Bearish divergence occurs when price makes a higher high, and the indicator makes a lower high. It can suggest that price momentum is slowing down.
Divergence isn’t a confirmation that price will reverse. It can continue in the same direction. Traders should always look for confirmation using price action or other technical indicators.
The Indicator's Position and Direction
The actual value is of importance, but traders can also look at the direction of the %K and %D lines. If the indicator is rising and has crossed above 20, it could be a sign that momentum is returning. If the indicator is falling and has crossed below 80, it could be a sign that momentum is beginning to fade.
If the indicator is often crossing above 80 in a strong uptrend, it does not mean that the price will fall. Likewise, if the indicator is often below 20 in a downtrend, it does not mean that there will be a rebound. Traders should always consider how the indicator is performing in relation to the structure of the market, strength of trend, and other evidence.
How to Use the Stochastic Oscillator in Trading
The key to understanding how to trade using the stochastic oscillator is to use it as a momentum indicator. This means that you can utilize it in identifying potential trading opportunities based on price action and market conditions.
Identify Potential Reversals
Many traders look for values above 80 or below 20. Once you enter overbought territory, look for any signs of bearish momentum. Similarly, once you enter oversold territory, look for signs of bullish momentum.
Crossovers or reversal candles can also be used. However, it can be risky to enter a trade purely based on the indicator’s reading. Trends can be very strong, and overbought/oversold levels can persist for a long period of time.
Trade with the Trend
The stochastic oscillator can also be used to determine entry opportunities in line with the trend. Using a moving average or price structure can provide a general indication of whether the market is trending higher or lower.
In an uptrend, you may want to look for a pullback that takes the oscillator into oversold territory and watch for bullish crossovers and signs of renewed buying interest. In a downtrend, a temporary bounce into overbought territory and a bearish crossover could indicate a potential continuation setup. These signals will need to be confirmed. Not every pullback/rebound will result in a continuation.
Use Crossovers as Entry Signals
A bullish crossover occurs when %K crosses above %D. A bearish crossover occurs when %K crosses below %D. Traders can use these crossovers to help time an entry. If a bullish crossover occurs around key support and the price action indicates that buyers are becoming dominant again, then it may be worth taking a buy trade. Before entering, you should know what will cause the setup to fail and place your stop loss at an appropriate level. You should also consider your lot size before entering based on your risk limits.
Combine the Indicator with Other Tools
The stochastic oscillator can be used alongside other technical indicators such as:
Moving Averages: Can be used to determine what the overall trend is and help eliminate conflicting signals.
Support/Resistance: To determine areas of price where the momentum indicator could be more relevant.
Volume Indicators: If you have access to reliable volume data, then these can be used to determine how much participation there is.
It is important to note that sometimes using multiple indicators will not necessarily give you better results. You can end up with too many conflicting signals, which will not provide any useful information. Use indicators that have different functions and test out your strategy using historical data or in a demo account.
Stochastic Oscillator Settings and How to Adjust Them
The parameters of the Stochastic oscillator will affect how fast the indicator reacts to price movements and how often it produces signals. The best settings depend on the market, time frame, and your trading strategy. Traders should know what each parameter does before making any changes to the indicator.
The settings are commonly expressed as three numbers: the lookback period for %K, the smoothing period for %K, and the smoothing period for %D.
14, 3, 3: This is a popular configuration which strikes a good balance between sensitivity and smoothness. It can be useful for traders looking to identify changes in momentum without the indicator being overly sensitive to short-term price movements.
5, 3, 3: This will make the indicator more sensitive as it has a shorter period. This can be useful for short-term analysis. However, the indicator will give more frequent signals and may result in more false crossovers.
21, 3, 3: This will make the indicator less sensitive as it has a longer period. It can help to eliminate some market noise; however, signals may lag.
Understanding Lookback and Smoothing Parameters
The lookback period is used to determine how many candles the indicator will take into consideration when calculating the recent high-low range. Smoothing, on the other hand, helps to smooth out any fluctuation in the indicator lines by averaging their value over a set number of periods. The shorter the settings the faster they will respond and the longer it is the smoother they will be.
However, more sensitive settings do not always give better results. They can help you identify potential opportunities quicker but can cause misleading signals. Slower settings can help to filter out some noise but can cause you to enter/exit later.
Traders should experiment with various settings for their chosen market, time frame, and rules. Using backtesting and demo accounts can give you an idea of how often signals are given, when they occur, and how consistent they are. There is no one perfect setting for the stochastic oscillator. Therefore, you should make adjustments using real data.
Practical Stochastic Oscillator Trading Examples
These practical examples below can be used to understand how traders can use the stochastic oscillator alongside price action and market structure. The examples below can help with a trading decision.
Example 1: Bullish Setup in an Uptrend
Suppose EUR/USD is moving in an established uptrend, forming higher highs and higher lows. During a temporary pullback, the price approaches a support zone where buyers previously entered the market. At the same time, the stochastic oscillator falls below 20, indicating that the closing price is near the lower end of its recent range.
Rather than buying immediately, the trader waits for %K to cross above %D and looks for price confirmation, such as a bullish candlestick forming near support. If the evidence supports the setup, the trader may consider a long position.
A stop-loss could be placed below the recent swing low or the support zone, allowing for normal price fluctuations while defining the trade's invalidation point. A potential exit could be planned near the next resistance level or using a predefined risk-to-reward ratio. Position size should reflect the distance to the stop-loss and the trader's risk limit.
Example 2: Bearish Setup in a Downtrend
Consider GBP/USD in a downtrend, with prices consistently forming lower highs and lower lows. The pair rebounds toward a resistance zone where selling pressure previously emerged. During this recovery, the stochastic oscillator rises above 80 before %K crosses below %D.
The trader then checks whether price action supports a possible continuation of the downtrend. A bearish candlestick near resistance or a failure to break above the previous swing high may provide additional evidence. If the setup meets the trader's predefined criteria, a short position may be considered.
A stop-loss could be positioned above the recent swing high or resistance zone. A potential exit might be planned near the next support area, with position size determined by the stop-loss distance and acceptable risk.
N/B: These are just examples. There is no guarantee that these signals will work. The stochastic oscillator can give false indications, even if it appears to be confirmed by other indicators. You should always test any strategies and implement strict money management rules.
Common Mistakes When Using the Stochastic Oscillator
Although the stochastic oscillator can be very useful for momentum, it can cause traders to make bad decisions if they misinterpret the signals. Knowing the common mistakes will allow traders to be more careful when using the indicator to create a more consistent strategy. Some common mistakes include:
Treating overbought and oversold readings as automatic reversal signals
Just because the indicator is above 80 doesn’t mean that prices will fall, and just because it is below 20 doesn’t mean prices will bounce back. If there is a strong trend, then the indicator can stay in extreme territory for long periods of time. The trader should look for confirmation from price action, trend structure, or other technical indicators.
Trading every crossover
A bullish or bearish crossover can be a sign that momentum has changed in the market. However, not all crossovers will lead to a profitable trade. If you trade all crossovers without taking into consideration the general trend, support and resistance, and market structure, you can expose yourself to unnecessary risk. Crossovers should only be traded based on your general market context.
Ignoring false signals in sideways or volatile markets
The stochastic oscillator can be prone to producing many false crossovers during periods of sideways price movement. In addition, sudden price movements can occur around major economic announcements, leading to false signals. As such, it is important to understand the market conditions before using this indicator. It should also be understood that not all movements are necessarily due to a change in momentum.
Changing settings repeatedly to fit past results
If you are constantly changing the settings of your indicators for historical trades to look like they have worked, then you are likely to encounter overfitting. This means that the settings you find for your indicator might work well on historical data but won’t work as well in different market conditions. Ensure you have a process for testing your trades and look at the results over different periods. Don’t only base your settings on a few examples that have worked well in the past.
Trading without a Risk Management Plan
Even if you have a strong signal from your stochastic oscillator, entering trades without a stop loss, correct position sizing, or clear rules can lead to large losses. Before you enter any trade, decide on how much risk you are willing to take.
Advantages and Limitations of the Stochastic Oscillator
The stochastic oscillator offers several benefits for technical analysis, but traders should also understand its limitations before using it to guide trading decisions.
Advantages
- Easy to understand: The 0-100 scale and two lines make it fairly easy to interpret.
- Versatility: Can be used on many different markets, including forex, stocks, indices, commodities, and Cryptocurrencies. It can be used on different timeframes.
- Momentum analysis: It helps identify potential momentum shifts and turning points through overbought and oversold readings, crossovers, and divergence.
- Multiple signals: Traders can look at crossovers, divergences, and changes in direction to identify potential setups.
Limitations
- False signals: Signals can be generated when there is a sideways or choppy market. This can result in many false trading opportunities.
- Sensitivity to Settings: Fast settings can cause more noise to occur but will be quick to react. Slow settings can cause lagging.
- Limited market context: The indicator does not account for fundamental developments, such as interest rate decisions or company earnings, and cannot guarantee future price direction.
- Persistent extreme readings: Overbought and oversold levels may persist in a strong trending market.
Conclusion
The stochastic oscillator is used by traders to determine momentum within the market. Understanding each part of the indicator, including %K, %D, overbought and oversold points, crossovers, and divergence can help traders to identify possible trading opportunities.
However, it should not be viewed as a stand-alone indicator, and therefore can be used in conjunction with price action to provide a more well-structured trading strategy. Traders should also consider using trend analysis and good risk management. It is also important to backtest your strategy on historical data and use a demo account to ensure your strategy is performing well under different market conditions before risking any real money.
FAQs
A momentum indicator that compares a closing price with its recent price range.
Look for overbought or oversold readings, crossovers, and divergences alongside price action.
The common default is 14, 3, 3, but the best setting depends on your strategy and timeframe.
Yes, it can help identify short-term momentum shifts, but it can produce false signals.
Any type of trader can utilize the Stochastic Oscillator indicator as long as they know how to use it.

هل أنت مستعد لتطبيق مخاطر منضبطة على العملات المشفرة؟ استكشف أدوات التشفير الجديدة من Audacity Capital واجلب استراتيجية التداول الخاصة بك.
اعرف المزيدالنشرة الإخبارية
انضم إلى نشرتنا الإخبارية.
انضم إلى مجتمعنا الاجتماعي

ابدأ رحلتك اليوم مع تجربتنا المجانية
اعرض مهاراتك وإنجازاتك بفخر من خلال الشهادات واحصل على تقدير لعملك الجاد وتفانيك من المستثمرين المحتملين والأقران.
تجربة مجانيةمقالات ذات صلة
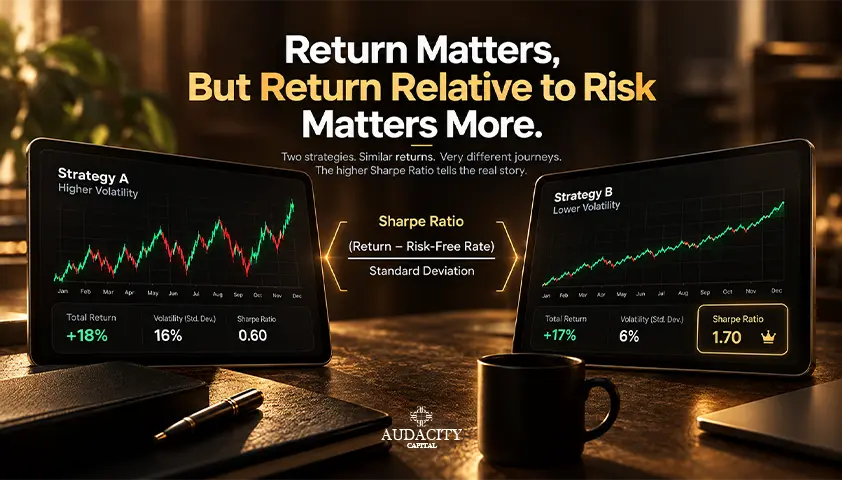
Sharpe Ratio: Formula, Calculation, Uses and Limitations
Learn how the Sharpe ratio works, how to calculate it, what a good score means, and where it can mislead investors, portfolios, and trading strategies.


Swap in Trading: What It Is, How It Is Calculated and How It Affects Your Positions
Learn what a swap in trading is, how overnight fees are calculated, when triple swaps apply, and how swap costs affect forex and CFD positions.
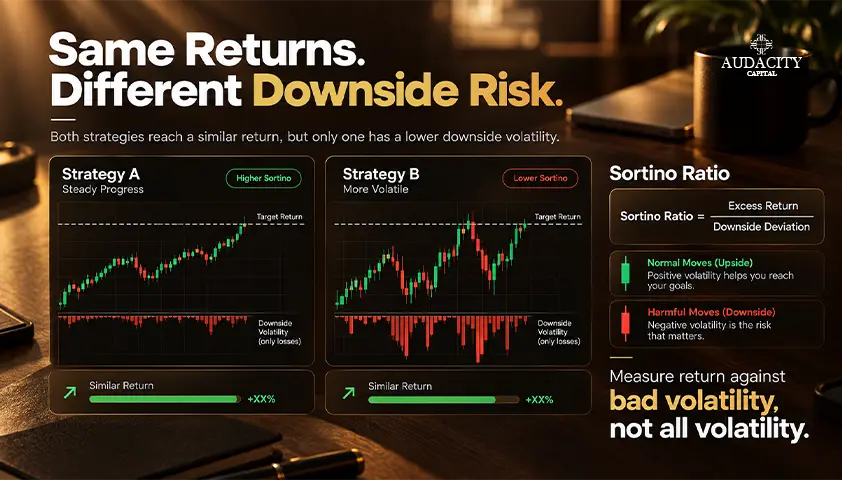
Sortino Ratio in Trading: How It Measures Downside Risk
Learn what the Sortino Ratio means, how to calculate it using downside deviation, and how traders use it to compare risk-adjusted performance.
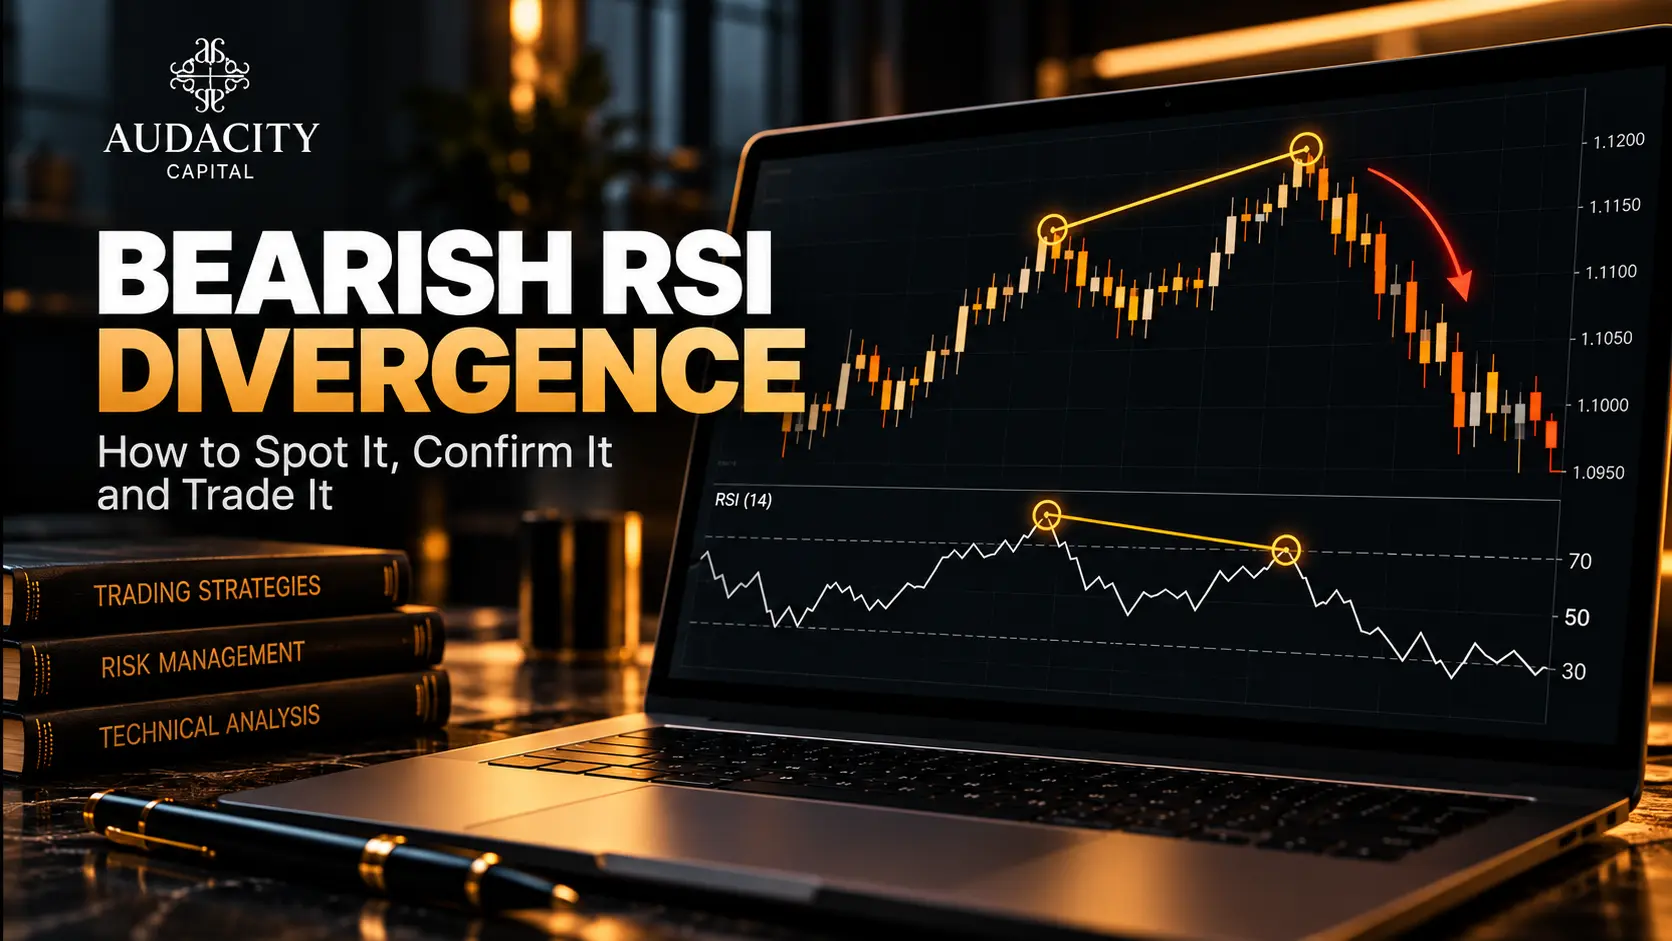
Bearish RSI Divergence: How to Spot It, Confirm It and Trade It
Learn how to identify bearish RSI divergence, confirm reversal signals, plan entries and exits, and manage risk with practical forex trading examples.