


Average Drawdown: Meaning, Calculation & How It Works


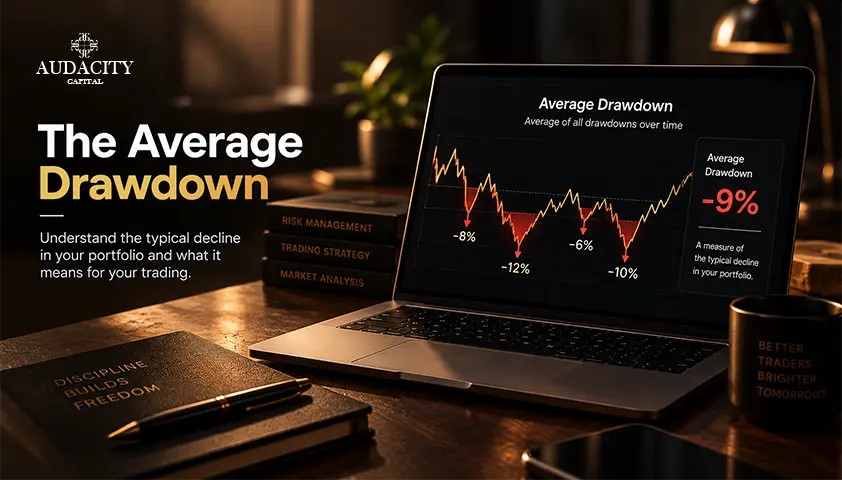
Average drawdown measures the typical decline experienced by a trading account, portfolio, or investment from a previous peak to a subsequent trough over a specified period. It can be used as an indicator when assessing the historical risk and volatility of a trading strategy or portfolio.
While maximum drawdown focuses on the single largest peak-to-trough decline, average drawdown considers the drawdowns observed during the measurement period to provide a broader view of the typical decline experienced by the account.
For traders, average drawdown can be useful when comparing different trading strategies and assessing how frequently and severely an account has historically moved below its previous peak. However, average drawdown should not be considered in isolation. Maximum drawdown, drawdown duration, recovery time, volatility, and overall trading performance can provide additional context.
Key Highlights
- Average drawdown measures the typical decline from a previous peak to a subsequent trough across observed drawdown periods.
- It can provide a broader view of the historical risk and volatility experienced by a trading account or portfolio.
- Maximum drawdown measures the largest peak-to-trough decline, while average drawdown focuses on the typical decline.
- Average drawdown does not show the full risk picture on its own, so traders should also consider maximum drawdown, drawdown duration, recovery time, and other risk measures.
- Traders can potentially manage drawdown through appropriate position sizing, predefined risk limits, disciplined trade selection, and effective risk management.
How Is Average Drawdown Calculated?
Average drawdown can be calculated by identifying the individual drawdown periods within a specified timeframe and calculating the arithmetic mean of those drawdowns.
A simplified formula is:
Average Drawdown = Sum of Individual Drawdowns ÷ Number of Drawdowns
Example
Suppose a trading account experiences three drawdown periods:
- Drawdown 1: 5%
- Drawdown 2: 8%
- Drawdown 3: 3%
The average drawdown would be:
(5% + 8% + 3%) ÷ 3 = 5.33%
Therefore, the average drawdown across these three observed periods is 5.33%.
This calculation provides an indication of the typical size of the drawdowns experienced during the measurement period. However, it does not show the largest decline the account experienced. For that, traders should look at maximum drawdown as well.
Note: The exact calculation method can vary depending on how a platform or performance analysis tool defines and records individual drawdown periods. Traders should use a consistent methodology when comparing strategies or accounts.
What Is the Average Drawdown Duration and Why Is It Important to Measure It?
Average drawdown duration measures the typical amount of time a trading account or portfolio remains below its previous peak before recovering to that level.
Drawdown duration is different from drawdown magnitude. Drawdown magnitude tells you how much the account declined, while drawdown duration tells you how long the account remained below its previous peak.
For example, if three drawdown periods last 10, 20, and 30 trading days, the average drawdown duration would be:
(10 + 20 + 30) ÷ 3 = 20 trading days
A longer average drawdown duration can indicate that a strategy typically takes more time to recover from periods of decline. This can be particularly relevant for traders evaluating their risk tolerance, trading strategy, and ability to remain disciplined during prolonged periods of weaker performance.
When measuring average drawdown duration, consider:
- The length of each drawdown period: Add the duration of each completed drawdown and divide the total by the number of drawdown periods.
- The magnitude of each drawdown: A long drawdown may be relatively small, while a shorter drawdown may involve a much larger decline.
- Market conditions: Volatile, sideways, or rapidly changing markets can affect both drawdown frequency and recovery time.
- Trading strategy: Different strategies can experience different drawdown patterns depending on their trading frequency, holding period, and risk-management approach.
- Recovery time: Consider how long the account takes to return to its previous peak or high-water mark.
How to Interpret Average Drawdown Duration Results
When interpreting average drawdown duration, consider both how long the drawdowns last and how large they are.
A strategy experiencing several small drawdowns that recover quickly may have a very different risk profile from one experiencing fewer but prolonged drawdowns.
Important factors include:
- Magnitude and frequency: The size and frequency of drawdowns can affect the overall risk profile of a strategy.
- Recovery rate: A strategy that regularly recovers from drawdowns may have a different historical profile from one that remains below its previous peak for extended periods.
- Market volatility: Changes in market conditions can influence both the size and duration of drawdowns.
- Time horizon and risk tolerance: A prolonged drawdown may be more difficult to manage for a trader with a shorter time horizon or lower tolerance for losses.
Average drawdown duration should therefore be considered alongside average drawdown and maximum drawdown rather than used as a standalone measure.
Average Drawdown vs Maximum Drawdown
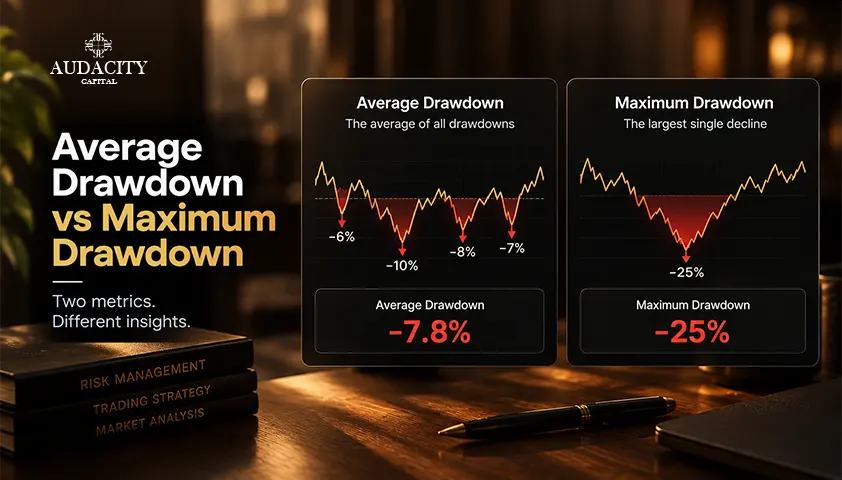
Maximum drawdown (MDD) measures the largest peak-to-trough decline experienced by a trading account or portfolio during a specified period. Average drawdown, on the other hand, looks at the typical size of the observed drawdowns.
Feature | Average Drawdown | Maximum Drawdown |
|---|---|---|
Definition | Average size of observed drawdowns | Largest peak-to-trough decline |
Main focus | Typical downside | Worst historical downside |
Use case | Understanding typical risk and comparing strategies | Assessing the largest historical decline |
Sensitivity | Can be less affected by a single extreme event | Highly affected by the largest drawdown |
Limitation | May not reveal the severity of the worst drawdown | Does not show the typical size or frequency of drawdowns |
For a more complete assessment, traders can consider average drawdown, maximum drawdown, drawdown duration, and recovery time together.
Average Drawdown vs Average Drawdown Duration
Average drawdown and average drawdown duration measure two different aspects of a trading strategy's historical performance.
Metric | What It Measures |
|---|---|
Average Drawdown | The typical size of observed declines |
Maximum Drawdown | The largest peak-to-trough decline |
Average Drawdown Duration | The typical length of drawdown periods |
Maximum Drawdown Duration | The longest period the account remained below a previous peak |
For example, a trading strategy could have a relatively small average drawdown but take a long time to recover. Another strategy could experience larger drawdowns but recover more quickly.
Looking at both drawdown magnitude and duration can therefore provide a more complete understanding of historical risk.
Average Drawdown in Prop Trading
In prop trading, understanding drawdown is particularly important because traders operate within specific account and risk-management conditions.
A trader may experience several small drawdowns while following a trading strategy, but a single large drawdown can have a much greater impact on account performance and whether the trader remains within the applicable programme rules.
For this reason, traders should look beyond average drawdown when evaluating a prop trading strategy. Maximum drawdown, daily loss limits, position sizing, leverage, trading frequency, and recovery time can all be relevant when assessing risk.
At Audacity Capital, traders should review the specific trading rules and drawdown conditions applicable to their chosen programme before trading. Account conditions can vary between programmes, so traders should not assume that a drawdown limit or rule from one programme applies to another.
Understanding your typical drawdown can also help you evaluate whether your trading approach is consistent with the risk parameters of the account you are using.
How to Reduce Your Average Drawdown

There is no method that can eliminate drawdowns completely, but traders can take steps that may help manage the size and frequency of drawdowns.
1. Use Appropriate Position Sizing
Position sizing determines how much capital is exposed to each trade. Taking smaller positions can help limit the impact of individual losing trades on the overall account.
2. Set Predefined Risk Limits
Establish risk limits before entering a trade. This can help prevent a single position or series of trades from having an outsized effect on account performance.
3. Use Stop-Loss Orders Where Appropriate
A stop-loss order can help limit losses when a trade moves against the intended setup. However, execution can vary during fast-moving or illiquid market conditions.
4. Avoid Excessive Leverage
Leverage can increase exposure relative to account capital and can amplify both gains and losses. Traders should understand the leverage and risk conditions applicable to their account before using it.
5. Avoid Overtrading
Taking trades outside a defined strategy can increase unnecessary exposure and potentially contribute to repeated losses. Following a consistent trading plan can help maintain discipline.
6. Review Losing Trades
Reviewing trades during and after a drawdown can help identify whether losses are related to market conditions, strategy performance, execution, or inconsistent risk management.
7. Follow Applicable Prop Firm Rules
Traders using a prop trading programme should understand the applicable daily loss limits, maximum drawdown, trading restrictions, and other account conditions before trading.
How to Monitor and Adjust Your Average Drawdown
Monitoring average drawdown can help traders understand how their strategy behaves during periods of weaker performance.
1. Define Your Trading Time Horizon
Consider whether you are evaluating your strategy over days, weeks, months, or a longer period. Drawdown characteristics can change depending on the measurement period.
2. Record Individual Drawdown Periods
Track each relevant drawdown, including its peak, trough, percentage decline, start date, and recovery date.
3. Calculate Your Average Drawdown
Add the individual drawdowns and divide the total by the number of drawdown periods using a consistent calculation method.
4. Compare Average and Maximum Drawdown
Average drawdown shows the typical decline, while maximum drawdown shows the largest historical decline. Looking at both can provide more context than using either metric alone.
5. Track Recovery Time
Record how long it takes the account to return to its previous peak. This allows you to assess drawdown duration alongside drawdown magnitude.
6. Review Your Strategy
If drawdowns become larger, more frequent, or longer than expected, review your position sizing, trade selection, risk limits, and market conditions before making changes to your strategy.
Conclusion
Average drawdown provides useful information about the typical declines experienced by a trading account or portfolio, but it should not be viewed as a standalone measure of risk.
Traders can gain a more complete understanding of their strategy by considering average drawdown, maximum drawdown, drawdown duration, recovery time, volatility, and overall performance together.
For prop traders, understanding these metrics can also help when evaluating whether a trading strategy is compatible with the applicable account conditions. Before trading with Audacity Capital, review the current rules and drawdown requirements for the specific programme you choose, as programme conditions may differ.
FAQs
Average drawdown measures the typical decline from a previous peak to a subsequent trough across multiple drawdown periods within a specified timeframe.
Average drawdown can be calculated by adding the individual drawdowns observed during a measurement period and dividing the total by the number of drawdown periods.
Average drawdown describes the typical size of observed drawdowns, while maximum drawdown measures the largest peak-to-trough decline during the measurement period.
Not necessarily. A lower average drawdown can indicate smaller typical declines, but it does not rule out the possibility of a large individual drawdown. Maximum drawdown, duration, recovery time, and overall performance should also be considered.
Average drawdown duration measures the typical amount of time a trading account or portfolio remains below its previous peak before recovering to that level.
There is no universal average drawdown percentage that is appropriate for every trader or strategy. The acceptable level depends on factors such as trading strategy, risk tolerance, account conditions, leverage, market conditions, and the trader's objectives.
Traders can manage drawdown by using appropriate position sizing, predefined risk limits, disciplined trade selection, avoiding excessive leverage, and reviewing their strategy's historical performance.
Average drawdown can help traders understand the typical downside experienced by a trading strategy. However, traders should also consider the specific maximum drawdown, daily loss limits, and other risk conditions that apply to their prop trading programme.

Bereit, diszipliniertes Risiko auf Krypto anzuwenden? Entdecken Sie die neuen Krypto-Instrumente von Audacity Capital und bringen Sie Ihre Trading-Strategie mit.
Mehr erfahrenNewsletter
Treten Sie unserem Newsletter bei, um auf dem Laufenden zu bleiben.
Treten Sie unserer sozialen Gemeinschaft bei

Beginnen Sie Ihre Reise heute Mit unserer kostenlosen Testversion
Präsentieren Sie stolz Ihre Fähigkeiten und Leistungen durch Zertifikate und erhalten Sie Anerkennung für Ihre harte Arbeit und Ihr Engagement von potenziellen Investoren und Kollegen.
Kostenlose TestversionVerwandte Artikel

Stock Drawdown: Meaning, Calculation & How It Works
Learn what stock drawdown means, how to calculate it, why it matters, real-world examples, and how traders can manage drawdown and investment risk.


What Is Equity Drawdown in Prop Trading and How Is It Calculated?
Learn what equity drawdown is, how it differs from balance drawdown, how it is calculated, and how traders can manage equity drawdown and risk effectively.

7 Balance-Based Drawdown Prop Firms in 2026 : Honest Review
Compare the 7 best balance-based drawdown prop firms in 2026. Explore drawdown models, profit splits, trading rules, and funding options to find the right prop firm.

Prop Firm With the Highest Drawdown: Why It Matters More Than You Think
Looking for a prop firm with the highest drawdown? Discover flexible risk limits and trading conditions with Audacity Capital and compare top prop firms.