


ATR Indicator Guide: Volatility, Stops & Position Size


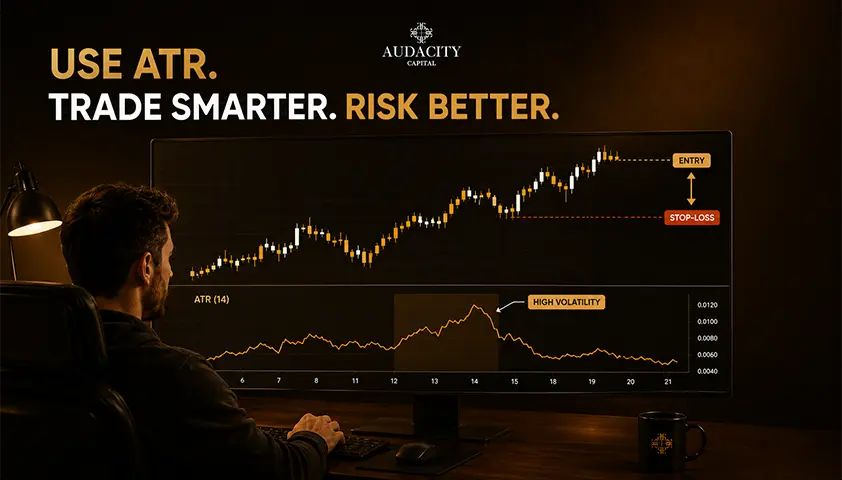
The ATR indicator measures how much a market has been moving over a chosen lookback period. It does not provide any information on the direction of the price trend; it simply measures the size of recent price ranges.
This is important when setting up stop-loss levels. A fixed stop placed at the same dollar or percentage level may be too close to the action in a volatile market and too tight in a quieter market.
The ATR indicator is a tool used to determine the volatility level. So your stop distance can change based on the market conditions that you actually get, rather than the ones you thought you would get when you drew your setup.
What Does the ATR Indicator Measure?
ATR stands for average true range. It is the smoothed value of the true range, which measures the current bar's high-low range. It also takes into consideration gaps from the previous close price. This is why ATR is able to account for overnight price movements much better than the simple range calculation does.
Most charting platforms have a built-in feature to calculate ATR values. The default setting of the lookback period is ATR 14. This implies that the averaging is carried out for the past 14 periods. Think of the period as an ATR setting, rather than the best period.
The most important interpretation rule is that ATR is based on magnitude, not direction. An increasing ATR is an indication that price ranges are widening; decreasing ATR is an indication that price ranges are narrowing. This may occur within a range, downtrend or uptrend.
How to Read Rising and Falling ATR
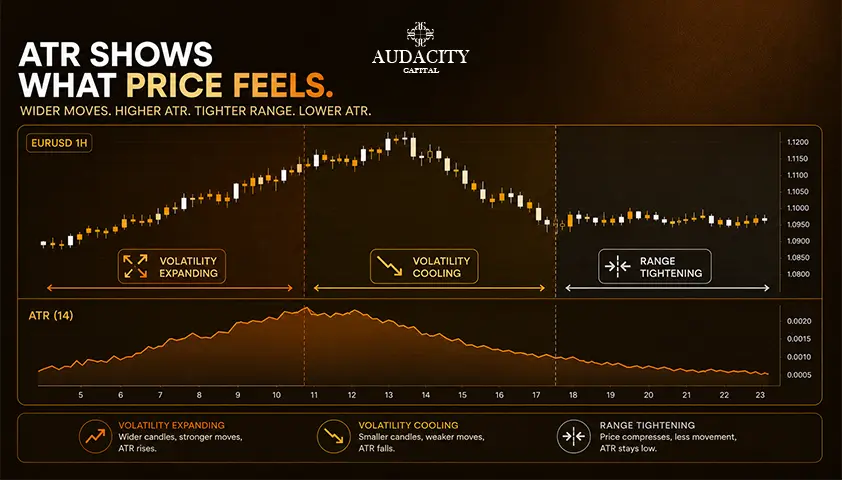
Read the average true range indicator by comparing it to its own previous readings at the same instrument and time frame. It is pointless to interpret a single ATR reading without any context. All that matters is whether it is high or low for this market at the moment.
A change of timeframe alters the question ATR is asking. An ATR(14) on a five-minute chart is a measure of recent five-minute market volatility, whereas an ATR(14) on a daily chart is a daily measure of volatility. These two values aren’t comparable.
The order of the charts to watch for is the following: Volatility contraction, expansion, then normalization. When the ATR is low or decreasing, it is a sign of volatility contraction, which means that the bars are getting smaller.
When ATR increases after a period of decline then it is volatility expansion and it is still not a sign of direction. You require your price structure and a trade thesis for that.


Enter our Free Monthly Trading Competition for a chance to win
Free Funded Account ChallengeHow to Use the ATR Indicator to Set a Stop Loss: Step by Step
That is where most traders fall short in terms of value. Websites that give “entry minus 2 ATR” don't go through the key steps that help your trading account. This is the step-by-step guide on how to set the stop using ATR readings.
Step 1: Formulate your trade thesis and structural invalidation first.
Before you open the ATR panel, pinpoint the price point where your setup will no longer hold true. It can be swing lows, a broken point, the value area edges or the session highs. This will be your stop loss point structurally.
Step 2: Read ATR on the same time frame you will be trading on.
Trying to take a daily ATR as a 5-minute stop loss is a mistake unless that is what you're trading. Volatility on one timeframe does not correlate perfectly with other timeframes.
Step 3: Decide on an established ATR buffer or multiplier.
The first automatic settings that many traders use for their research are a 1.5 ATR stop, 2 ATR stop and larger multipliers for swing trades. This is not a rule, it is an initial setting.
Step 4: Measure the volatility distance with the structural level.
If the necessary stop distance is too large for the setup to make sense, either skip or resize the trade, do not force it.
The stop-loss should not be a formula, but it should be to safeguard your thesis. The ATR-based distance might be unnecessarily wide compared to the invalidation level. This means that you pay for something that you don't need.
If the distance based on volatility is too wide for the setup to work, then you should either skip this trade or adjust the trade size.
Step 5: Determine position size based on the final stop distance.
Your fixed-risk account must remain the same. When your ATR-based stop-loss is wider, the size of your trade must be smaller, not bigger.
ATR Stop-Loss Examples: Quiet vs Volatile Markets
The best way to understand how the ATR volatility indicator can affect the stop would be to test the same setup with two markedly different scenarios. These examples are illustrative, not signals.
Quiet-market example. A trader makes a long trade at $100. ATR reads $1. The volatility stop distance with a tested 1.5x buffer is $1.50 which brings the stop closer to $98.50. Before finalizing, the trader checks the nearby swing low at $98.75.
The structural level is located within the volatility distance and thus provides for a slight margin of error beyond invalidation of $98.50. With a $100 risk budget, the position is roughly $100 ÷ $1.50 = 66 shares.
Volatile-market example. Same settings, same $100 entry, but ATR is now at $3. With the same 1.5x, you now have a $4.50 volatility distance, so the stop is near $95.50.
Retaining the original 66-share size would quietly drive dollar risk to approximately $297. To keep account risk at $100, size drops to roughly $100 ÷ $4.50 = 22 shares.
This setup remained the same. Volatility did. This is what volatility-based stop loss is all about—stop distance adjusts, and size adjusts along with it.
What ATR Multiplier Should You Use?
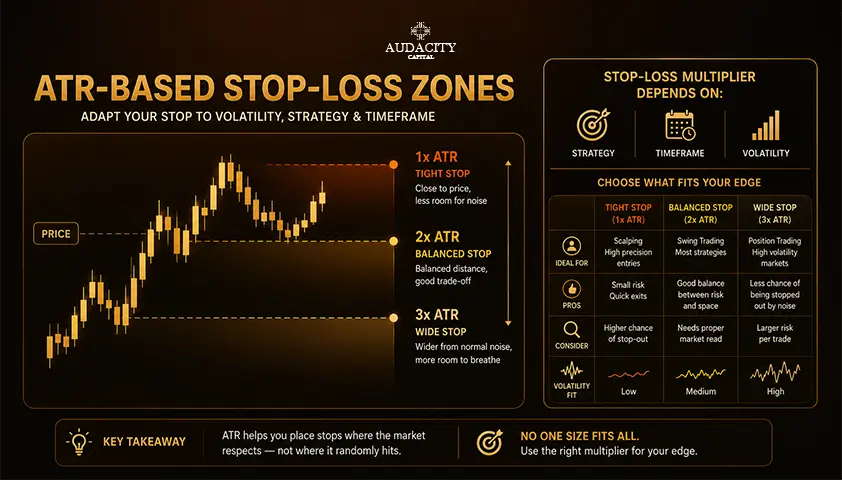
There is no ideal universal ATR multiplier. A low multiple means that your stop will be close to the entry, while exposing the trade to the usual market noise. A high multiple will give you enough room in your trade, but will need a smaller position size.
Your multiplier should be a part of your entire trading plan. Mean-reversion entry, breakout continuation, and a multi-day trend trade should not automatically use the same multiple. These factors affect the multiplier choice differently.
Multiplier | Trade-off | What to test |
1x ATR | Tight stop, higher chance of noise hits | Very short-term or high-precision entries |
1.5x ATR | Moderate buffer, common intraday starting point | Intraday and short swing setups |
2x ATR | Wider room, absorbs more noise, needs smaller size | Swing trades and trend continuations |
3x ATR | Loose stop, position size drops significantly | Longer-hold trend following |
Any multiplier needs to be tested as a component of your whole trading strategy, including your entries, exits, commissions, duration of the hold, sample size and drawdown. The ATR multiplier chosen alone says nothing.
ATR Stop vs Fixed Stop vs Structure-Based Stop
Traders usually pick between three families of stops. Each has a specific weakness.
Method | Adapts to volatility | Respects structure | Main weakness | How to test it |
Fixed dollar or percentage stop | No | No | Same distance in quiet and violent markets | Compare results across high and low ATR regimes |
Pure ATR stop | Yes | Not directly | May ignore the level that invalidates the thesis | Overlay stop against swing points on historical trades |
Structure-based stop | No | Yes | Can sit inside normal noise | Measure how often stops trigger before thesis breaks |
Hybrid: structure with ATR buffer | Yes | Yes | More rules to define and manage | Compare hit-rate and expectancy against pure methods |
The practical hybrid is a strong testing framework, not a guaranteed best method. Start with structural invalidation. Then use ATR to judge whether that level needs a volatility buffer. Resize the position from the final distance.
How ATR Stop Distance Changes Position Size
Position sizing is precisely where the ATR stop really comes into play. The ATR stop can only make the risk management more consistent if the position size changes according to the stop loss distance. Increased distance with unchanged position size means bigger losses.
It's simple math: position size = planned dollar risk ÷ risk per unit. If stop loss distance doubles but dollar risk remains the same, then position size must drop by half.
Two-column example, same $100 risk budget:
- Quiet market, $2 stop distance: $100 ÷ $2 = 50 shares.
- Volatile market, $4 stop distance: $100 ÷ $4 = 25 shares.
In futures, forex and CFD markets, convert the stop distance in points, ticks or pips into dollars based on the pip value of your contract size.
A "40 pip" stop does not equal "$40" until you multiply it by the pip value for your lot size.
How to Trail a Stop with ATR
An ATR trailing stop follows a favorable move while keeping the trailing distance linked to volatility. As price advances, the stop steps up (or down for shorts) by an ATR-defined amount.
Once tightened, the trailing stop should not be widened simply because ATR later increases. That defeats the purpose of trailing.
The Chandelier Exit is a common ATR-based trailing system. It sets the stop as a certain multiple of ATR below the highest high (or above the lowest low) since entering the position.
The calculation itself is simple, but the idea is important here: allow for the trend movement within the limits of current volatility without reducing the profit.
Test both strategies yourself. The entry-based ATR stop is fixed upon entering the position, while the trailing ATR stop adjusts as the trade progresses. Rapid trailing allows protecting profits faster, but it will end up closing the trend earlier.
Slow trailing will provide more gains from the trend, but it will also give back more on the reversal. Neither is universally better.
When ATR-Based Stops Can Fail
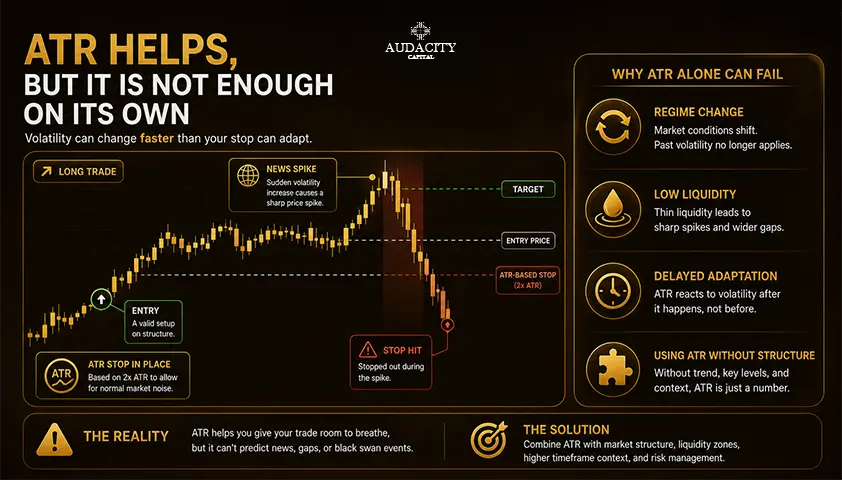
ATR is backward-looking. It smooths recent ranges, so it will not warn you about an earnings release, a rate decision, an overnight gap, or a sudden liquidity shock. Those events can travel several ATR distances before the indicator adjusts.
Stop orders also carry execution risk. In fast markets, the fill can sit meaningfully away from the trigger price. ATR does not eliminate slippage or gap risk, and no multiplier does.
After a volatility shock, ATR often stays elevated for a while. A mechanically wide stop may make the next trade unattractive because required position size becomes too small or the stop no longer aligns with the setup logic.
Treat ATR as a risk input, not a shield against every market event. Event awareness, liquidity judgment, and a hard maximum-risk rule still belong in every plan.
Common ATR Indicator Mistakes
1. Reading rising ATR as bullish or falling ATR as bearish ATR has no directional information.
2. Applying 1.5x, 2x, or 3x on every market and timeframe without testing whether the multiple fits.
3. Measuring the stop only from entry price and ignoring the level that actually invalidates the thesis.
4. Widening the stop because volatility increased but keeping the same position size, which quietly increases dollar risk.
5. Changing ATR settings mid-trade to keep a losing position alive. Rules should be set before entry.
6. Assuming an ATR stop protects against gaps, slippage, or news-event risk. It does not.
Conclusion
The basic idea is fairly simple: use ATR to understand how much the market is moving, then use price structure to decide where the trade is actually invalidated.
ATR can help you judge whether that level needs extra room. Once the stop is set, adjust your position size so the dollar risk stays within your limit
This stop can be helpful in making your risk management approach more adaptive in both quiet and volatile markets. It won’t prevent losses, guarantee performance improvement or substitute your decision-making process. No multiplier will do it either.
The trader who knows how to set the stop loss with ATR sees it as just one element of their overall approach. This includes structural analysis, events monitoring, and fixed risk-per-trade rule.
Frequently Asked Questions
It tells you the average size of recent price ranges, including gaps. That is a volatility reading, not a signal. It does not indicate whether price is likely to rise or fall next.
No. A high ATR means recent ranges are large, which can happen in strong uptrends, sharp downtrends, or two-way volatile conditions. Direction has to come from price structure or your strategy rules, not from ATR itself.
Fourteen is a common default, not a universal best. Shorter lookbacks react faster to recent conditions, longer ones smooth more. The correct setting depends on your timeframe, holding period, and how the setting performs in testing.
Not automatically. A 2x buffer absorbs more noise but requires a smaller position to keep risk constant. A 1x buffer allows larger size but is hit more often by normal fluctuation. Which one fits depends on your entry precision, expected holding time, and tested results.
Anchor the logic to the level that invalidates your trade, then check whether current volatility asks for extra buffer. A stop calculated only from entry price can ignore the chart level that actually matters, and a stop placed exactly at structure can sit inside normal noise.
Divide your planned dollar risk by the risk per unit implied by the ATR-based stop. If your risk budget is $100 and the stop distance equals $2 per share, size is around 50 shares. When ATR widens the stop, size falls so that dollar risk stays the same.
Yes. ATR captures average behavior, but individual bars regularly exceed the average. Add in gaps, news moves, and thin-liquidity spikes, and any stop can be triggered even when it is placed thoughtfully. Wider does not mean safe, and no stop method removes market risk.

¿Listo para aplicar un riesgo disciplinado a las criptomonedas? Explore los nuevos instrumentos de cripto de Audacity Capital y traiga su estrategia de trading.
Aprender másBoletín
Únase a nuestro boletín para mantenerse al día.
Únete a Nuestra Comunidad Social

Comienza Tu Viaje Hoy Con Nuestra Prueba Gratuita
Muestra con orgullo tus habilidades y logros a través de certificados y obtén reconocimiento por tu arduo trabajo y dedicación de posibles inversores y compañeros.
Prueba GratuitaArtículos Relacionados

Bullish RSI Divergence: How to Spot, Confirm and Trade It
Learn how to identify bullish RSI divergence, confirm reversal signals, choose entries, set stop losses, and manage risk effectively.

Sharpe Ratio: Formula, Calculation, Uses and Limitations
Learn how the Sharpe ratio works, how to calculate it, what a good score means, and where it can mislead investors, portfolios, and trading strategies.
All About the Shooting Star Candlestick Pattern – Learn to Decode It
Learn what the shooting star candlestick pattern means, how to identify it, confirm bearish reversal signals, and manage trading risk.

Swap in Trading: What It Is, How It Is Calculated and How It Affects Your Positions
Learn what a swap in trading is, how overnight fees are calculated, when triple swaps apply, and how swap costs affect forex and CFD positions.